2QFY2016 Result Update | Infrastructure
November 16, 2015
IL&FS Transportation Networks
NEUTRAL
CMP
`89
Performance Highlights
Target Price
-
Quarterly highlights - Consolidated
Y/E March (` cr)
2QFY16 1QFY16 2QFY15
% chg (yoy)
% chg (qoq)
Investment Period
-
Net sales
1,872
1,644
1,502
24.7
13.8
EBITDA
659
530
616
7.1
24.3
Stock Info
Reported PAT
69
3
99
(30.1)
nmf
Source: Company, Angel Research; nmf- Not Meaningful
Sector
Infrastructure
IL&FS Transportation Networks (ITNL)’ consolidated revenues for 2QFY2016
Market Cap (` cr)
2,941
were up 24.7% yoy to `1,872cr, reflecting a 38.7% increase in Construction
Net debt (` cr)
22,736
business income to `1,223cr. During the quarter, ITNL’s revenues benefitted from
Beta
1.0
`135.6cr of compensation claim. On adjusting for the same, adj. revenues were
52 Week High / Low
223/84
up 15.6% yoy to `1,736cr. Higher contribution from the low margin Construction
business led to a 578bp yoy decline in EBITDA margin to 35.2%. Despite a 7.1%
Avg. Daily Volume
68,265
yoy EBITDA growth, higher interest and depreciation expenses led to a 30.1%
Face Value (`)
10
decline in PAT to `69cr. On adjusting for compensation claims, ITNL would have
BSE Sensex
25,611
reported adj. losses of `66cr.
Nifty
7,762
ITNL reported an order backlog of `15,023cr at 2QFY2016-end, which gives
revenue visibility for the construction segment for over the next 36 months.
Reuters Code
ILFT.BO
Bloomberg Code
ILFT@IN
The consolidated debt stood at `26,213cr, reflecting a D/E ratio of 4.5x (vs. D/E
ratio of 3.7x at 2QFY2015-end, when debt stood at `21,177cr).
ITNL’s incremental equity requirement towards BOT projects for the next 2-3
Shareholding Pattern (%)
years is at ~`495cr. 8 of the ongoing BOT projects are expected to report Date
Promoters
70.8
of Completion (CoD) in the next 12 months, in-turn contributing to FY2016-17E
MF / Banks / Indian Fls
2.5
Toll/ Annuity Income.
FII / NRIs / OCBs
7.9
Outlook and Valuation: Despite ITNL’s robust order backlog and strong
execution capabilities, we are concerned about its higher consol. D/E ratio, which
Indian Public / Others
18.8
is eating into profits. Even though ITNL successfully raised `740cr through the
rights issue recently, we sense this would not be enough to address the Balance
Abs. (%)
3m
1yr
3yr
sheet concerns, and we believe more needs to be done. The Management
continues to pursue strategic initiatives which should lead to debt reduction;
Sensex
(8.8)
(8.7)
38.6
however, we believe containing debt within comfortable levels would take more
ITNL
(23.5)
(51.0)
(49.1)
time than is being anticipated by the Management. This could possibly lead to
continued pressure on the stock. To capture high leverage and delays in strategic
initiatives, we revise down our estimates. We now expect ITNL to report 18.3%
3-Year Daily Price Chart
top-line and negative 17.6% bottom-line (owing to higher interest expenses)
300
CAGR during FY2015-17E. Using SoTP based valuation methodology, we arrive
250
at FY2017E based price target of `97. Given the limited upside potential from
200
the current levels, we maintain our Neutral rating on the stock.
150
Key financials (Consolidated)
100
Y/E March (` cr)
FY13
FY14
FY15E
FY16E
FY17E
50
Net Sales
6,645
6,587
6,304
7,360
8,825
% chg
(0.9)
(4.3)
16.8
19.9
0
Net Profit
520
463
444
218
301
% chg
(11.0)
(4.2)
(50.8)
38.1
EBITDA (%)
27.7
28.7
30.8
34.0
35.9
Source: Company, Angel Research
EPS (`)
29
19
14
7
9
P/E (x)
3.0
4.8
6.2
13.5
9.8
P/BV (x)
0.5
0.4
0.4
0.4
0.4
RoE (%)
14.9
10.6
7.5
3.2
3.7
RoCE (%)
9.7
8.3
6.7
7.3
7.9
Yellapu Santosh
EV/Sales (x)
2.4
3.1
4.0
3.8
3.6
022 - 3935 7800 Ext: 6828
EV/EBITDA (x)
8.5
10.8
12.8
11.0
10.1
Source: Company, Angel Research; CMP as of 13 Nov, 2015
Please refer to important disclosures at the end of this report
1
ITNL | 2QFY2016 Result Update
Exhibit 1: Quarterly Performance (Consolidated)
Particulars (` cr)
2QFY16
1QFY16
% chg (qoq) 2QFY15
% chg (yoy) 1HFY16
1HFY15
% chg (yoy)
Net Sales
1,872
1,644
13.8
1,502
24.7
3,516
2,922
20.4
Total Expenditure
1,213
1,114
8.8
886
36.9
2,327
1,886
23.4
Cost of materials consumed
67
72
(6.9)
34
96.1
138
60
130.0
Construction Contract Cost
709
677
4.8
499
41.9
1,386
1,124
23.3
Employee benefits Expense
126
109
15.7
118
6.1
234
231
1.2
Other Expenses
311
257
21.1
234
33.1
569
471
20.8
EBITDA
659
530
24.3
616
7.1
1,189
1,036
14.9
EBIDTA %
35.2
32.2
41.0
33.8
35.4
Depreciation
59
58
2.4
43
37.2
117
91
29.0
EBIT
600
472
27.0
572
4.8
1,072
945
13.5
Interest and Financial Charges
585
560
4.6
494
18.4
1,145
946
20.9
Other Income
88
93
(6.0)
71
23.0
181
299
(39.5)
PBT before Exceptional Items
103
6
nmf
150
(31.5)
109
298
(63.5)
Exceptional Items
0
0
0
0
0
PBT after Exceptional Items
103
6
nmf
150
(31.5)
109
298
(63.5)
Tax Expenses/ (credit) (note)
48
15
221.0
62
(21.7)
63
81
(22.3)
% of PBT
47.0
244.8
41.1
58.2
27.4
PAT
54
(9)
nmf
88
(38.3)
45
216
(79.0)
Share of profit of Associates (net)
1
(1)
nmf
3
nmf
0
4
nmf
Loss/ (Profit) to Minority Interest
(14)
(13)
nmf
(8)
nmf
(26)
(17)
nmf
PAT after MI, profit share of Associates
69
3
nmf
99
(30.1)
72
237
(69.6)
PAT %
3.7
0.2
6.6
2.0
8.1
Dil. EPS
1.84
0.84
119.0
3.20
(42.5)
1.00
8.01
(87.5)
Source: Company, Angel Research; Note: nmf- Not Meaningful
Consolidated Business Review
Execution during the quarter gains momentum
Led by stronger execution, ITNL reported a 24.7% yoy increase in its consolidated
revenues to `1,872cr.
Construction segment revenues during the quarter reported a 38.7% yoy increase
to
`1,223cr. Construction revenues booked during the quarter include
compensation claim of `135.6cr; adjusting for the same, the segment’s revenues
grew 23.4% yoy. Construction segment revenues during the quarter were booked
from SBEL, CNTL, and BAEL projects.
Elsamex reported 5.0% yoy increase in revenues to `239cr, during the quarter.
This is against the previous quarter’s 6.2% yoy revenue de-growth (owing to forex
loss).
Notably, Toll/ Annuity business reported a 14.6% yoy increase in revenues to
`358cr.
Also, during the quarter, ITNL reported a 103.7% yoy increase in fee income on
account of higher fee bookings from ACEL, FSEL, KNCEL and GRBDCL projects.
On adjusting for compensation claim of `135.6cr, 2QFY2016 adj. revenues grew
15.6% yoy to `1,736cr.
November 16, 2015
2
ITNL | 2QFY2016 Result Update
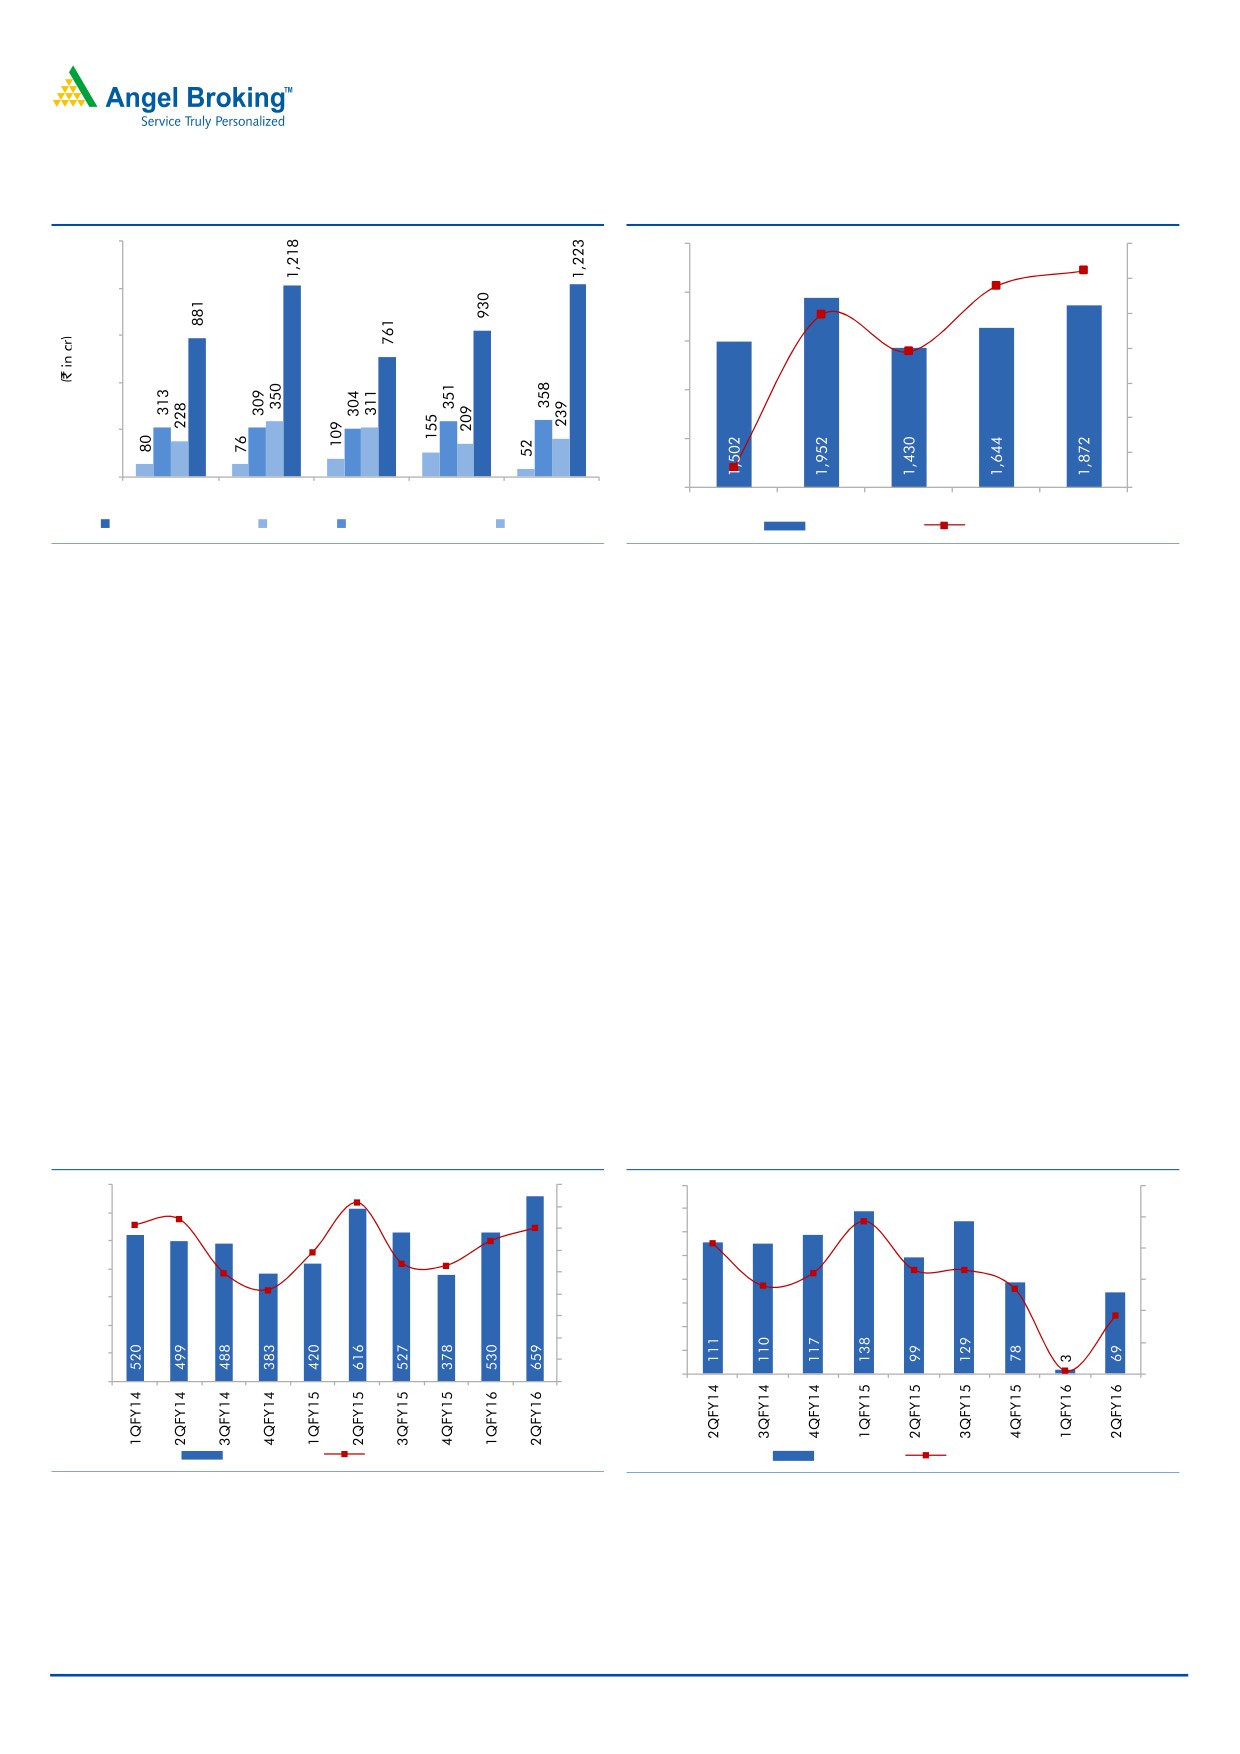
Exhibit 2: Quarterly Income Split
Exhibit 3: Quarterly Net Revenue movement
1,500
2,500
40
24.7
15.8
20
1,200
2,000
0
900
(0.7)
1,500
(20)
(21.8)
600
(40)
1,000
(60)
300
500
(88.8)
(80)
0
0
(100)
2QFY15
3QFY15
4QFY15
1QFY16
2QFY16
2QFY15
3QFY15
4QFY15
1QFY16
2QFY16
Construction Income Elsamex
Toll/ Annuity Income Other Income
Net Income (` cr)
yoy change (%)
Source: Company, Angel Research
Source: Company, Angel Research
Commencement of Moradabad-Bareilly (MBEL) and Warora Chandrapur
(WCBTRL) BOT-Toll projects contributed to 14.6% yoy increase in 2QFY2016 Toll
income. The quarter’s Toll & Annuity Income also benefitted from
(1)
25.8%
increase in toll income from Barwa Adda (to avg. per day toll of `0.15cr),
(2) 22.6% increase in toll income from Baleshwar-Kharagpur (to avg. per day toll
of `0.15cr), (3) 13.6% increase in toll income from Ahmedabad Mehsana (to avg.
per day toll of `0.22cr) and (4) 13.0% increase in toll income from Pune-Solapur
(to avg. per day toll of `0.20cr). These 4 BOT-Toll projects together contributed
16% of the total 2QFY2016 toll income.
EBITDA margins decline to 35.2%
Shift in revenue mix, where higher contribution of the low margin Construction
business was seen during the quarter, led to 578bp yoy EBITDA margin contraction
to 35.2%. On adjusting for compensation claim, the EBITDA margin of the
company in 2QFY2016 stood at 28%. EBITDA margin contraction on a yoy basis
was owing to a 23.4% rise in material expenses which grew 96.1% (to `67cr), and
with Construction expenses growing 41.9% (to `709cr).
Exhibit 4: EBITDA margins decline to 35.2%
Exhibit 5: PAT margins decline to 3.7%
700
35.9
41.0
45
160
12
37.2
9.7
35.2
40
140
8.3
600
10
29.6
26.5
32.2
35
120
500
27.0
24.8
20.9
30
6.4
6.6
6.6
8
100
400
25
5.6
5.4
80
3.7
6
300
20
60
15
4
200
40
10
0.2
2
100
20
5
0
0
0
0
EBITDA (` cr)
EBITDA Margin (%)
PAT (` cr)
PAT Margin (%)
Source: Company, Angel Research
Source: Company, Angel Research
November 16, 2015
3
ITNL | 2QFY2016 Result Update
Higher interest & depreciation exp. led to yoy PAT decline
Despite 7.1% yoy EBITDA growth, the reported PAT declined sharply from `99cr in
2QFY2015 to `69cr in 2QFY2016, mainly on account of higher interest (up 18.4%
yoy to `585cr) and depreciation (up 37.2% yoy to `59cr) expenses. PAT margins
declined from 6.6% in 2QFY2015 to 3.7% in 2QFY2016. On adjusting for
compensation claim, ITNL incurred losses of `66cr. Further, increase in yoy interest
expense is owing to draw-down of already sanctioned debts towards the projects
under construction. Increase in yoy depreciation expense is due to commencement
of operations at MBEL, WCBTRL, and some of the check-posts at MPBCDCL.
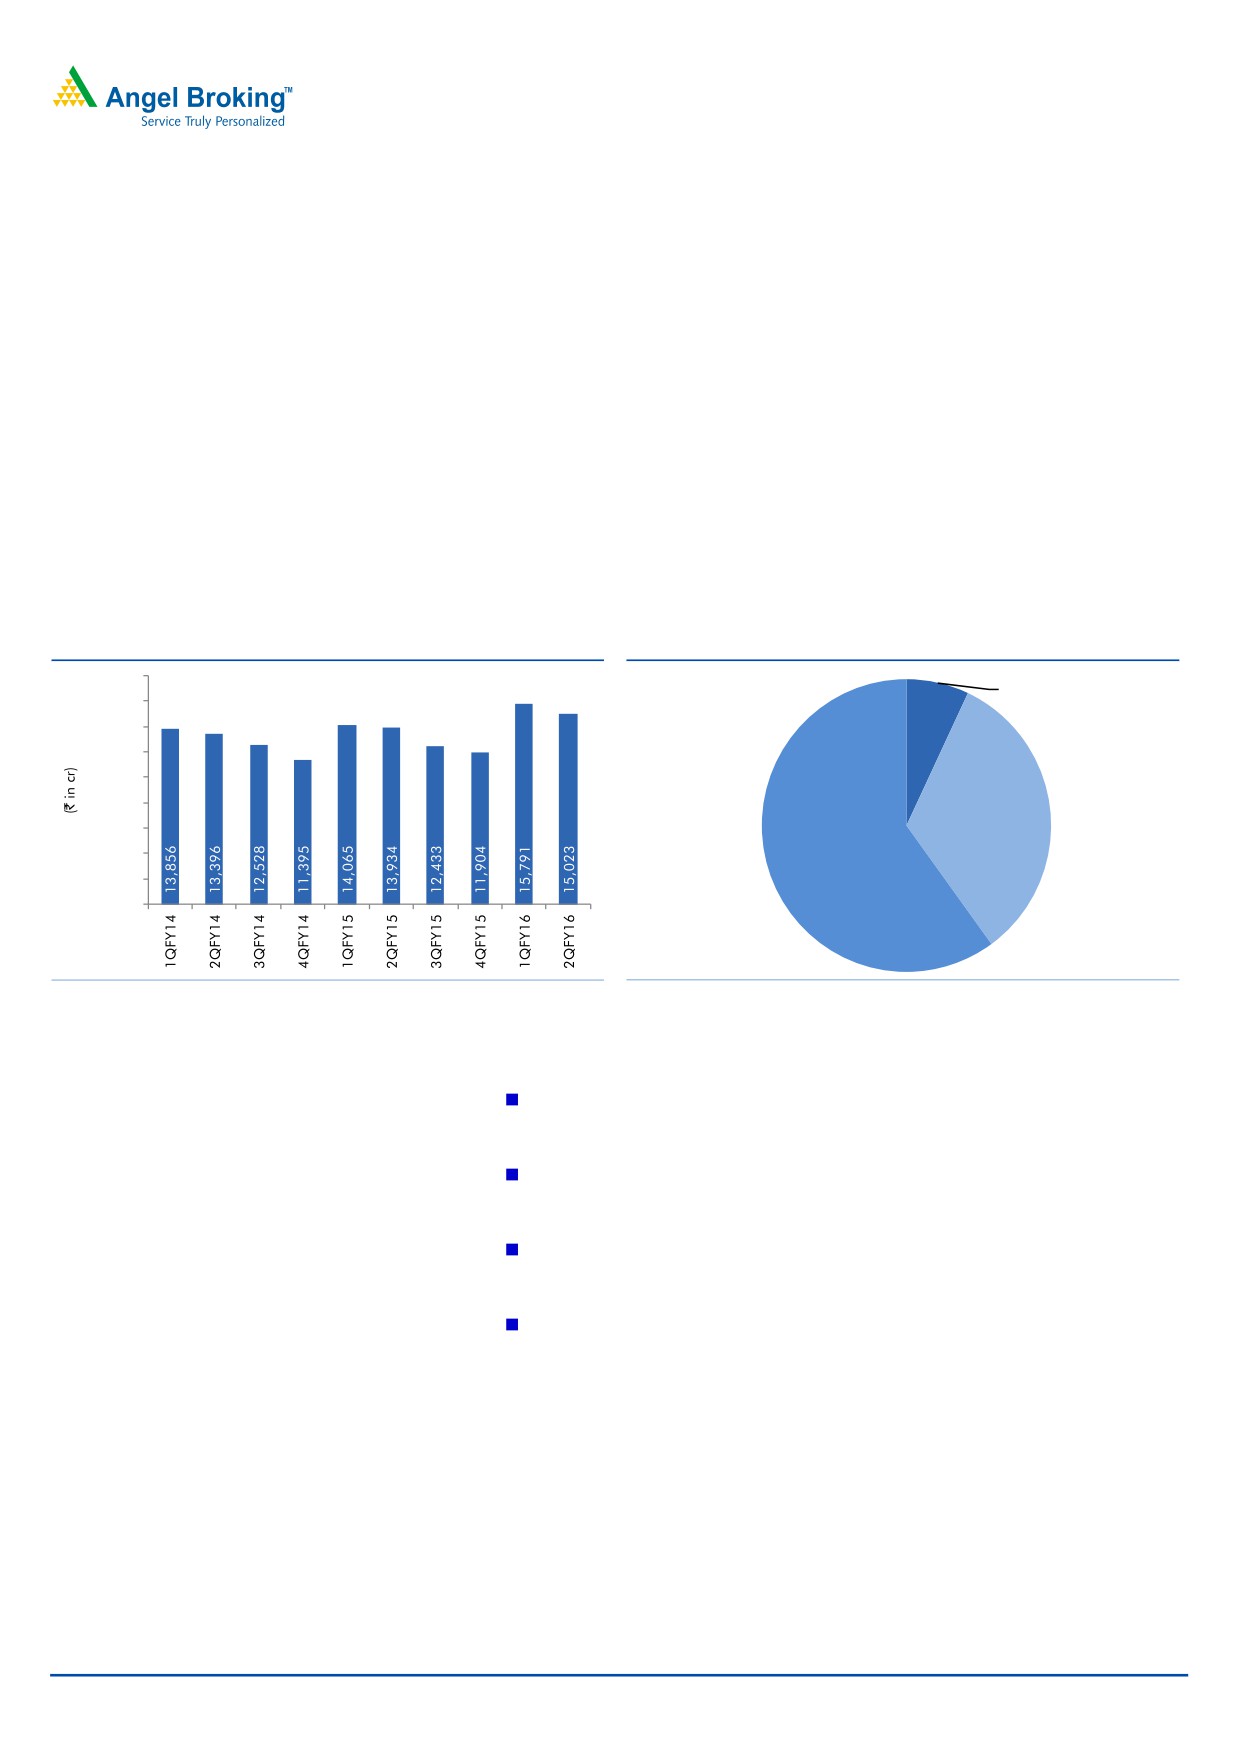
Strong Order backlog of `15,023cr gives better revenue visibility
ITNL at 2QFY2016-end reported an order backlog of `15,023cr, which gives
revenue visibility for the Construction segment for over the next 36 months.
Exhibit 6: Order Book
Exhibit 7: Order Book Split at 2QFY2016-end (in %)
18,000
Non-Road
16,000
Projects, 7%
14,000
12,000
10,000
8,000
Non-NHAI
6,000
Road , 33%
4,000
NHAI, 60%
2,000
0
Source: Company, Angel Research
Source: Company, Angel Research
ITNL to-date in FY2016 has reported 4 BOT project order wins. These include:
4-laning of 141kms stretch between Fagne-Gujarat/ Maharashtra Border
(Package-III, NH-6) on BOT (Toll) basis.
4-laning of 194kms stretch between Amravati-Chikhli (Package-I, NH-6)
on BOT (Toll) basis.
6-laning of 23.5kms stretch between Ranchi Ring Road, section VII from
Kathitanr to Karma on BOT basis.
Upgrade 2 road projects, (i) Bandri-Jaruwakheda, Nirtala-Mandi-Bamora
and Damoh-Hindoriya-Patera section covering 76.23 kms, (ii) Pachawali-
Rannod, Rannod-Pichhore, Bhasula-Chainpur, Vijaypur-Dhanrawad and
Ashok Nagar-Thubon section on performance based contract.
Also, ITNL indicated healthy bid-pipeline of
~`15,018cr, with a major
~`11,569cr of it being at RFQ stage. Notably, ~66% of the bid pipeline
highlighted by the company is from NHAI.
November 16, 2015
4
ITNL | 2QFY2016 Result Update
Exhibit 8: 1QFY2016E Bid Pipeline details
Particular (` cr)
RFP Stage
RFQ Stage
NHAI Projects
3,170
6,748
State Highway Projects
280
4,821
MoRTH Projects
0
0
NHAI EPC Projects
0
0
Metro Transportation Corp. Project
0
0
Total Bid Pipeline
3,450
11,569
Source: Company, Angel Research
Update on BOT Projects
ITNL in YTDFY2016 has reported receipt of Provisional Completion Certificate
(CC)/ Commercial Operations Date (CoD) for 8 stretches of the MP Border check
post project, including, (1) Sagar-Lalitpur Border check post, (2) Nawgaon-Jhansi
Checkpost (S-4) Border check post, (3) Venkatnagar (SS-2) Border check post, (4)
Sendhwa-Khetia Border check post, (5) Ujjain-Jhalawar Border check post, (6)
Balaghat-Gondia Border check post. With these stretches getting operational, the
total count of operational stretches has gone up to 2 Central Control Facility and
19 Border Checkpost (of the total 20 check posts).
SBHL has received provisional completion certificate as on Oct 10, 2015. JSEL has
applied for Completion Certificate.
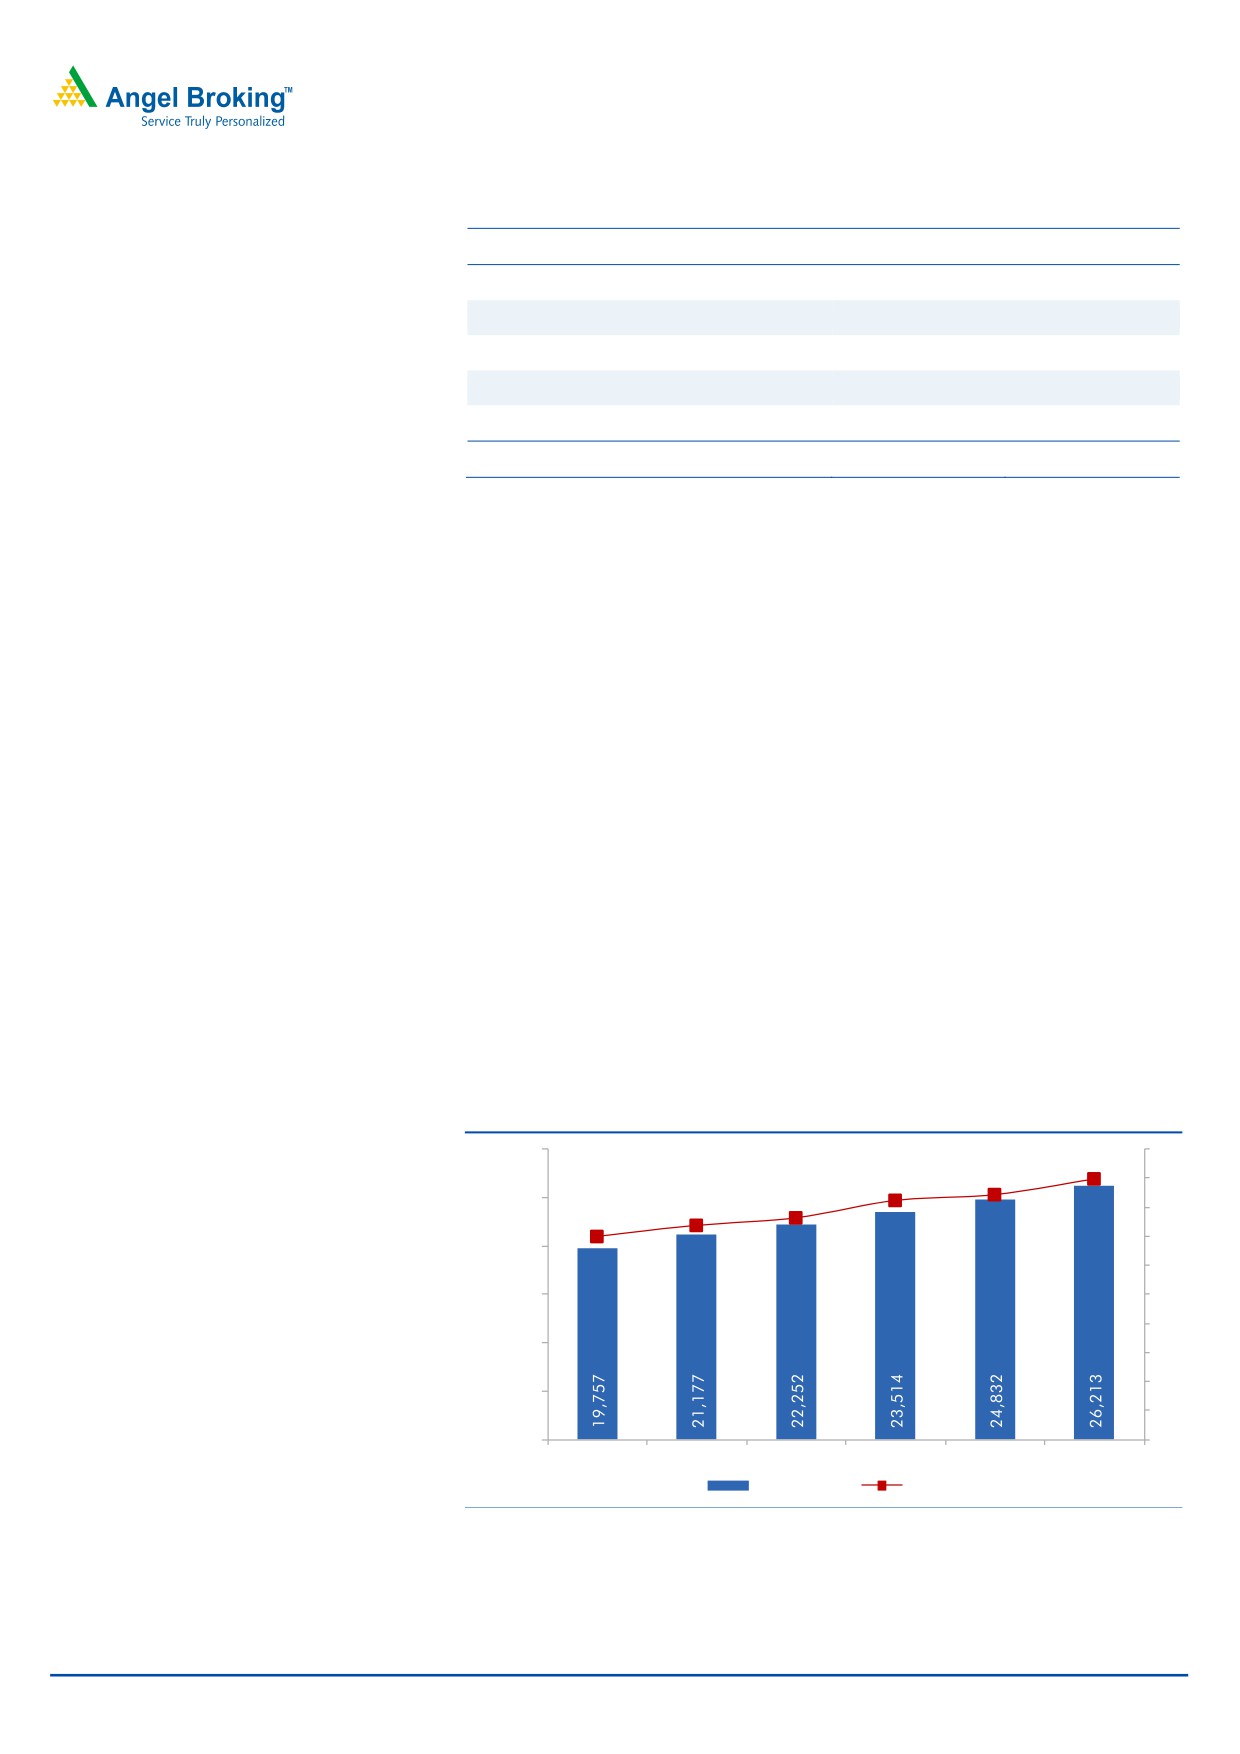
Financial Health of the company
ITNL reported consolidated debt of `26,213cr, reflecting D/E ratio of 4.5x (vs. D/E
ratio of 3.7x at 2QFY2015-end with debt of `21,177cr). ~5% surge in qoq D/E
ratio is owing to draw-down of already sanctioned debt towards projects under
construction.
Exhibit 9: Consolidated Debt & D/E Ratio
30,000
5
4.5
4.1
4.2
5
25,000
3.8
3.7
4
3.5
4
20,000
3
15,000
3
2
10,000
2
1
5,000
1
0
0
1QFY15
2QFY15
3QFY15
4QFY15
1QFY16
2QFY16
Debt (` cr)
D/E (x)
Source: Company, Angel Research
ITNL reported interest coverage ratio at 1.2x (vs 1.3x reported in 2QFY2015). Such
lower interest coverage ratio is owing to longer gestation of BOT projects executed
and many of them being under the investment phase.
November 16, 2015
5
ITNL | 2QFY2016 Result Update
As of 2QFY2016-end, ITNL needs `495cr as equity investment towards BOT
projects in its pipeline (to-date equity invested in BOT projects stands at
~`5,218cr). In addition, new project wins (where FC is yet to be done), would
further add to the above-mentioned equity requirements.
The Management is working on the following strategic initiatives to raise equity for
BOT projects in the pipeline, (1) raise preference equity (passed board resolution
to raise `750cr), (2) sell stake in some of the operational BOT projects, and (3)
securitize some of the operating BOT projects.
Even though ITNL’s Management indicated that these initiatives would unfold by
Mar-2016, we expect possible delays in some of the targeted events unfolding. In
Nov-2015, ITNL successfully raised
`740cr through a Rights issue. The
Management highlighted that money raised from the rights issue would be majorly
used towards debt repayment. On considering the Management’s strategic
initiatives, and debt draw-down plan for SPVs, we expect debt to continue to be at
current levels by FY2016-end. Despite the fund raising exercise, we sense that ITNL
would experience near-term pain, as high leverage would continue to eat into their
profitability. On the whole, we expect a majority of the funding issues to be
addressed in FY2017E, thereby leading to alleviation in Balance Sheet stress,
going forward.
Future Funding requirements
ITNL’s Management highlighted that additional equity requirement towards
existing BOT projects are to the tune of ~`495cr (majorly to be invested in next 2-
3 years).
8 of the ongoing BOT projects are expected to get Date of Completion (CoD) in
the next 12 months, thereby adding to the Toll/ Annuity income in FY2016/2017E.
Exhibit 10: BOT Projects Scheduled CoD
BOT Projects
Scheduled CoD
BAEL
Sep-2016
TRDCL III
Nov-2015
CNTL
May-2016
MPBCDCL
Jan-2016
RIDCOR III
Jun-2016
SBEL
Nov-2015
KSEL
Aug-2016
KNC
Nov-2016
Source: Company, Angel Research
Outlook & Valuation
A major part of the `740cr raised through the Rights issue recently, would be
majorly used towards debt repayment. Considering (1) equity requirements of
`495cr towards existing projects (currently being met through the standalone entity
debt), (2) additional financing requirements towards recently won projects, and (3)
8 more projects expected to commence operations in the next 12 months, there
probably exists requirement for incremental debt as well as equity requirements.
November 16, 2015
6
ITNL | 2QFY2016 Result Update
Anticipating future funding requirements, ITNL in its recent board meeting passed
resolution to (1) increase the borrowing limits of the company (from `9,000cr to
`11,000cr), and (2) allow issuance of `750cr of preference shares. Considering
projects in the pipeline and their current funding requirements (unless the strategic
initiatives highlighted by the Management gain traction), the company should
continue to face near term funding issues, which will continue to keep the balance
sheet under stress. On capturing the impact of the recent rights issue, we increase
our FY2016/17E PAT estimates by 541.2% and 142.7%, respectively.
Exhibit 11: Earnings Revision
FY2016E
FY2017E
Y/E March (` cr)
Old
New Chg (%)
Old
New Chg (%)
Net Sales
7,360
7,360
0.0
8,825
8,825
0.0
EBITDA
2,503
2,503
0.0
3,168
3,168
0.0
EBITDA Margins (%)
34.0
34.0
35.9
35.9
PAT
34
218
541.2
124
301
142.7
PAT Margins (%)
0.5
3.0
1.4
3.4
Source: Angel Research
Maintain Neutral view on ITNL with revised price target of `97
Despite ITNL’s robust order backlog and strong execution capabilities, we are
concerned about its higher consol. D/E ratio, which is eating into profits. Even
though money raised from the rights issue has been used to repay debt, new
projects would require debt funding, which should again lead to increase in debt
levels. The Management is working on strategic initiatives to reduce debt, which in
our view could take a few quarters to materialize. Till then, ITNL’s profitability
would be impacted due to higher interest expenses, given their levered balance
sheet status.
With more visibility from the order book, we view that any news flow on order wins
would not lead to upward re-rating of the stock. It is more of actions taken by the
Management in de-levering the balance sheet which should lead to upwards re-
rating of the stock. Till the time more visibility comes on the Balance Sheet de-
leveraging process, we expect the stock to remain under pressure.
We have used sum-of-the-parts (SOTP) valuation method to arrive at a target price
for ITNL. Considering increase in leverage, we have valued the construction
business at an EV/EBITDA of 4x FY2017E EBITDA, and the BOT projects (inclusive
of YuHe Expressway & Metro Rail) on FCFE basis at a Cost of Equity of 16%. Also,
we have valued Elsamex, and their Surface Transportation Projects (other than
road projects) using P/BV multiple. On adding up all the projects’ value, we arrive
at a SOTP-based target price of `97. Given that all the positives are captured in
the current stock price, we maintain our NEUTRAL rating on stock.
November 16, 2015
7
ITNL | 2QFY2016 Result Update
Exhibit 12: Derivation of SOTP-based target price for ITNL (FY2017E)
FY17E Std.
Target
Target
Value/
% of
Particulars
Segment
Basis
EBITDA (` cr)
Multiple
Value (` cr)
share (`)
SoTP
ITNL's construction business
Construction
747
4
2,987
91
93.3
EV/EBITDA of 4x
Total
2,987
91
93.3
Discounted
Project
Adj. FCFE
Value/
% of
Particulars
Proj. Type
Basis
FCFE (` cr)
Stake
Value (` cr)
share (`)
SoTP
Road BOT projects
Noida Toll Bridge
Toll
552
25%
138
4
4.3
NPV at CoE of 16%
Gujarat Toll Roads
Toll
770
42%
323
10
10.1
NPV at CoE of 16%
West Gujarat Expressway
Toll
197
100%
197
9
9.6
NPV at CoE of 16%
RIDCOR Phase-I & II
Toll
1,683
50%
842
26
26.3
NPV at CoE of 16%
Beawar-Gomti
Toll
400
100%
400
12
12.5
NPV at CoE of 16%
Pune Sholapur
Toll
59
100%
59
2
1.8
NPV at CoE of 16%
Moradabad Bareilly
Toll
840
100%
840
26
26.2
NPV at CoE of 16%
Chandrapur Warora
Toll
273
35%
96
3
3.0
NPV at CoE of 16%
Narkatpally Addanki
Toll
289
50%
144
4
4.5
NPV at CoE of 16%
Kiratpur Ner-Chowk
Toll
1,073
100%
1,073
33
33.5
NPV at CoE of 16%
Sikar Bikaner
Toll
200
100%
200
6
6.3
NPV at CoE of 16%
Baleshwar Kharagpur
Toll
13
100%
13
0
0.4
NPV at CoE of 16%
North Karnataka Expressway
Annuity
163
94%
153
5
4.8
NPV at CoE of 16%
Thiruvananthapuram Phase - I & II
Annuity
(7)
50%
(4)
(0)
(0.1)
NPV at CoE of 16%
AP Expressway
Annuity
(2)
100%
(2)
(0)
(0.1)
NPV at CoE of 16%
Hyderabad Ring Road
Annuity
124
26%
32
1
1.0
NPV at CoE of 16%
East Hyderabad Expressway
Annuity
88
74%
65
2
2.0
NPV at CoE of 16%
Hazaribagh Ranchi Expressway
Annuity
110
74%
81
2
2.5
NPV at CoE of 16%
Jharkhand roads Ph-I & II
Annuity
679
100%
679
21
21.2
NPV at CoE of 16%
Chenani Nashri
Annuity
793
100%
793
24
24.8
NPV at CoE of 16%
Jorabat Shillong
Annuity
237
50%
118
4
3.7
NPV at CoE of 16%
Total
8,642
6,350
193
198.3
Elsamax
295
1.0
295
9
9.2
Valued at 1x its BV
YuHe Expressway
Toll
177
49%
87
3
2.7
NPV at CoE of 16%
Vansh Nimay Infraprojects
16
1.0
16
0
0.5
Valued at 1x its BV
Metro Rail Gurgaon
FCFE
326
59%
194
6
6.0
NPV at CoE of 16%
MP Entry Point project
203
51%
103
3
3.2
Valued at 1x its BV
Other Investments
145
1.0
145
4
4.5
Valued at 1x its BV
Net Debt- FY2016E
(6,975)
(212)
(217.9)
Standalone Net Debt
Grand Total
3,201
97
100.0
No. of shares
33
Upside
9%
CMP
89
Source: Company, Angel Research
November 16, 2015
8
ITNL | 2QFY2016 Result Update
Investment arguments
Market leader in the growing BOT space: ITNL is a surface transport player, with
an established track record of successfully bidding, developing and operating road
BOT projects on a commercial basis. ITNL was one of the first movers in the road
development segment. The company bagged Noida Toll bridge project in 1998.
Since then, it has come a long way and has built sizeable portfolio currently. The
company has one of the largest BOT portfolios in India, encompassing 31 road
projects covering 14,667 lane kms spread across 16 states. Their 2QFY2016
order book at `15,023cr, gives construction segments revenue visibility for over the next
36 months.
Pan-India presence: ITNL has 31 BOT Road projects well spread across 16 states
in India. The company has decent exposure to state highways, which differentiates
it from peers. The one major advantage that state highway projects enjoy over
national highways is that they can be bundled with land, making the projects
viable. Such diversification strategy prevents the company from any fluctuation in
the revenue stream given its limited exposure to any one region or project.
Hedged revenue stream: We believe ITNL has a hedged road BOT asset portfolio
currently, as it is bifurcated into toll and annuity projects in revenue terms, thereby
reducing its dependence on traffic-related revenue inflow. Recent project win from
Kenyan BOT-Annuity project strengthens our view that going forward too, ITNL
would continue to have a balanced revenue mix of Annuity and Toll.
ITNL’s levered BS puts it in a tough spot: ITNL is currently sitting on a consol. D/E
ratio of 4.5x (reflecting debt of `26,213cr). On considering, (1) equity requirement
of `495cr towards existing BOT projects, (2) 8 BOT projects expected to commence
operations in the next 12 months, and (3) their levered Balance Sheet status, we
are of view that the growth for the company would not flow down entirely to the
PAT level, as higher interest expenses would eat into the EBITDA. Hence, till the
time more visibility emerges on the Balance Sheet de-leveraging process, we
expect the profitability to be under pressure.
Key concerns
Even though expectations are high for allocation towards Roads and Highways
vertical in the upcoming budget, any slowdown in the award activity from NHAI
could affect road-focused players such as ITNL.
ITNL has faced execution delays across few projects. Prolonged delays in project
execution beyond the time schedule could act as risk to our estimates.
BOT projects are inherently highly-levered projects. Hence, delays in the correction
of interest rates than our expectations could be a risk to our assumptions.
The Management has highlighted plans to pursue fund raising / strategic initiatives
which should materialize in the next 2-3 quarters. Any delays beyond that could
act as a risk to our estimates.
November 16, 2015
9
ITNL | 2QFY2016 Result Update
Company background
ITNL promoted by IL&FS was incorporated in Nov 2000. Over the years, ITNL
emerged as the largest Surface Transportation Infrastructure Company in Indian.
ITNL is involved in the development, operations and maintenance of surface
transportation infrastructure projects encompassing national and state highways,
roads, tunnels, flyovers and bridges. The company performs a range of project
development activities from project conceptualization to commissioning and
commencement of commercial operations. ITNL has presence in various surface
transportation sub-sectors, such as urban transportation, railways, border check
posts and parking complexes.
November 16, 2015
10
ITNL | 2QFY2016 Result Update
Profit & Loss Statement (Consolidated)
Y/E March (` cr)
FY13
FY14
FY15
FY16E
FY17E
Net Sales
6,645
6,587
6,304
7,360
8,825
% Chg
(0.9)
(4.3)
16.8
19.9
Total Expenditure
4,807
4,697
4,362
4,858
5,657
Cost of Materials Consumed
156
227
242
221
247
Construction Contract Cost
3,423
2,984
2,599
3,202
3,733
Employee benefits Expense
382
414
459
449
525
Other Expenses
846
1,072
1,063
986
1,152
EBITDA
1,838
1,890
1,941
2,503
3,168
% Chg
2.8
2.7
28.9
26.6
EBIDTA %
27.7
28.7
30.8
34.0
35.9
Depreciation
94
151
152
238
401
EBIT
1,743
1,739
1,789
2,265
2,767
% Chg
(0.3)
2.9
26.6
22.2
Interest and Financial Charges
1,119
1,471
1,833
2,391
2,735
Other Income
144
215
525
383
306
PBT
768
483
481
256
337
Tax
227
27
80
54
78
% of PBT
29.6
5.5
16.7
21.0
23.0
PAT before Extraordinary item
541
457
400
202
260
Extraordinary item
0
0
0
0
0
PAT before Minority Interest
541
457
400
202
260
Minority Interest
(25)
1
(29)
(24)
(49)
Share of Profit/ (Loss) of Associates
5
5
15
(8)
(7)
PAT after MI, profit share from Assoc.
520
463
444
218
301
% Chg
(11.0)
(4.2)
(50.8)
38.1
PAT %
7.8
7.0
7.0
3.0
3.4
Diluted EPS
29
19
14
7
9
% Chg
(36.5)
(23.2)
(53.7)
38.1
November 16, 2015
11
ITNL | 2QFY2016 Result Update
Balance Sheet (Consolidated)
Y/E March (` cr)
FY13
FY14
FY15
FY16E
FY17E
Sources of Funds
Equity Capital
194
571
623
705
705
Reserves Total
3,446
4,433
5,096
6,068
6,487
Networth
3,640
5,004
5,719
6,773
7,192
Minority Interest
358
459
291
291
291
Total Debt
14,359
18,817
23,514
25,994
30,394
Deferred Tax Liability
243
199
108
108
108
Total Liabilities
18,599
24,478
29,632
33,166
37,985
Application of Funds
Gross Block
10,190
14,282
17,438
18,630
21,690
Accumulated Depreciation
580
795
947
1,185
1,587
Net Block
9,610
13,487
16,491
17,444
20,103
Capital WIP
48
50
70
60
50
Investments
687
469
663
708
743
Goodwill
523
575
581
581
581
Current Assets
Inventories
17
17
14
20
23
Sundry Debtors
752
988
1,126
1,109
1,257
Cash and Bank Balance
420
671
777
1,295
1,225
Loans, Advances & Deposits
1,417
2,076
2,377
2,660
3,045
Other Current Asset
7,105
8,782
10,838
12,510
14,362
Current Liabilities
1,991
2,655
3,323
3,240
3,424
Net Current Assets
7,720
9,879
11,808
14,353
16,488
Deferred Tax Asset
11
18
20
20
20
Total Assets
18,599
24,478
29,632
33,166
37,985
November 16, 2015
12
ITNL | 2QFY2016 Result Update
Cash Flow Statement (Consolidated)
Y/E March (` cr)
FY13
FY14
FY15
FY16E FY17E
Profit before tax
768
483
481
256
337
Depreciation & Amortization Exp.
109
161
164
253
417
Other non-Cash Expenses
(91)
(119)
(58)
165
(375)
Change in Working Capital & Oth. Adj.
1,320
1,522
(1,628)
(1,724)
(1,443)
Cash Generated from Operations
2,106
2,048
(1,042)
(1,050)
(1,063)
Direct taxes paid
(158)
(251)
(155)
(211)
(142)
Net Cash Flow from Operations
1,947
1,797
(1,197)
(1,261)
(1,205)
(Inc)/ Dec in Fixed Assets
(3,057)
(3,196)
(3,176)
(1,182)
(3,050)
(Inc)/ Dec in Investments
(234)
(60)
(193)
(45)
(35)
(Inc)/ Dec in Other Investing Cash Flows
(1,806)
(868)
(231)
(250)
(150)
Cash Flow from Investing
(5,097)
(4,123)
(3,600)
(1,477)
(3,235)
Issue/ (Buy Back) of Equity
0
746
525
740
0
Inc./ (Dec.) in Loans
2,813
1,509
4,697
2,480
4,400
Dividend Paid (Incl. Tax)
(91)
(94)
(116)
(110)
(175)
Other Financing Cash Flows
507
276
(144)
145
145
Cash Flow from Financing
3,230
2,437
4,963
3,255
4,370
Inc./(Dec.) in Cash
80
111
166
517
(70)
Opening Cash balance & Oth. Adj.
278
500
611
777
1,295
Closing Cash balances
358
611
777
1,295
1,225
November 16, 2015
13
ITNL | 2QFY2016 Result Update
Key Ratios (Consolidated)
Y/E March
FY13
FY14
FY15E
FY16E
FY17E
Valuation Ratio (x)
P/E (on FDEPS)
3.0
4.8
6.2
13.5
9.8
P/CEPS
2.7
3.6
4.0
6.7
4.4
Dividend yield (%)
2.1
2.7
2.4
2.1
2.5
EV/Sales
2.4
3.1
4.0
3.8
3.6
EV/EBITDA
8.5
10.8
12.8
11.0
10.1
EV / Total Assets
0.8
0.8
0.8
0.8
0.8
Per Share Data (`)
EPS (fully diluted)
29.4
18.7
14.3
6.6
9.2
Cash EPS
32.7
24.6
22.4
13.4
20.1
DPS
4.0
5.1
4.0
3.5
4.0
Book Value
187
203
232
206
219
Returns (%)
RoCE (Pre-tax)
9.7
8.3
6.7
7.3
7.9
Angel RoIC (Pre-tax)
9.7
7.3
6.1
6.9
7.4
RoE
14.9
10.6
7.5
3.2
3.7
Turnover ratios (x)
Asset Turnover (Gross Block) (X)
0.2
0.2
0.1
0.1
0.2
Inventory / Sales (days)
1
1
1
1
1
Receivables (days)
41
48
61
55
49
Payables (days)
84
90
109
95
95
Leverage Ratios (x)
D/E ratio (x)
3.9
3.8
4.1
3.8
4.2
Interest Coverage Ratio (x)
1.6
1.2
1.0
0.9
1.0
Note- nmf- Not meaningful
November 16, 2015
14
ITNL | 2QFY2016 Result Update
Research Team Tel: 022 - 39357800
DISCLAIMER
Angel Broking Private Limited (hereinafter referred to as “Angel”) is a registered Member of National Stock Exchange of India Limited,
Bombay Stock Exchange Limited and Metropolitan Stock Exchange of India Limited. It is also registered as a Depository Participant with
CDSL and Portfolio Manager with SEBI. It also has registration with AMFI as a Mutual Fund Distributor. Angel Broking Private Limited is
a registered entity with SEBI for Research Analyst in terms of SEBI (Research Analyst) Regulations, 2014 vide registration number
INH000000164. Angel or its associates has not been debarred/ suspended by SEBI or any other regulatory authority for accessing
/dealing in securities Market. Angel or its associates including its relatives/analyst do not hold any financial interest/beneficial
ownership of more than 1% in the company covered by Analyst. Angel or its associates/analyst has not received any compensation /
managed or co-managed public offering of securities of the company covered by Analyst during the past twelve months. Angel/analyst
has not served as an officer, director or employee of company covered by Analyst and has not been engaged in market making activity
of the company covered by Analyst.
This document is solely for the personal information of the recipient, and must not be singularly used as the basis of any investment
decision. Nothing in this document should be construed as investment or financial advice. Each recipient of this document should
make such investigations as they deem necessary to arrive at an independent evaluation of an investment in the securities of the
companies referred to in this document (including the merits and risks involved), and should consult their own advisors to determine
the merits and risks of such an investment.
Reports based on technical and derivative analysis center on studying charts of a stock's price movement, outstanding positions and
trading volume, as opposed to focusing on a company's fundamentals and, as such, may not match with a report on a company's
fundamentals.
The information in this document has been printed on the basis of publicly available information, internal data and other reliable
sources believed to be true, but we do not represent that it is accurate or complete and it should not be relied on as such, as this
document is for general guidance only. Angel Broking Pvt. Limited or any of its affiliates/ group companies shall not be in any way
responsible for any loss or damage that may arise to any person from any inadvertent error in the information contained in this report.
Angel Broking Pvt. Limited has not independently verified all the information contained within this document. Accordingly, we cannot
testify, nor make any representation or warranty, express or implied, to the accuracy, contents or data contained within this document.
While Angel Broking Pvt. Limited endeavors to update on a reasonable basis the information discussed in this material, there may be
regulatory, compliance, or other reasons that prevent us from doing so.
This document is being supplied to you solely for your information, and its contents, information or data may not be reproduced,
redistributed or passed on, directly or indirectly.
Neither Angel Broking Pvt. Limited, nor its directors, employees or affiliates shall be liable for any loss or damage that may arise from
or in connection with the use of this information.
Note: Please refer to the important ‘Stock Holding Disclosure' report on the Angel website (Research Section). Also, please refer to the
latest update on respective stocks for the disclosure status in respect of those stocks. Angel Broking Pvt. Limited and its affiliates may
have investment positions in the stocks recommended in this report.
Disclosure of Interest Statement
ITNL
1. Analyst ownership of the stock
No
2. Angel and its Group companies ownership of the stock
No
3. Angel and its Group companies' Directors ownership of the stock
No
4. Broking relationship with company covered
No
Note: We have not considered any Exposure below ` 1 lakh for Angel, its Group companies and Directors
Ratings (Based on expected returns
Buy (> 15%)
Accumulate (5% to 15%)
Neutral (-5 to 5%)
over 12 months investment period):
Reduce (-5% to -15%)
Sell (< -15)
November 16, 2015
15