IPO Note | Financial Services
Oct 7, 2017
Indian Energy Exchange
SUBSCRIBESUBSCRIBE
Powering up for the future of electricity trading
Issue Open: Oct 9, 2017
Issue Close: Oct 11, 2017
Indian Energy Exchange (IEX) is the dominant exchange in India for trading
electricity in the country. It has a market share of over ~98% of the volumes in the
power exchange industry.
Issue Details
Low market penetration allows for significant growth potential: As on FY17,
Face Value: `10
3.6% of electricity generation in India was traded on power exchanges. This is
Present Eq. Paid up Capital: `3.03cr
much lower than global power exchanges, which typically have 30-70% of
traded volumes. This leaves the power market lots of room to grow.
O ffer for Sale: **0.60cr Shares
Migration of electricity markets to exchanges: Electricity on IEX trades at a
lower price than the bilateral price (`2.5 per kWh on IEX Vs `3.5 per kWh
Fresh issue:
-
bilateral price in FY17). The price difference has ranged between `0.8 to `1.4
per kWh over the past four years. The consistently lower pricing that IEX offers
Post Eq. Paid up Capital: `3.03cr
results in power procurement cost optimization for distribution companies and
Issue size (amount): *`998cr -**1000
large consumers.
cr
Capacity addition in Renewable Energy Sources (RES): Under the Central
Electricity Authority’s (CEA) 13th plan, 100 gW of capacity addition is to take
Price Band: `1645-1650
place in the Renewable Energy segment. This would bring the total of solar
Lot Size: 9 shares and in multiple
and wind energy capacity installed to 100 and 60 gW respectively. Due to
thereafter
seasonality and variability in the generation of solar and wind energy, these
Post-issue implied mkt. cap: *`4984cr
new power generators would depend on the power exchanges to provide
**`5000cr
access to short-term electricity markets.
Enforcement of Renewable Purchase Obligation (RPO) to provide boost to
Promoters holding Pre-Issue: -
trading in REC segment: the central government has targeted 17% share of
Promoters holding Post-Issue: -
renewable power by 2019. However, many states are still laggards in regards
to their RPO targets. In order to address this deficit, trading of Renewable
*Calculated on lower price band
Energy Certificates (REC) is likely to see increased participation.
** Calculated on upper price band
High Dividend Payout: The company has a policy to payout more than 50%
of net profits as dividend. Due to strong cash generation, the company is
Book Building
likely to maintain the dividend payout similar to the payout (80%) in FY17.
QIBs
50% of issu
Outlook & Valuation: IEX is likely to continue its current growth trajectory as
the short-term electricity market would continue its migration away from other
Non-Institutional
15% of issu
platforms and to the exchanges. The company is also likely to sustain its
Retail
35% of issu
position as the dominant market player. The company is also likely to benefit
from long-term industry trends as the Indian power market moves towards
global standards. The company has an ROE of 30.8% Vs 7.4% for Multi-
Post Issue Shareholding Patte
commodity Exchange (MCX), based on FY18 annualized earnings. At the
upper end of the price band, the pre issue P/E multiples works out be 40.9x
Promoters
0%
of FY2018 annualized EPS or IEX,Vs 51.5x of FY2018 annualized EPS for
Others
100%
MCX. We recommend ‘SUBSCRIBE’ on the issue for a mid-to-long term
period.
Key Financial
Y/E March (` cr)
FY2014
FY2015
FY2016
FY2017
Net Sales
153
145
175
204
% chg
26%
-5%
21%
17%
Net Profit
92
90
100
114
% chg
9.9
-2.1
11.5
13.2
EBITDA (%)
74.8%
71.9%
71.5%
70.3%
Noel Vaz
EPS (Rs)
30.3
29.7
33.1
37.5
P/E (x)
54
56
50
44
+022 39357600, Extn: 6847
P/BV (x)
20
21
18
18
RoE (%)
53
55
54
63
RoCE (%)
44
42
45
51
EV/EBITDA
41
44
37
31
PlSource: RHP, Angel Research; Note: Valuation ratios based on pre-issue outstanding sharesrt
and at upper end of the price band
1
Indian Energy Exchange | IPO Note
Company background
Indian Energy Exchange (IEX) is the largest power trading exchange in India. For
the past five years, it has more than 90% market share of the exchange-traded
volumes of electricity in India. The balance of the exchange-traded volumes are
transacted on the Power Exchange India Ltd (PXIL), which is its main competitor.
The company has 4 products that it offers: Day Ahead Market (DAM), Term Ahead
Market (TAM), Renewable Energy Certificate (REC). The company also soon began
trading in Energy Savings Certificates (ESCerts) from
26 Sept.
2017. The
company’s primary revenue is from earning transaction charges of `20 per mWh
on the traded volume on the exchange. The company also earns a good amount
of interest on interest free deposits collected from exchange members.
IEX primary focus is on the short-term electricity market. At present, the short-term
electricity market is 10.3% of the total traded volumes of the electricity market. Of
the short-term market, 34.5% is traded on power exchanges. The short-term
trading market consists of Inter-state trading Licenses, Power exchanges, Deviation
Settlement Mechanism (DSM), and Direct Bilateral. Market share of volumes traded
on exchanges has gone from 10.9% in FY10 to 34.5% in FY17 (in the short-term
electricity market).
Exhibit 1: Business Volumes by product category for IEX
FY 13
FY 14
FY 15
FY 16
FY 17
DAM (in kWh)
22,346
28,923
28,124
33,956
39,783
TAM (in kWh)
481
345
222
330
744
REC (in mln units)
1.99
1.32
1.55
3.14
4.62
Source: Company, Angel Research, RHP
The company is a professionally managed entity with no promoter group or
subsidiaries. In August 2016, the company received three ISO Certifications - ISO
9001:2008 for quality management, ISO 27001:2013 for information security
management and ISO 14001:2004 for environment management. The Council of
Power utilities recognized IEX as the ‘Leader in Power Market Development’ in
2015 and was awarded the ‘Exchange of the Year’ Award by Power Business View
in 2014.
As of August 31, 2017, the company had over 5,900 participants registered on
their exchange of which over
3,200 participants were active. Over
4,300
registered participants were eligible to trade electricity contracts and over 4,000
registered participants were eligible to trade RECs. The trading participants
registered to trade electricity contracts are located across 29 states and 5 union
territories, and include 50 distribution companies, over 400 electricity generators
and over 3,900 open access consumers. The activities of the company are subject
to regulation from Central Regulatory Electricity Commission (CERC).
Oct 7, 2017
2
Indian Energy Exchange | IPO Note
Exhibit 2: Market share of IEX in exchange traded electricity
FY 13
FY 14
FY 15
FY 16
FY 17
IEX
95.0%
91.5%
92.1%
93.7%
94.8%
PXIL
5.0%
8.5%
7.9%
6.3%
5.2%
Source: Company, Angel Research, RHP
Issue Details
This IPO is an OFS and with no issue of fresh shares. The issue constitutes of an
OFS worth `1000cr. The OFS would offer exit to the institutional investors in IEX.
The two largest sellers are Multiples Private Equity and Tata Power. Multiples
Private Equity and Tata Power currently hold 13.3% and 4.34% of the pre-Offer
Equity Share capital of the company respectively.
Exhibit 3: Pre and Post-IPO shareholding pattern
No of shares (Pre-issue)
% No of shares (Post-issue)
%
Promoter
-
-
-
-
Public
3,03,28,624 100%
3,03,28,624
100%
3,03,28,624 100%
3,03,28,624
100%
Source: RHP, Angel Research
Objects of the offer
To get the benefits of listing the equity shares on the stock exchange
To carry out sale of upto 6,065,009 Equity Shares of existing shareholders
Key Management Personnel
Dinesh K. Mehrotra is the Chairman of the company. He has worked for LIC for
over 35 years and last held the position of Chairman of the company. He also
holds directorships across multiple boards such as Tata Steel and UTI Asset
Management. He has been with the company for over two years.
Satyanarayan Goel is the Managing Director and CEO of the company. He has
over 38 years of experience working in the power sector. He was previously the
Director of Marketing and Operations at PTC and was associated with NTPC for
over 29 years. He is responsible for the company’s overall business operations.
Rohit Bajaj is the Vice President, Business Development. He has over 23 years of
experience in the energy domain. He was previously the Head of Business at NETS
Ltd.
Oct 7, 2017
3
Indian Energy Exchange | IPO Note
Investment Rationale
Low market penetration allows for significant growth potential
As on FY17, only 3.6% of power generated in India was traded on exchanges.
This is much lower than global power markets, where exchange volumes
account for 30-70% of the volume of power generated. As Indian energy
markets develop and mature, the participation on electricity exchanges is
going to converge with global level.
Exhibit 4: Market share of Power exchanges by country
Nordic
India
France
Belgium UK
Germany Austria
countries
3%
23%
29%
53%
53%
53%
91%
Source: Company, Angel Research, RHP
Migration of short-term energy market towards exchanges
IEX is the leading power exchange and a leader in volumes in the short-term
power market. It has a dominant market share in the DAM, TAM and REC segment
of the market. The company has steadily gained market share against other
participants in the short-term market. IEX has gained market share due to its
superior execution, cost optimization and transparent price discovery.
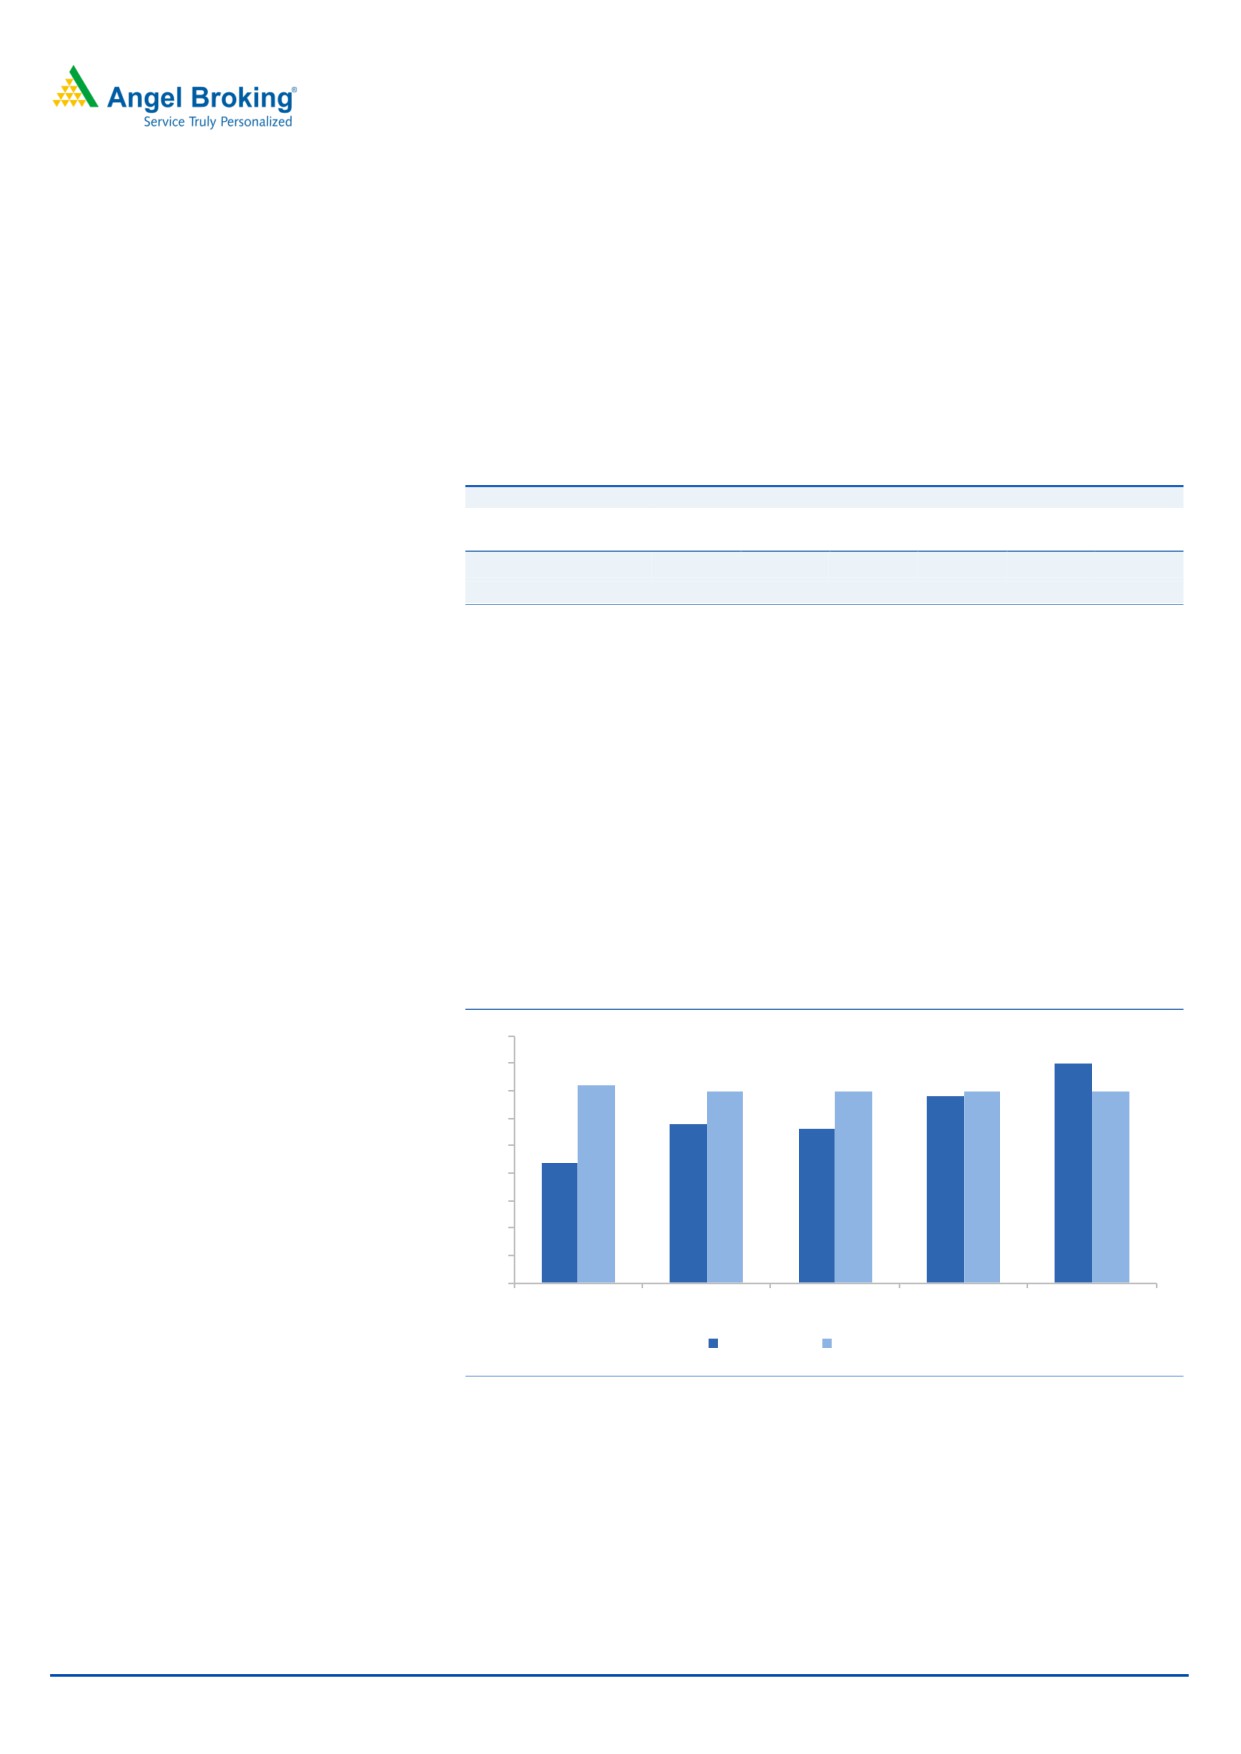
Exhibit 5: IEX volumes Vs Trader volumes in DAM & TAM segment
45
40
40
36
35
35
34
35
35
35
29
28
30
25
22
20
15
10
5
0
FY 13
FY 14
FY 15
FY 16
FY 17
IEX Volume
Trader Volume
Source: Company, Angel Research, RHP
Oct 7, 2017
4
Indian Energy Exchange | IPO Note
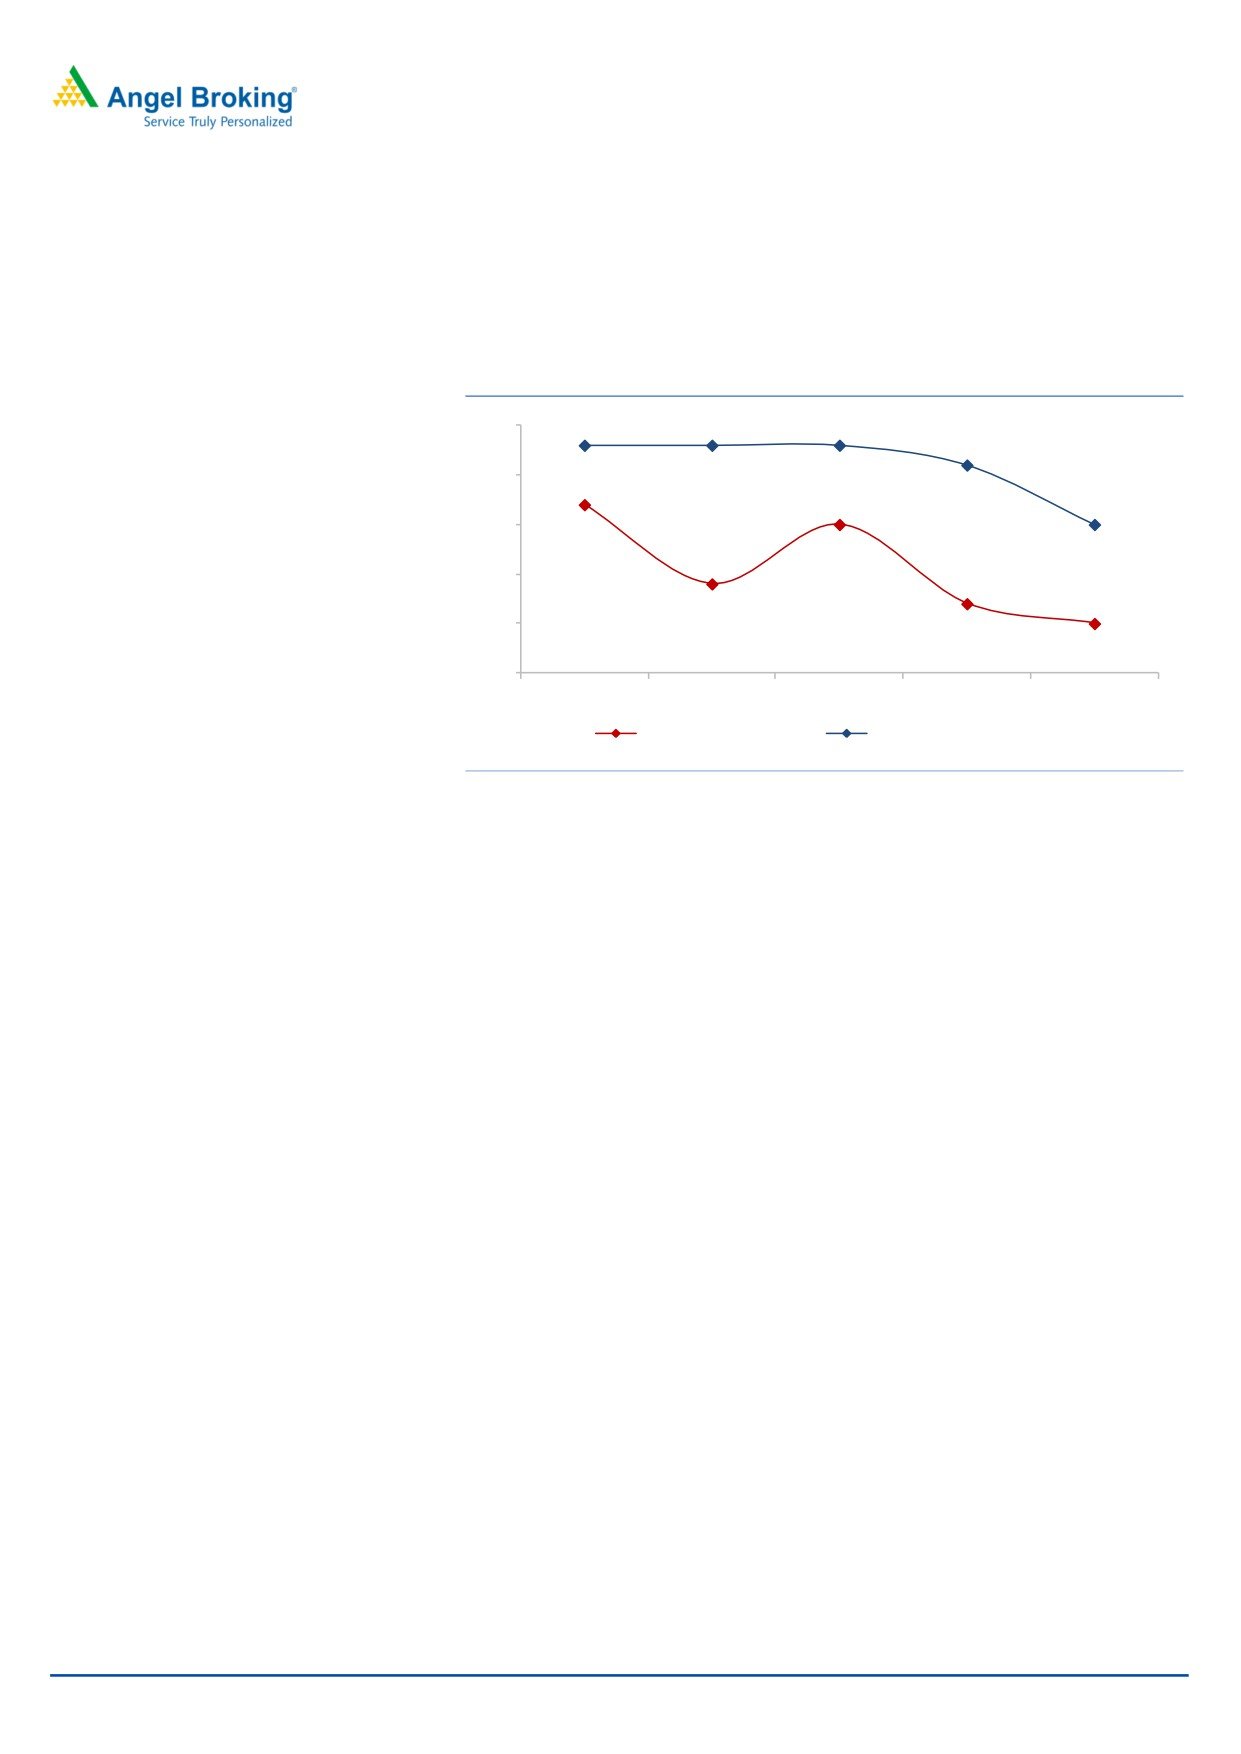
This superior price discovery has resulted in IEX prices being consistently lower than
dealer prices. This trend is likely to remain as markets get deeper with better
participation and improved transmission infrastructure.
Exhibit 6: Avg. prices discovered on IEX Vs dealer market
4.5
4.3
4.3
4.3
4.1
4
3.7
3.5
3.5
3.5
2.9
3
2.7
2.5
2.5
2
FY 13
FY 14
FY 15
FY 16
FY 17
IEX Price (in Rs. kWh)
Bilateral Price (in Rs. kWh)
Source: Company, Angel Research,RHP
Capacity addition in Renewable Energy Sources
By 2022, the capacity of the renewable energy segment is expected to reach
170gW from a present capacity of 58.3gW. Of this capacity, 100 gW is solar
energy while 60 gW is wind energy. Wind and solar energy generators are highly
dependent on local conditions such as the weather (in case of both) and time of
day (in case of solar).
Due to these reasons, it is likely that power generators from this segment would
rely on the short-term power market.
Enforcement of Renewable Purchase Obligation
The central government has attempted to encourage the use of renewable energy.
The government aims to encourage this by using Renewable Purchase Obligations.
Renewable Purchase Obligations
(“RPOs”), put simply, is the minimum
percentages of total power that electricity distribution companies and other
obligated entities like captive and open access consumers need to purchase from
renewable energy sources.
The ministry of power has set an ambitious RPO target of 17.0% by 2019. Of this,
6.75% should come from solar and the balance from non-solar renewable sources
such as wind, biomass etc.
However, the State Regulatory Commissions are free to set year-wise RPO targets
in their respective states as well as targets for solar and non-solar sources
separately. However, few states have been able to meet their RPO targets.
Oct 7, 2017
5
Indian Energy Exchange | IPO Note
Historically, distribution licensees have not been interested in purchasing electricity
generated from renewable energy sources, due to power generation costs as well
as a lack of local availability. Renewable energy certificates (“RECs”) were
introduced to address this mismatch so that states can meet their renewable
purchase obligations, by purchasing REC of producers from other states.
As the power ministry has still reiterated its initial target, states will now have to
increase their participation. Thus, it is likely that the participation is likely to
increase in the REC market.
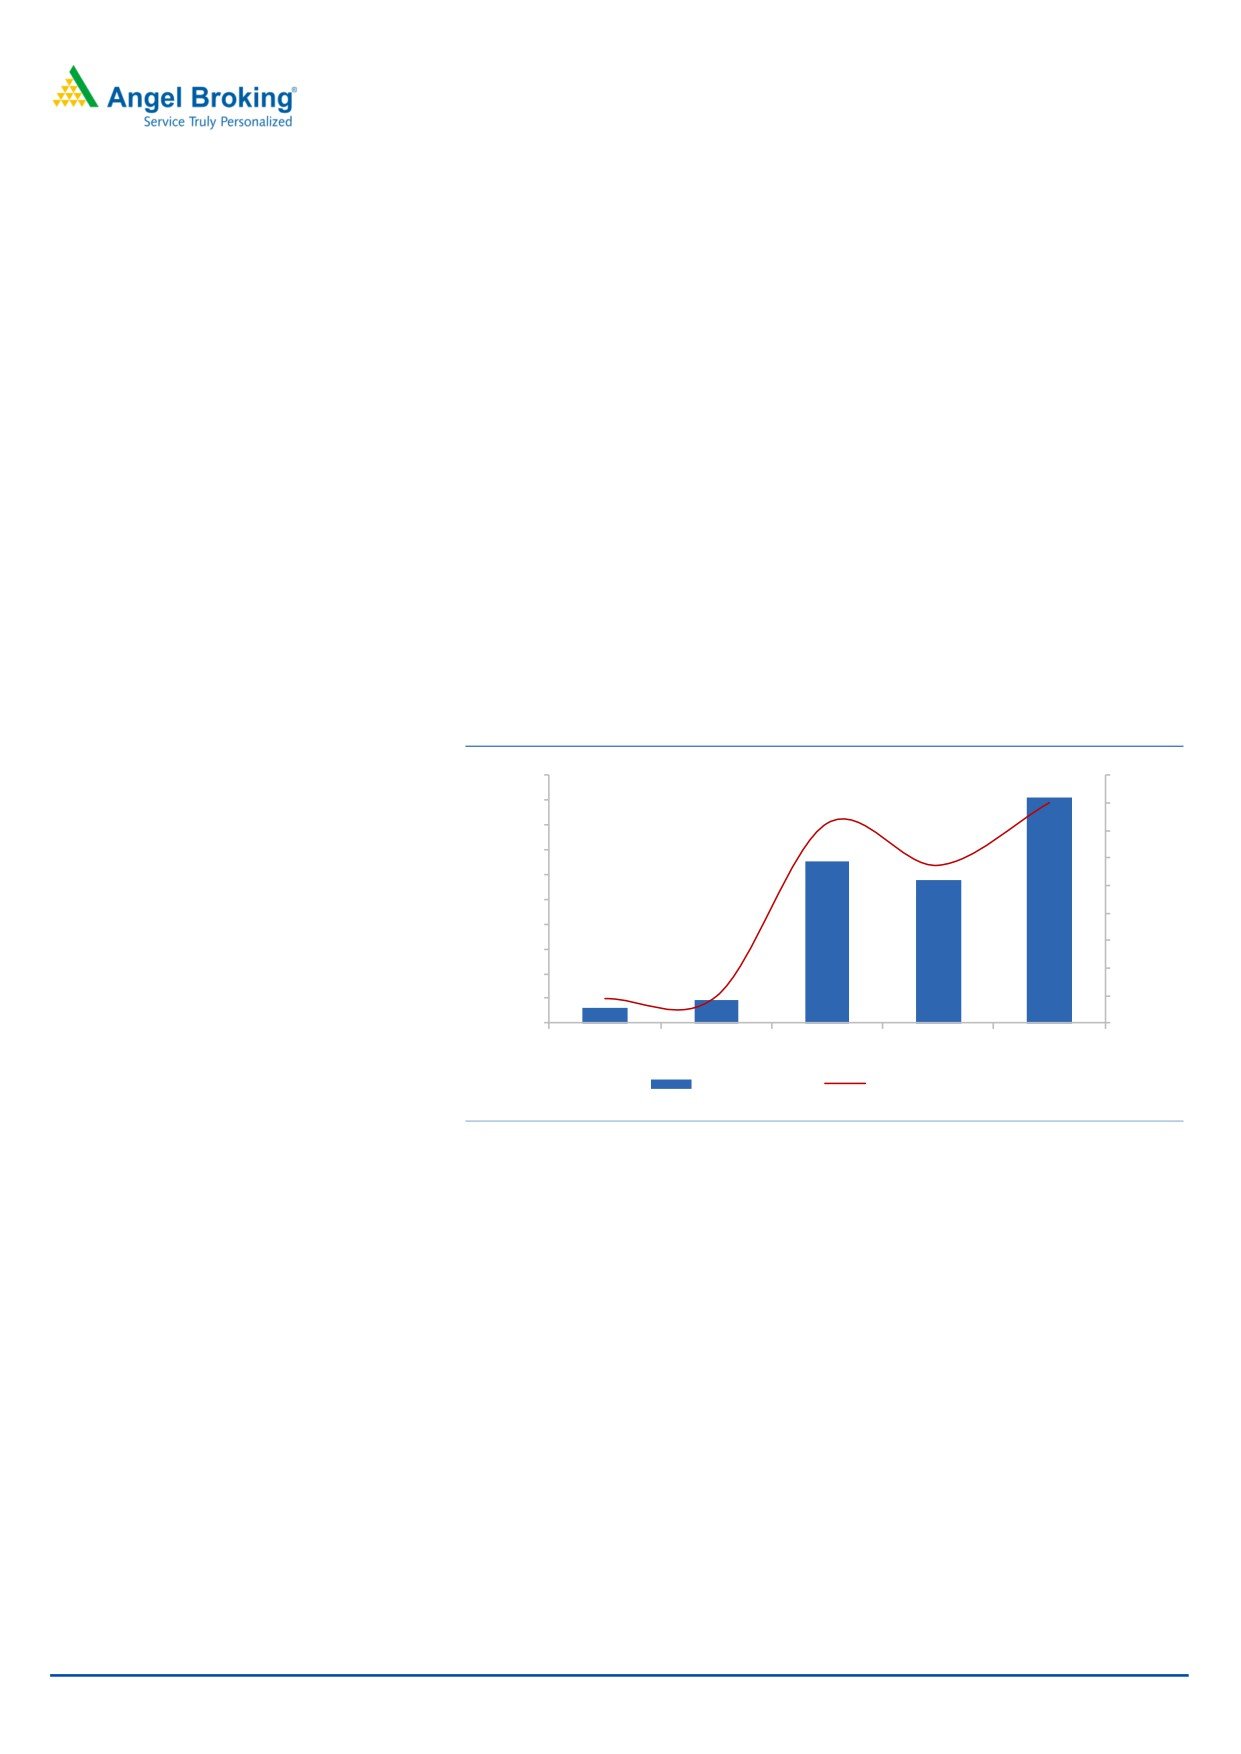
High Dividend Payout: Since FY15, the company has maintained a dividend
payout of over 50%. The company has stated that it will follow a policy to keep its
dividend payout at 50% of net profits. Given the extremely low levels of capital
required to run the business, it is quite likely that the company would keep
dividend payout as per its historical levels.
Exhibit 7: High Dividend Payout
100.0
90.0%
80.1%
90.0
80.0%
72.7%
80.0
70.0%
57.4%
70.0
60.0%
60.0
50.0%
50.0
40.0%
40.0
30.0%
30.0
9.1%
20.0%
20.0
9.9%
10.0
10.0%
-
0.0%
FY 13
FY 14
FY 15
FY 16
FY 17
Div. per share
Dividend Payout %
Source: Company, Angel Research
Oct 7, 2017
6
Indian Energy Exchange | IPO Note
Outlook & Valuation
IEX is likely to continue its current growth trajectory as the short-term electricity
market would continue its migration away from other platforms and to the
exchanges. The company is also likely to sustain its position as the dominant
market player. The company is also likely to benefit from long-term industry
trends as the Indian power market moves towards global standards. The
company has an ROE of 30.8% Vs 7.4% for Multi-commodity Exchange (MCX),
based on FY18 annualized earnings. At the upper end of the price band, the
pre issue P/E multiples works out be 40.9x of FY2018 annualized EPS or IEX,Vs
51.5x of FY2018 annualized EPS for MCX. We recommend ‘SUBSCRIBE’ on
the issue for a mid-to-long term period.
Key risks
Regulatory control on pricing
At present, the company is charging a transaction charge of `20 per mWh of
electricity traded on its platform. The power industry regulator CERC sets this
pricing and hence the company’s revenue is vulnerable to any regulation that
stipulates a reduction in the transaction charges.
Competition from other exchanges
IEX faces competition from two other platforms - PXIL and the DEEP portal (created
by the Power ministry). At present, these exchanges do not pose a significant
threat to IEX. However, this industry is still in the early phases of its development
and the situation remains quite dynamic. This is a possible outcome as platforms
like DEEP have the support of the central government. Also, there are no
regulatory barriers that prevent other competitors from entering the industry.
Oct 7, 2017
7
Indian Energy Exchange | IPO Note
Exhibit 8: Consolidated Income Statement
Y/E March (` cr)
FY14
FY15
FY16
FY17
Total operating income
153
145
175
204
% chg
25.9
(5.1)
20.9
16.5
Total Expenditure
38
41
50
61
Personnel
8
12
14
16
Others Expenses
30
29
36
45
EBITDA
114
104
125
143
% chg
8.0
(8.8)
20.3
14.5
(% of Net Sales)
74.8
71.9
71.5
70.3
Depreciation& Amortisation
3
3
3
3
EBIT
111
101
122
140
% chg
11.5
(9.3)
20.4
14.8
(% of Net Sales)
73.1
69.9
69.6
68.6
Interest & other Charges
0
0
0
0
Other Income
21
32
25
34
(% of Sales)
16.1
23.8
17.1
19.3
Share in profit of Associates
-
-
-
-
Recurring PBT
133
133
147
173
% chg
20.6
(0.3)
10.7
18.1
Tax
40.9
42.5
46.3
59.6
PAT (reported)
92
90
100
114
% chg
9.9
(2.1)
11.5
13.2
(% of Net Sales)
60.3
62.2
57.3
55.7
Basic & Fully Diluted EPS (Rs)
30.3
29.7
33.1
37.5
% chg
38.7
(2.1)
5.3
13.2
Oct 7, 2017
8
Indian Energy Exchange | IPO Note
Exhibit 9: Consolidated Balance Sheet
Y/E March (` cr)
FY14
FY15
FY16
FY17
SOURCES OF FUNDS
Equity Share Capital
30
30
30
30
Reserves& Surplus
223
210
241
245
Shareholders Funds
253
240
271
275
Minority Interest
-
-
-
-
Total Loans
3
-
-
-
Other Liab & Prov
2
1
0
-
Total Liabilities
369
406
424
552
APPLICATION OF FUNDS
Net Block
10
14
11
9
Capital Work-in-Progress
-
-
-
0
Investments
65
44
39
39
Current Assets
294
348
373
502
Inventories
-
-
-
-
Sundry Debtors
0
0
1
0
Cash
289
338
363
498
Loans & Advances
2
2
2
2
Other Assets
2
8
7
3
Current liabilities
111
165
153
277
Net Current Assets
182
183
220
225
Other Non Current Asset
-
-
0
2
Total Assets
369
406
424
552
Oct 7, 2017
9
Indian Energy Exchange | IPO Note
Exhibit 10: Consolidated Cash Flow Statement
Y/E March (`cr)
FY14
FY15
FY16
FY17
Profit before tax
133
133
147
173
Depreciation
3
3
3
3
Change in Working Capital
4
30
9
123
Interest / Dividend (Net)
(18)
(17)
(25)
(10)
Direct taxes paid
(42)
(42)
(46)
(61)
Others
(3)
(15)
(0)
(22)
Cash Flow from Operations
76
92
89
206
(Inc.)/ Dec. in Fixed Assets
(1)
(7)
(2)
(1)
(Inc.)/ Dec. in Investments
(89)
30
(21)
(19)
Cash Flow from Investing
(90)
24
(23)
(21)
Issue of Equity
0
0
0
0
Inc./(Dec.) in loans
3
(3)
0
0
Others
(11)
(103)
(70)
(110)
Cash Flow from Financing
(8)
(106)
(70)
(110)
Inc./(Dec.) in Cash
(22)
9
(4)
76
Opening Cash balances
22
0
10
6
Closing Cash balances
0
10
6
82
Exhibit 11: Key Ratios
Y/E March
FY14
FY15
FY16
FY17
Valuation Ratio (x)
P/E (on FDEPS)
54.4
55.5
49.8
44.0
P/CEPS
52.8
53.8
48.2
42.7
P/BV
19.8
20.8
18.5
18.2
Dividend yield (%)
0.2
1.3
1.2
1.8
EV/Sales
30.5
31.9
26.3
21.9
EV/EBITDA
40.7
44.4
36.7
31.1
EV / Total Assets
12.6
11.4
10.9
8.1
Per Share Data (Rs)
EPS (Basic)
30.3
29.7
33.1
37.5
EPS (fully diluted)
27.6
27.0
31.5
35.7
Cash EPS
31.2
30.7
34.2
38.6
DPS
3.0
21.6
19.0
30.0
Book Value
83.5
79.2
89.4
90.8
Returns (%)
ROCE
43.6
42.2
44.9
50.8
ROE
52.5
55.2
54.1
63.0
Turnover ratios (x)
Asset Turnover (Gross Block)
8.9
6.3
7.3
8.3
Receivables (days)
1
1
2
0
Payables (days)
69
87
123
308
Returns (%)
(68)
(86)
(121)
(307)
Oct 7, 2017
10
Indian Energy Exchange | IPO Note
Research Team Tel: 022 - 39357800
DISCLAIMER
Angel Broking Private Limited (hereinafter referred to as “Angel”) is a registered Member of National Stock Exchange of India Limited,
Bombay Stock Exchange Limited and Metropolitan Stock Exchange Limited. It is also registered as a Depository Participant with CDSL
and Portfolio Manager with SEBI. It also has registration with AMFI as a Mutual Fund Distributor. Angel Broking Private Limited is a
registered entity with SEBI for Research Analyst in terms of SEBI (Research Analyst) Regulations, 2014 vide registration number
INH000000164. Angel or its associates has not been debarred/ suspended by SEBI or any other regulatory authority for accessing
/dealing in securities Market. Angel or its associates/analyst has not received any compensation / managed or co-managed public
offering of securities of the company covered by Analyst during the past twelve months.
This document is solely for the personal information of the recipient, and must not be singularly used as the basis of any investment
decision. Nothing in this document should be construed as investment or financial advice. Each recipient of this document should
make such investigations as they deem necessary to arrive at an independent evaluation of an investment in the securities of the
companies referred to in this document (including the merits and risks involved), and should consult their own advisors to determine
the merits and risks of such an investment.
Reports based on technical and derivative analysis center on studying charts of a stock's price movement, outstanding positions and
trading volume, as opposed to focusing on a company's fundamentals and, as such, may not match with a report on a company's
fundamentals. Investors are advised to refer the Fundamental and Technical Research Reports available on our website to evaluate the
contrary view, if any.
The information in this document has been printed on the basis of publicly available information, internal data and other reliable
sources believed to be true, but we do not represent that it is accurate or complete and it should not be relied on as such, as this
document is for general guidance only. Angel Broking Pvt. Limited or any of its affiliates/ group companies shall not be in any way
responsible for any loss or damage that may arise to any person from any inadvertent error in the information contained in this report.
Angel Broking Pvt. Limited has not independently verified all the information contained within this document. Accordingly, we cannot
testify, nor make any representation or warranty, express or implied, to the accuracy, contents or data contained within this document.
While Angel Broking Pvt. Limited endeavors to update on a reasonable basis the information discussed in this material, there may be
regulatory, compliance, or other reasons that prevent us from doing so.
This document is being supplied to you solely for your information, and its contents, information or data may not be reproduced,
redistributed or passed on, directly or indirectly.
Neither Angel Broking Pvt. Limited, nor its directors, employees or affiliates shall be liable for any loss or damage that may arise from
or in connection with the use of this information.
Oct 7, 2017
11