4QFY2016 Result Update | Banking
May 11, 2015
ICICI Bank
ACCUMULATE
CMP
`225
Performance Highlights
Target Price
`254
Particulars (` cr)
4QFY16 3QFY16
% chg (qoq) 4QFY15
% chg (yoy)
Investment Period
12 Months
NII
5,405
5,453
(0.9)
5,079
6.4
Pre-prov. profit
7,108
6,560
8.3
5,468
30.0
Stock Info
PAT
702
3,018
(76.7)
2,922
(76.0)
Source: Company, Angel Research
Sector
Banking
For 4QFY2016, ICICI Bank’s reported PAT came in sharply lower at `702cr.
Market Cap (` cr)
131,024
However, on adjusting for the exceptional contingency provision of `3,600cr that
Beta
1.5
the bank made during the quarter, the PAT is in-line with our estimate.
52 Week High / Low
325/180
Domestic advances grew strong, backed by retail loans: During the quarter, the
Avg. Daily Volume
24,668,900
bank’s advances grew by 12.3% yoy (flat qoq). The sluggish growth was due to a
Face Value (`)
2
6% decline in its overseas loan book. Overall, the domestic loan book grew 16.6%
BSE Sensex
25,689
yoy, aided by healthy retail loan book growth of 23.3% yoy. Mortgages and auto
Nifty
7,866
loans continued to drive growth, which were up 24% and 17% yoy respectively.
Reuters Code
ICBK.NS
Retail contribution to total loans increased to 46.6% vs 43.8% in the sequential
Bloomberg Code
ICICIBC@IN
previous quarter. The corporate book grew 7.2% yoy. The NII grew by 6.6% yoy, ie
at a rate lower than loan growth, due to interest reversals. Due to high slippages,
the bank took provisions of `3,326cr compared to `2,844cr in 3QFY2016, up by
17% qoq. Taking asset quality concerns into consideration, the bank took a
Shareholding Pattern (%)
contingency provision of `3,600cr (it utilised the one-time gain from stake sale in
Promoters
NA
its insurance arm) and hence the reported PAT came in lower at `702cr.
MF / Banks / Indian Fls
26.5
Asset quality deteriorates and could remain under pressure: The bank completed
FII / NRIs / OCBs
64.7
the AQR process during the quarter and hence slippages stood at `7,003cr. It also
Indian Public / Others
8.8
implemented SDR worth `1,200cr and sees another `500cr in the pipeline.
Further, 5:25 done during the quarter stood at `680cr and pipeline for the same
stands at `750cr. GNPAs went up to 5.82% vs 4.72% in the sequential previous
quarter. The bank has said ~`44,000cr worth of loans, primarily from the iron &
Abs. (%)
3m
1yr
3yr
steel, mining, power, and cement & rigs sectors are under stress and a large part
Sensex
6.9
(5.2)
28.8
of the incremental slippages are likely to come up from the aforementioned
ICICI Bank
7.6
(28.9)
(2.3)
sectors. We expect slippages to remain high in FY2017, with a large part coming
in 1HFY2017 itself and some spill over could be seen in FY2018 as well.
3-year price chart
Outlook and valuation: The outlook for ICICI Bank’s earnings remains challenging
500
over the next two years. However, at the current levels we believe the downside
remains limited. At the current market price, the bank’s core banking business
400
(after adjusting `67/share towards the value of subsidiaries) is trading at 1.0x
300
FY2018E ABV. The stock has corrected in the last one quarter due to concerns over
200
deteriorating asset quality. Though pain in asset quality is likely to persist in the
100
quarters to come, we believe the current valuations adequately factor in the
0
relatively higher stressed assets in the bank’s books. We recommend an
Accumulate rating on the stock, with a target price of `254.
Key financials (Standalone)
Source: Company, Angel Research
Y/E March (` cr)
FY2015
FY2016
FY2017E
FY2018E
NII
19,040
21,224
23,100
29,474
% chg
15.6
11.5
8.8
27.6
Net profit
11,176
9,726
9,859
12,348
Siddharth Purohit
% chg
13.9
(13.0)
1.4
25.2
022 - 3935 7800 Ext: 6872
NIM (%)
3.2
3.3
3.1
3.3
EPS (`)
19.3
16.7
16.9
21.2
P/E (x)
11.7
13.5
13.3
10.6
P/ABV (x)
1.1
1.1
1.1
1.0
Chintan Shah
RoA (%)
1.9
1.5
1.3
1.4
022 - 4000 3600 Ext: 6828
RoE (%)
13.9
10.8
10.2
11.7
Source: Company, Angel Research; Note: CMP as of May 10, 2015
Please refer to important disclosures at the end of this report
1
ICICI Bank | 4QFY2016 Result Update
Exhibit 1: 4QFY2016 performance (Standalone)
Particulars (` cr)
4QFY16
3QFY16
% chg (qoq)
4QFY15
% chg (yoy)
FY2016
FY2015
% chg
Interest earned
13,482
13,346
1.0
12,738
5.8
52,739
49,091
7.4
- on Advances / Bills
10,041
9,863
1.8
9,333
7.6
38,943
35,631
9.3
- on investments
2,652
2,652
(0.0)
2,983
(11.1)
10,625
11,945
(11.0)
- on balance with RBI & others
59
36
62.9
39
51.6
158
195
(18.9)
- on others
730
795
(8.1)
383
90.5
3,013
1,320
128.2
Interest Expended
8,077
7,893
2.3
7,659
5.5
31,515
30,052
4.9
Net Interest Income
5,405
5,453
(0.9)
5,079
6.4
21,224
19,040
11.5
Other income
5,109
4,217
21.2
3,496
46.1
15,323
12,176
25.8
Other income excl. treasury
2,919
2,775
5.2
2,770
5.4
11,263
11,788
(4.5)
- Fee income
2,212
2,262
(2.2)
2,137
3.5
9,709
1,936
401.5
- Treasury income
2,190
1,442
51.9
726
201.7
4,060
388
946.4
- Others
707
513
37.8
633
11.7
1,554
526
195.4
Operating income
10,513
9,670
8.7
8,576
22.6
36,547
31,216
17.1
Operating expenses
3,406
3,110
9.5
3,107
9.6
12,684
11,496
10.3
- Employee expenses
1,382
1,140
21.2
1,299
6.4
5,002
4,750
5.3
- Other Opex
2,024
1,970
2.8
1,809
11.9
7,681
6,746
13.9
Pre-provision Profit
7,108
6,560
8.3
5,468
30.0
23,863
19,720
21.0
Provisions & Contingencies
6,926
2,844
143.5
1,345
415.1
11,668
3,900
199.2
PBT
181
3,716
(95.1)
4,124
(95.6)
12,196
15,820
(22.9)
Provision for Tax
(521)
698
(174.6)
1,202
(143.3)
2,469
4,644
(46.8)
PAT
702
3,018
(76.7)
2,922
(76.0)
9,726
11,176
(13.0)
Effective Tax Rate (%)
(287.2)
18.8
(30594)bp
29.1
(31630)bp
52,739
49,091
7.4
Source: Company, Angel Research
May 11, 2016
2
ICICI Bank | 4QFY2016 Result Update
Exhibit 2: 4QFY2016 performance analysis (Standalone)
Particulars
4QFY16 3QFY16
% chg (qoq) 4QFY15
% chg (yoy)
Balance sheet
Advances (` cr)
4,35,264
4,34,800
0.1
3,87,522
12.3
Deposits (` cr)
4,21,426
4,07,314
3.5
3,61,563
16.6
Credit-to-Deposit Ratio (%)
103.3
106.7
(346)bp
107.2
(390)bp
Current deposits (` cr)
58,870
57,181
3.0
49,520
18.9
Saving deposits (` cr)
1,34,230
1,26,918
5.8
1,14,860
16.9
CASA deposits (` cr)
1,93,100
1,84,099
4.9
1,64,380
17.5
CASA ratio (%)
45.8
45.2
62bp
45.5
36bp
CAR (%)
16.6
15.8
87bp
17.0
(38)bp
Tier 1 CAR (%)
13.1
11.8
130bp
12.8
31bp
Profitability Ratios (%)
Reported NIM
3.37
3.53
(16)bp
3.57
(20)bp
Cost-to-income ratio
32.4
32.2
23bp
36.2
(384)bp
Asset quality
Gross NPAs (` cr)
28,356
21,356
32.8
15,095
87.9
Gross NPAs (%)
5.8
4.7
110bp
3.8
204bp
Net NPAs (` cr)
12,936
10,014
29.2
6,256
106.8
Net NPAs (%)
3.0
2.3
70bp
1.6
137bp
Provision Coverage Ratio (%)
50.6
53.2
(260)bp
58.6
(800)bp
Slippage ratio (%)
7.2
6.8
47bp
3.8
338bps
Provision exps. to avg. adv (%)
1.9
1.7
20bp
0.9
102bp
Source: Company, Angel Research
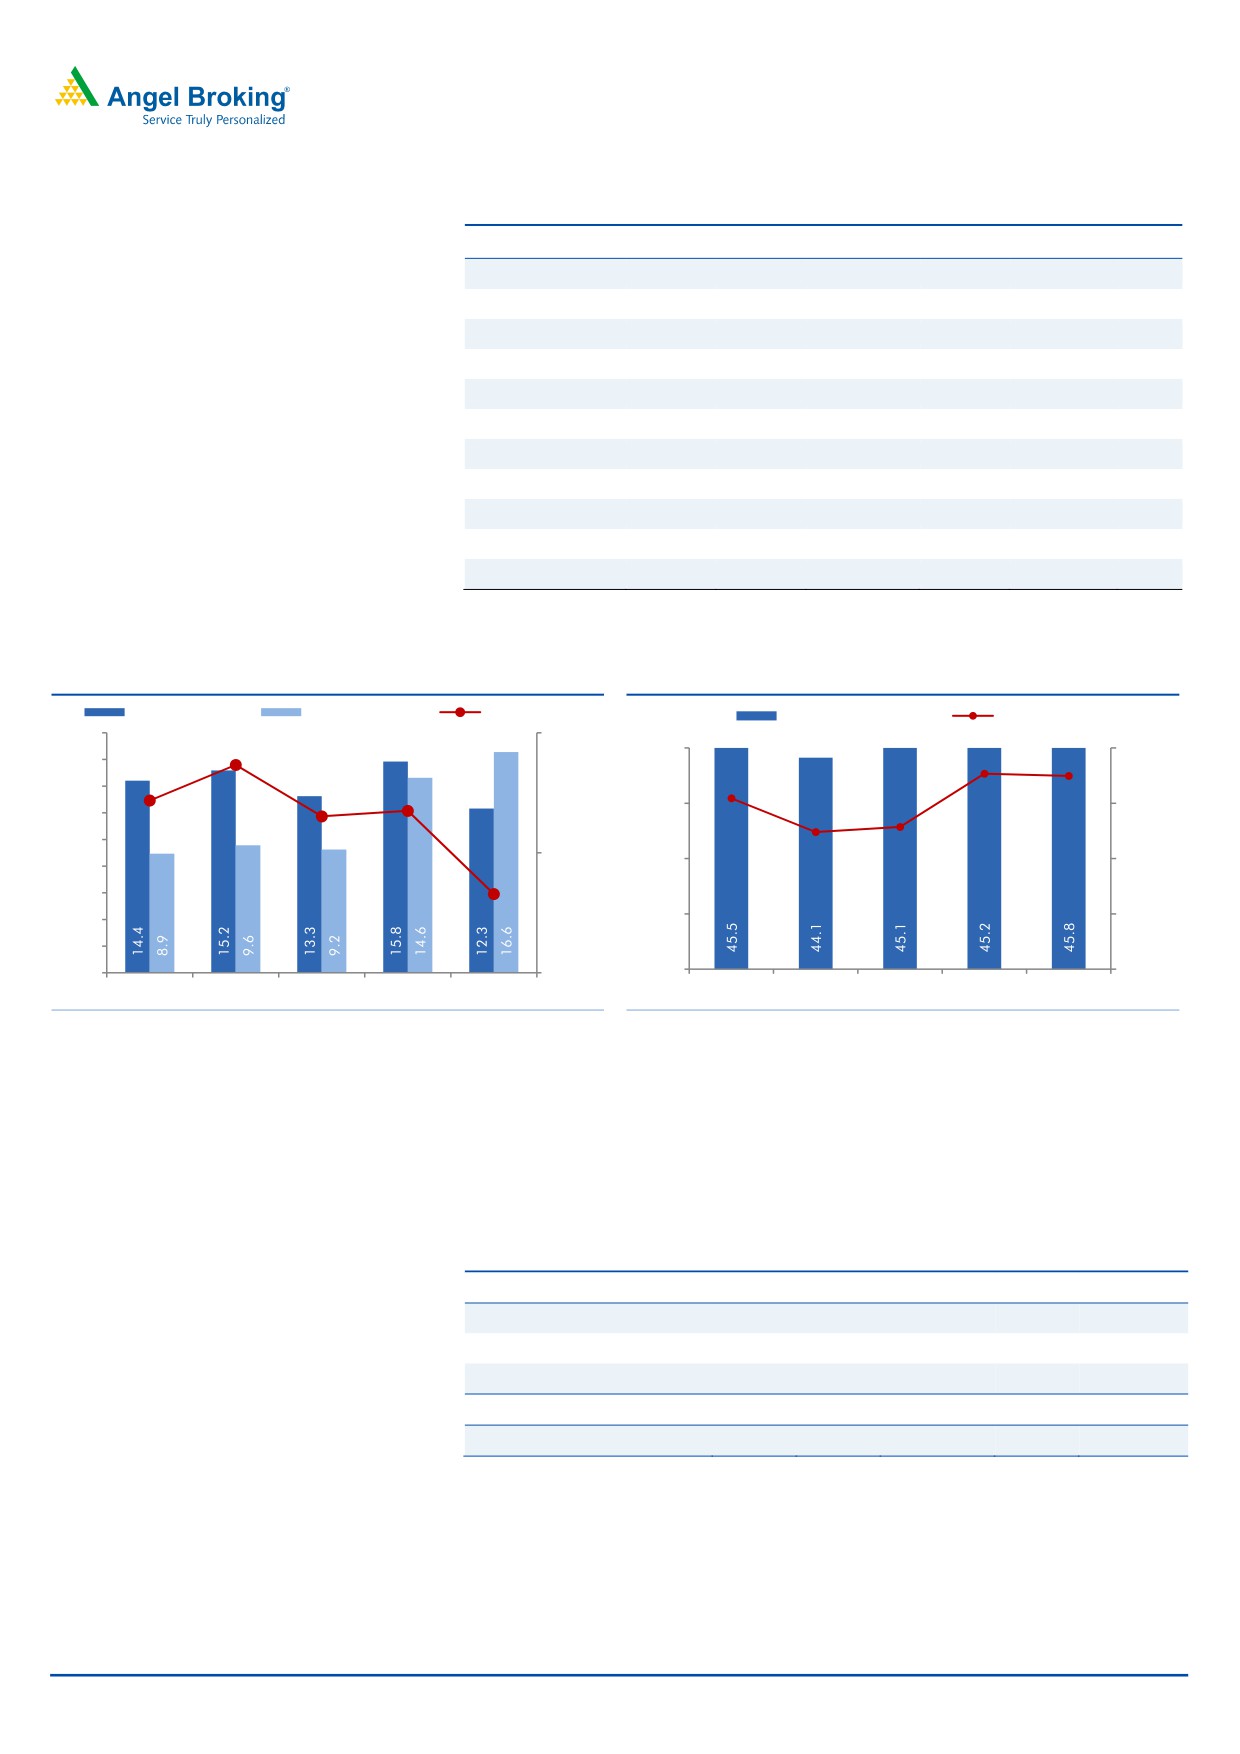
Domestic advances grew strong, backed by retail loans
During the quarter, the bank’s advances grew by 12.3% yoy (flat qoq). The
sluggish growth was due to a 6% decline in its overseas loan book. Overall, the
domestic loan book grew 16.6% yoy, aided by healthy retail loan book growth of
23.3% yoy. Mortgages and auto loans continued to drive growth, which were up
24% and 17% yoy respectively. Retail contribution to total loans increased to 46.6%
vs 43.8% in the sequential previous quarter. The corporate book grew 7.2% yoy.
The NII grew by 6.6% yoy, ie at a rate lower than loan growth, due to interest
reversals. Due to high slippages, the bank took provisions of `3,326cr compared
to `2,844cr in 3QFY2016, up by 17% qoq. Taking asset quality concerns into
consideration, the bank took a contingency provision of `3,600cr (it utilised the
one-time gain from stake sale in its insurance arm) and hence the reported PAT
came in lower at `702cr.
Deposits growth in tandem with loan growth
Deposits growth during the quarter was in tandem with loan growth and picked up
marginally growing by
16.6% yoy compared to
14.6% growth reported in
3QFY2016. CASA deposits grew by 17.5% yoy, and the CASA ratio improved by
62p yoy to 45.8%. The Reported NIM declined by 16bp qoq to 3.37%, with
domestic NIM at 3.73% as compared to 3.86% in 3QFY2016 and overseas NIM
dropping by 32bp qoq to 1.62% from 1.94% in 3QFY2016.
May 11, 2016
3
ICICI Bank | 4QFY2016 Result Update
Exhibit 3: Strong Retail lending supports Loan Growth
Particulars (` cr)
4QFY16
3QFY16
% chg (qoq) 4QFY15
% chg (yoy)
% total
Domestic Corporate
1,19,698
1,25,222
(4.4)
1,11,606
7.2
28.4
Overseas branches
94,017
99,134
(5.2)
94,168
(0.2)
23.3
SME
18,716
20,001
(6.4)
17,051
9.8
4.3
Retail Total
2,02,833
1,90,442
6.5
1,64,697
23.2
44.0
-Home
1,09,530
1,04,553
4.8
89,266
22.7
55.1
-Vehicle loans
35,293
33,708
4.7
29,645
19.1
17.9
-Others
31,845
27,805
14.5
25,528
24.7
14.3
-Banking business
10,750
10,093
6.5
9,388
14.5
5.6
-Credit cards
5,476
5,142
6.5
3,953
38.5
2.5
-Personal loans
10,142
9,141
10.9
6,917
46.6
4.6
Total advances
4,35,264
4,34,800
0.1
3,87,522
12.3
100.0
Source: Company, Angel Research
Exhibit 4: Retail segment supports Advances growth
Exhibit 5: CASA ratio rises qoq as well as yoy
Adv. yoy growth
Dep. yoy growth
CDR (%, RHS)
CASA ratio (%)
yoy Growth
18.0
110.0
108.7
45.0
20.0
16.0
17.7
17.5
107.2
15.5
14.0
106.7
106.5
40.0
12.9
15.0
12.0
12.4
10.0
105.0
35.0
10.0
8.0
103.3
6.0
30.0
5.0
4.0
2.0
-
100.0
25.0
-
4QFY15
1QFY16
2QFY16
3QFY16
4QFY16
4QFY15
1QFY16
2QFY16
3QFY16
4QFY16
Source: Company, Angel Research
Source: Company, Angel Research
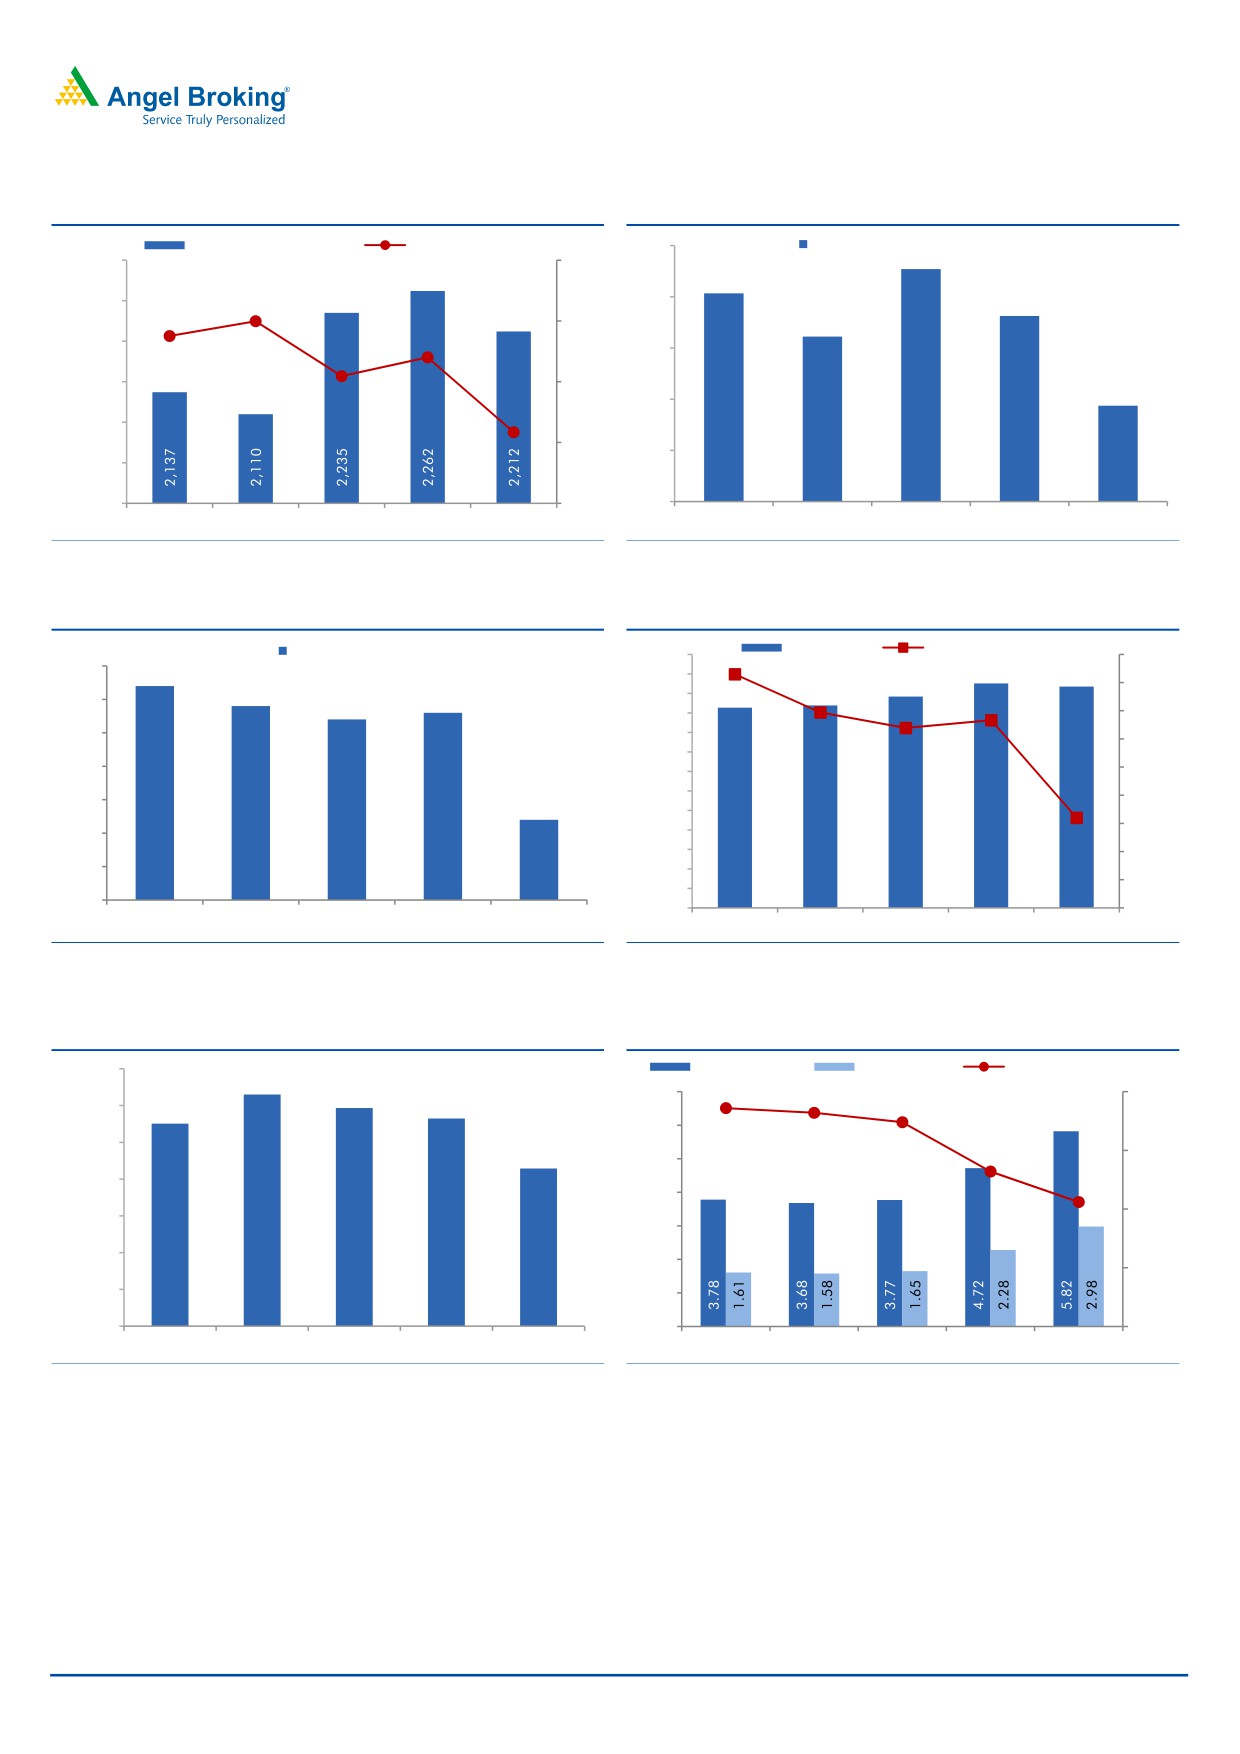
Muted growth in fee income
The core fee income growth remained muted during the quarter, increasing by
only 3.5% yoy. The bank booked profit of `2,131cr on sale of 2% stake in its life
insurance business and 9% in general insurance business during the quarter.
Exhibit 6: ‘Treasury Income’ aides non-interest income performance
Particulars (` cr)
4QFY16 3QFY16
% chg (qoq) 4QFY15
% chg (yoy)
Fee income
2,212
2,262
(2.2)
2,137
3.5
Treasury
2,190
1,442
51.9
726
201.7
Others
707
513
37.8
633
11.7
Non-interest income
5,109
4,217
21.2
3,496
46.1
Non-int. income excl. treasury
2,919
2,775
5.2
2,770
5.4
Source: Company, Angel Research
May 11, 2016
4
ICICI Bank | 4QFY2016 Result Update
Exhibit 7: Fee income growth
Exhibit 8: Share of fee income
Fee Income (` cr)
yoy growth (%, RHS)
1.4
Fee income to average assets (%)
2,300
12.0
1.4
1.4
2,250
1.4
1.3
9.0
1.3
2,200
9.0
1.3
8.3
7.2
2,150
6.3
6.0
1.2
1.3
2,100
3.5
3.0
1.2
2,050
2,000
-
1.2
4QFY15
1QFY16
2QFY16
3QFY16
4QFY16
4QFY15
1QFY16
2QFY16
3QFY16
4QFY16
Source: Company, Angel Research
Source: Company, Angel Research
Exhibit 9: NIM dips by 16bp qoq
Exhibit 10: NII growth trends
NIM (Reported, %)
NII (` cr)
YoY growth (%, RHS)
5,900
18.0
3.60
3.57
5,600
16.0
3.54
3.55
3.53
5,300
16.6
3.52
5,000
14.0
3.50
4,700
13.9
12.0
13.3
4,400
12.8
3.45
4,100
10.0
3,800
8.0
3.40
3.37
3,500
6.0
3.35
3,200
6.4
2,900
4.0
3.30
2,600
2.0
2,300
3.25
2,000
-
4QFY15
1QFY16
2QFY16
3QFY16
4QFY16
4QFY15
1QFY16
2QFY16
3QFY16
4QFY16
Source: Company, Angel Research
Source: Company, Angel Research
Exhibit 11: O/s Restructured book declines qoq
Exhibit 12: Asset quality during the quarter
14,000
Gross NPAs (%)
Net NPAs (%)
Coverage ratio (%, RHS)
(` cr)
12,604
11,868
7.00
58.6
58.2
60.0
11,294
57.4
12,000
11,017
6.00
10,000
8,573
53.2
55.0
5.00
8,000
50.6
4.00
50.0
6,000
3.00
4,000
2.00
45.0
2,000
1.00
-
-
40.0
4QFY15
1QFY16
2QFY16
3QFY16
4QFY16
4QFY15
1QFY16
2QFY16
3QFY16
4QFY16
Source: Company, Angel Research
Source: Company, Angel Research
May 11, 2016
5
ICICI Bank | 4QFY2016 Result Update
Asset quality deteriorates and likely to be under pressure going
ahead
The bank completed the AQR process during the quarter and hence slippages
stood at `7,003cr. It also implemented SDR worth `1,200cr and sees another
`500cr in the pipeline. Further, 5:25 done during the quarter stood at `680cr and
pipeline for the same stands at `750cr. GNPAs went up to 5.82% vs 4.72% in the
sequential previous quarter. The bank has said ~`44,000cr worth of loans,
primarily from the iron & steel, mining, power, and cement & rigs sectors are
under stress and a large part of the incremental slippages are likely to come up
from the aforementioned sectors. We expect slippages to remain high in FY2017,
with a large part coming in 1HFY2017 itself and some spill over could be seen in
FY2018 as well.
Overview of performance of subsidiaries
ICICI Bank’s consolidated net profit for 4QFY2016 declined by 86.8% yoy to
`407cr. The consolidated reported RoE came in at 11.3% for FY2016 as
compared to 15.0% in FY2015.
ICICI Bank’s overseas subsidiary, ICICI Bank UK’s earnings came at $0.5mn
for FY2016 as compared to $18.3mn for FY2015 while ICICI Bank Canada’s
earnings declined 33.5% yoy.
ICICI Prudential AMC reported a PAT of `326cr for FY2016 as compared to a
PAT of `247cr for FY2015 delivering a growth of 32%.
ICICI Lombard General Insurance reported a 5.4% decline in PAT at `507cr
for FY2016, as against `536cr in FY2015 whereas ICICI Home Finance
reported a PAT of `180cr for FY2016 as against a PAT of `198cr in FY2015.
Earnings for ICICI Securities (consolidated) came in at `239cr for FY2016 as
compared to `294cr for FY2015.
Exhibit 13: Performance of subsidiaries
Subsidiary
Parameter
4QFY16
4QFY15
% chg
FY2016
FY2015
% chg
ICICI Bank UK
PAT (USD mn)
(6.7)
0.8
(937.5)
0.5
18.3
(97.3)
ICICI Bank Canada
PAT (CAD mn)
2.6
7.5
(65.3)
22.4
33.7
(33.5)
ICICI Home Finance
PAT (` cr)
44
50
(11.9)
180.0
198.0
(9.1)
ICICI Prudential Life Insurance
APE (` cr)
1,676
1,598
4.9
5,170.0
4,744.0
9.0
NBP (` cr)
1,936
1,830
5.8
6,766.0
5,320.0
27.2
NBP margin (%)
-
-
-
-
-
-
AuM (` cr)
1,03,939
1,00,183
3.7
1,03,939
1,00,183
3.7
ICICI Lombard General Insurance
Gross Premium (` cr)
2,114
1,721
22.8
8,307
6,914
20.1
PAT (` cr)
118
130
(9.2)
507
536
(5.4)
ICICI Securities
PAT (` cr)
63
89
(29.2)
239
294
(18.7)
ICICI Securities PD
PAT (` cr)
13
47
(72.3)
195
217
(10.1)
ICICI Venture
PAT (` cr)
(6)
(14)
(57.1)
(21)
1
(2,200.0)
ICICI Prudential AMC
PAT (` cr)
80
57
40.4
326
247
32.0
Source: Company, Angel Research
May 11, 2016
6
ICICI Bank | 4QFY2016 Result Update
Outlook and Valuation
The outlook for ICICI Bank’s earnings remains challenging over the next two years.
However, at the current levels we believe the downside remains limited. At the
current market price, the bank’s core banking business (after adjusting `67/share
towards the value of subsidiaries) is trading at 1.0x FY2018E ABV. The stock has
corrected in the last one quarter due to concerns over deteriorating asset quality.
Though pain in asset quality is likely to persist in the quarters to come, we believe
the current valuations adequately factor in the relatively higher stressed assets in
the bank’s books. We recommend an Accumulate rating on the stock, with a target
price of `254.
Exhibit 14: SOTP valuation summary
Particulars
Value/share (`)
ICICI Bank
187
Life Insurance
33
General Insurance
17
Others (Home Fin, AMC, VC, Securities PD and Overseas subsidiaries)
17
SOTP Valuation
254
Source: Angel Research
Exhibit 15: Recommendation summary
CMP
Tgt. Price
Upside
FY2017E
FY2017E
FY2017E
FY15-17E
FY2017E
FY2017E
Company
Reco.
(`)
(`)
(%)
P/ABV (x)
Tgt. P/ABV (x)
P/E (x)
EPS CAGR (%)
RoA (%)
RoE (%)
HDFCBk
Accumulate
1,145
1,262
10.2
3.5
3.8
18.7
22.7
2.0
20.0
ICICIBk*
Accumulate
225
254
12.8
1.1
1.2
9.8
13.5
1.2
10.6
YesBk
Neutral
950
-
-
2.5
2.0
13.6
20.5
1.6
19.6
AxisBk
Neutral
488
-
-
2.0
2.0
11.2
18.4
1.8
18.9
SBI*
Neutral
189
-
-
1.1
0.7
9.2
8.3
0.6
11.2
FedBk
Neutral
49
-
-
0.9
0.9
8.9
(2.9)
0.9
10.8
SIB
Neutral
18
-
-
0.6
0.6
5.4
21.6
0.7
11.6
BOB
Neutral
157
-
-
1.0
1.0
12.1
(7.9)
0.4
7.3
PNB
Neutral
83
-
-
0.5
0.5
3.8
14.4
0.6
10.0
BOI
Neutral
89
-
-
0.2
0.9
2.7
14.0
0.3
7.6
IndBk
Neutral
94
-
-
0.3
0.2
3.1
19.4
0.6
8.6
Vijaya Bank
Neutral
32
-
-
0.4
0.4
4.7
14.1
0.4
8.8
OBC
Neutral
87
-
-
0.2
0.3
1.9
65.5
0.5
9.4
Allahabad Bank
Neutral
55
-
-
0.2
0.2
2.0
56.2
0.6
11.9
UnionBk
Neutral
121
-
-
0.4
0.3
3.1
18.1
0.6
11.4
CanBk
Neutral
194
-
-
0.3
0.2
2.7
12.0
0.6
11.2
IDBI#
Neutral
69
-
-
0.5
0.5
4.9
61.6
0.6
9.3
DenaBk
Neutral
29
-
-
0.2
0.3
2.9
45.6
0.4
7.9
Source: Company, Angel Research; Note:*Target multiples=SOTP Target Price/ABV (including subsidiaries), #Without adjusting for SASF
Company Background
ICICI Bank is India's largest private sector bank, with more than 5% market share
in credit. The bank has a pan-India extensive network of 4,450 branches and
around 13,776 ATMs. The bank has a large overseas presence (overseas loans
comprise ~23% of total loans). The bank also has market-leading subsidiaries in
life insurance, general insurance and asset management segments.
May 11, 2016
7
ICICI Bank | 4QFY2016 Result Update
Income statement (Standalone)
Y/E March (` cr)
FY13
FY14
FY15
FY16
FY17E
FY18E
Net Interest Income
13,866
16,476
19,040
21,224
23,100
29,474
- YoY Growth (%)
29.2
18.8
15.6
11.5
8.8
27.6
Other Income
8,346
10,428
12,176
15,323
15,600
15,975
- YoY Growth (%)
11.2
24.9
16.8
25.8
1.8
2.4
Operating Income
22,212
26,903
31,216
36,547
38,700
45,449
- YoY Growth (%)
21.8
21.1
16.0
17.1
5.9
17.4
Operating Expenses
9,013
10,309
11,496
12,684
14,735
17,660
- YoY Growth (%)
14.8
14.4
11.5
10.3
16.2
19.8
Pre - Provision Profit
13,199
16,595
19,720
23,863
23,966
27,789
- YoY Growth (%)
27.1
25.7
18.8
21.0
0.4
16.0
Prov. & Cont.
1,810
2,626
3,900
11,668
10,272
9,495
- YoY Growth (%)
13.9
45.7
48.5
199.2
(12.0)
(7.6)
Profit Before Tax
11,390
13,968
15,820
12,196
13,693
18,294
- YoY Growth (%)
29.5
22.6
13.3
(22.9)
12.3
33.6
Prov. for Taxation
3,064
4,158
4,644
2,469
3,834
5,946
- as a % of PBT
26.9
29.8%
29.4%
20.2%
28.0%
32.5%
PAT
8,325
9,810
11,176
9,726
9,859
12,348
- YoY Growth (%)
28.8
17.8
13.9
(130.)
1.4
25.2
Balance sheet (Standalone)
Y/E March (` cr)
FY13
FY14
FY15
FY16
FY17E
FY18E
Share Capital
1,154
1,161
1,167
1,163
1,165
1,170
Reserve & Surplus
65,552
72,052
79,262
88,566
95,467
1,04,111
Deposits
2,92,614
3,31,914
3,61,563
4,21,426
4,85,921
5,60,286
- Growth (%)
14.5
13.4
8.9
16.6
15.3
15.3
Borrowings
1,45,341
1,54,759
1,72,417
1,74,807
2,38,101
2,74,540
Other Liab. & Prov.
32,134
34,757
31,720
34,726
53,451
61,626
Total Liabilities
5,36,795
5,94,642
6,46,129
7,20,688
8,74,105
10,01,733
Cash in Hand and with
19,053
21,822
25,653
27,106
29,155
33,617
RBI
Bal.with banks & money
22,365
19,708
16,652
32,763
20,652
23,812
at call
Investments
1,71,394
1,77,022
1,86,580
1,60,412
2,71,508
3,13,060
Advances
2,90,249
3,38,703
3,87,522
4,35,264
4,99,441
5,78,657
- Growth (%)
16.7
14.4
12.3
14.7
15.9
Fixed Assets
4,647
4,678
4,726
7,577
7,046
8,124
Other Assets
29,087
32,709
24,997
57,567
46,304
44,463
Total Assets
5,36,795
5,94,642
6,46,129
7,20,688
8,74,105
10,01,733
- Growth (%)
11.4
10.8
8.7
11.5
21.3
14.6
May 11, 2016
8
ICICI Bank | 4QFY2016 Result Update
Ratio analysis (Standalone)
Y/E March
FY13
FY14
FY15
FY16
FY17E
FY18E
Profitability ratios (%)
NIMs
2.9
3.1
3.2
3.3
3.1
3.3
Cost to Income Ratio
40.6
38.3
36.8
34.7
38.1
38.9
RoA
1.6
1.7
1.8
1.4
1.2
1.3
RoE
13.1
14.0
14.5
11.4
10.6
12.2
B/S ratios (%)
CASA Ratio
10.3
16.2
15.5
17.5
15.7
15.6
Credit/Deposit Ratio
99.2
102.0
107.2
103.3
102.8
103.3
CAR
18.7
17.7
17.0
16.6
15.0
14.5
- Tier I
12.8
12.8
12.8
13.1
12.0
11.7
Asset Quality (%)
Gross NPAs
3.2
3.0
3.8
5.8
6.5
5.6
Net NPAs
0.6
1.0
1.6
3.0
4.0
3.6
Slippages
1.4
1.7
2.4
4.4
2.9
1.5
Loan Loss Prov. /Avg. Assets
0.6
0.8
1.0
2.7
2.1
1.6
Provision Coverage
76.8
70.4
59.1
50.3
52.0
52.8
Per Share Data (`)
EPS
14.4
17.0
19.3
16.7
16.9
21.2
ABVPS (75% cover.)
111.8
121.1
127.9
129.5
131.9
144.8
DPS
4.0
4.4
4.8
5.0
5.0
6.0
Valuation Ratios
PER (x)
15.6
13.3
11.7
13.5
13.3
10.6
P/ABVPS (x)
2.0
1.9
1.8
1.7
1.7
1.6
Dividend Yield
1.8
2.0
2.1
2.2
2.2
2.7
DuPont Analysis
NII
2.7
2.9
3.1
3.1
2.9
3.1
(-) Prov. Exp.
0.4
0.5
0.6
1.7
1.3
1.0
Adj NII
2.4
2.4
2.4
1.4
1.6
2.1
Other Inc.
1.6
1.8
2.0
2.2
2.0
1.7
Op. Inc.
4.0
4.3
4.4
3.6
3.6
3.8
Opex
1.8
1.8
1.9
1.9
1.8
1.9
PBT
2.2
2.5
2.6
1.8
1.7
2.0
Taxes
0.6
0.7
0.7
0.4
0.5
0.6
ROA
1.6
1.7
1.8
1.4
1.2
1.3
Leverage
8.1
8.1
8.1
8.0
8.6
9.3
RoE
13.1
14.0
14.5
11.4
10.6
12.2
May 11, 2016
9
ICICI Bank | 4QFY2016 Result Update
Research Team Tel: 022 - 39357800
DISCLAIMER
Angel Broking Private Limited (hereinafter referred to as “Angel”) is a registered Member of National Stock Exchange of India Limited,
Bombay Stock Exchange Limited and MCX Stock Exchange Limited. It is also registered as a Depository Participant with CDSL and
Portfolio Manager with SEBI. It also has registration with AMFI as a Mutual Fund Distributor. Angel Broking Private Limited is a
registered entity with SEBI for Research Analyst in terms of SEBI (Research Analyst) Regulations, 2014 vide registration number
INH000000164. Angel or its associates has not been debarred/ suspended by SEBI or any other regulatory authority for accessing
/dealing in securities Market. Angel or its associates including its relatives/analyst do not hold any financial interest/beneficial
ownership of more than 1% in the company covered by Analyst. Angel or its associates/analyst has not received any compensation /
managed or co-managed public offering of securities of the company covered by Analyst during the past twelve months. Angel/analyst
has not served as an officer, director or employee of company covered by Analyst and has not been engaged in market making activity
of the company covered by Analyst.
This document is solely for the personal information of the recipient, and must not be singularly used as the basis of any investment
decision. Nothing in this document should be construed as investment or financial advice. Each recipient of this document should
make such investigations as they deem necessary to arrive at an independent evaluation of an investment in the securities of the
companies referred to in this document (including the merits and risks involved), and should consult their own advisors to determine
the merits and risks of such an investment.
Reports based on technical and derivative analysis center on studying charts of a stock's price movement, outstanding positions and
trading volume, as opposed to focusing on a company's fundamentals and, as such, may not match with a report on a company's
fundamentals.
The information in this document has been printed on the basis of publicly available information, internal data and other reliable
sources believed to be true, but we do not represent that it is accurate or complete and it should not be relied on as such, as this
document is for general guidance only. Angel Broking Pvt. Limited or any of its affiliates/ group companies shall not be in any way
responsible for any loss or damage that may arise to any person from any inadvertent error in the information contained in this report.
Angel Broking Pvt. Limited has not independently verified all the information contained within this document. Accordingly, we cannot
testify, nor make any representation or warranty, express or implied, to the accuracy, contents or data contained within this document.
While Angel Broking Pvt. Limited endeavors to update on a reasonable basis the information discussed in this material, there may be
regulatory, compliance, or other reasons that prevent us from doing so.
This document is being supplied to you solely for your information, and its contents, information or data may not be reproduced,
redistributed or passed on, directly or indirectly.
Neither Angel Broking Pvt. Limited, nor its directors, employees or affiliates shall be liable for any loss or damage that may arise from
or in connection with the use of this information.
Note: Please refer to the important ‘Stock Holding Disclosure' report on the Angel website (Research Section). Also, please refer to the
latest update on respective stocks for the disclosure status in respect of those stocks. Angel Broking Pvt. Limited and its affiliates may
have investment positions in the stocks recommended in this report.
Disclosure of Interest Statement
ICICI Bank
1. Analyst ownership of the stock
No
2. Angel and its Group companies ownership of the stock
No
3. Angel and its Group companies' Directors ownership of the stock
No
4. Broking relationship with company covered
No
Note: We have not considered any Exposure below ` 1 lakh for Angel, its Group companies and Directors
Ratings (Based on expected returns
Buy (> 15%)
Accumulate (5% to 15%)
Neutral (-5 to 5%)
over 12 months investment period):
Reduce (-5% to -15%)
Sell (< -15)
May 11, 2016
10