3QFY2016 Result Update | Banking
January 29, 2016
ICICI Bank
ACCUMULATE
CMP
`230
Performance Highlights
Target Price
`254
Particulars (` cr)
3QFY16 2QFY16
% chg (qoq)
3QFY15
% chg (yoy)
Investment Period
12 Months
NII
5,453
5,251
3.8
4,812
13.3
Pre-prov. profit
6,560
5,158
27.2
5,037
30.2
Stock Info
PAT
3,018
3,030
(0.4)
2,889
4.5
Sector
Banking
Source: Company, Angel Research
Market Cap (` cr)
1,33,742
ICICI Bank reported a disappointing set of results for 3QFY2016. Though
Beta
1.4
operating numbers remained decent, a sharp increase in slippages was the key
52 Week High / Low
383/216
negative during the quarter. The bank booked profit of `1,243cr on sale of 4%
Avg. Daily Volume
1,28,17,908
stake in its life insurance business during the quarter.
Face Value (`)
2
BSE Sensex
24,871
Healthy growth in advances, backed by retail loans: During 3QFY2016, the
Nifty
7,564
bank’s advances grew by 15.8% yoy (6.1% qoq), aided by healthy retail loan book
Reuters Code
ICBK.NS
growth of 24% yoy. Personal loans and home loans were the main drivers leading
Bloomberg Code
ICICIBC@IN
to the growth in the retail loan book. Retail contribution to total loans increased to
43.8% as compared to 40.9% in 3QFY2015. The corporate book grew 10.2% yoy.
NII grew by 13.3% yoy to `5,453cr, largely in line with our expectation. Due to
Shareholding Pattern (%)
high slippages, the bank took provision of `2,844cr vs `980cr in 3QFY2015, up
by 190% yoy. However, proceeds from the stake sale in its life insurance business
Promoters
NA
helped the reported PAT grow by 4.5% yoy to `3,018cr.
MF / Banks / Indian Fls
24.3
Pick up in deposits growth: Deposits growth picked up, growing by 14.6% yoy
FII / NRIs / OCBs
67.3
compared to 9.3% yoy growth reported in 2QFY2016. CASA deposits also
Indian Public / Others
8.4
accelerated, growing by 17.7% yoy, resulting in an improvement in the CASA ratio
by 120bp yoy to 45.2%. The Reported NIM improved marginally by 1bp qoq to
3.53%, with domestic NIM at 3.86% as compared to 3.84% in 2QFY2016.
Abs. (%)
3m
1yr
3yr
Asset quality deteriorates sharply: Slippages went up sharply to
`6,544cr
(annualized slippage ratio at 6.8%) vs `2,242cr in 2QFY16 (annualized slippage
Sensex
(7.3)
(16.2)
24.4
ratio of 2.3%), with slippage from restructuring at `1,355cr. 2/3rd of the slippages
ICICI Bank
(15.2)
(39.4)
(4.2)
during the quarter came from the RBI highlighted accounts, with a large steel
account being classified as NPA. The GNPA ratio increased by 95bp sequentially
to 4.72%, whereas the NNPA ratio rose 63bp qoq to 2.28%. The bank refinanced
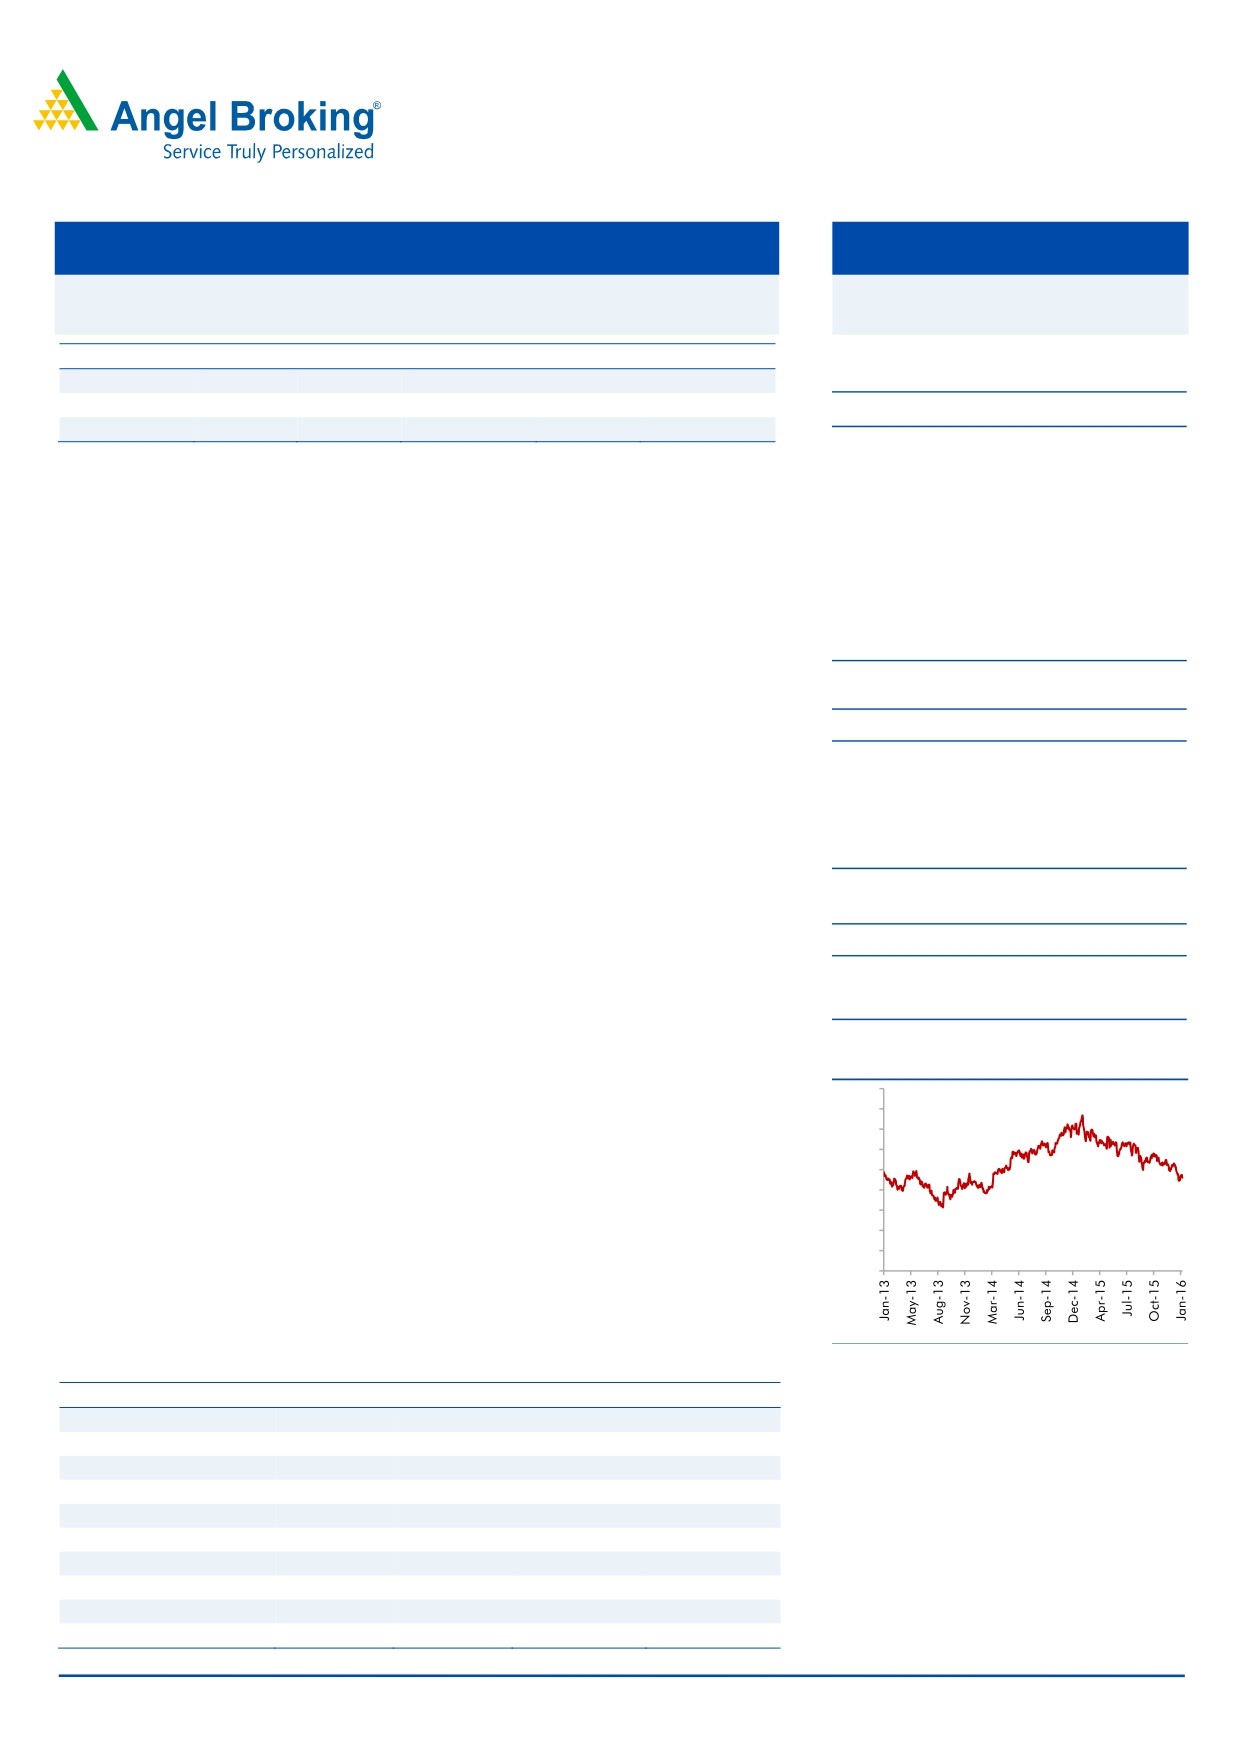
3-year price chart
~`450cr under the 5:25 scheme and SDR worth `1,670cr. It expects SDR of
450
`700cr and 5:25 of `1,200cr in 4QFY2016. The Management has guided at
400
350
similar level of slippages in 4QFY2016 as well. Outstanding restructured loans
300
came down to `11,294cr at the end of 3QFY2016 vs `11,868cr in 2QFY2016.
250
Outlook and valuation: At the current market price, the bank’s core banking
200
150
business (after adjusting `67/share towards the value of subsidiaries) is trading at
100
1.1x FY2017E ABV. The stock has corrected in the last one quarter due to concerns
50
over deteriorating asset quality. Though pain in asset quality is likely to persist in
0
the quarters to come, we believe the current valuations adequately factor in the
relatively higher stressed assets in the bank’s books. We recommend an
Accumulate rating on the stock, with a revised target price of `254.
Source: Company, Angel Research
Key financials (Standalone)
Y/E March (` cr)
FY2014
FY2015
FY2016E
FY2017E
Vaibhav Agrawal
NII
16,476
19,040
21,301
24,365
022 - 3935 7800 Ext: 6808
% chg
18.8
15.6
11.9
14.4
Net profit
9,810
11,045
12,238
14,220
% chg
17.8
12.6
10.8
16.2
Siddharth Purohit
NIM (%)
3.2
3.3
3.3
3.3
022 - 3935 7800 Ext: 6872
EPS (`)
17.0
18.9
21.0
24.4
P/E (x)
13.5
12.2
11.0
9.4
P/ABV (x)
1.9
2.0
1.8
1.6
Chintan Shah
RoA (%)
1.6
1.6
1.5
1.6
022 - 4000 3600 Ext: 6828
RoE (%)
14.9
14.8
14.4
14.7
Source: Company, Angel Research; Note: CMP as of January 29, 2015
Please refer to important disclosures at the end of this report
1
ICICI Bank | 3QFY2016 Result Update
Exhibit 1: 3QFY2016 performance (Standalone)
Particulars (` cr)
3QFY16
2QFY16
% chg (qoq)
3QFY15
% chg (yoy)
FY2015
FY2014
% chg
Interest earned
13,346
13,099
1.9
12,435
7.3
49,091
44,178
11.1
- on Advances / Bills
9,863
9,665
2.1
9,032
9.2
35,631
31,428
13.4
- on investments
2,652
2,661
(0.3)
3,012
(11.9)
11,945
11,557
3.4
- on balance with RBI & others
36
31
15.1
53
(31.8)
195
200
(2.4)
- on others
795
741
7.2
338
134.9
1,320
993
32.9
Interest Expended
7,893
7,847
0.6
7,624
3.5
30,052
27,703
8.5
Net Interest Income
5,453
5,251
3.8
4,812
13.3
19,040
16,476
15.6
Other income
4,217
3,007
40.2
3,092
36.4
12,176
10,428
16.8
Other income excl. treasury
2,775
2,785
(0.4)
2,649
4.8
10,482
9,412
11.4
- Fee income
2,262
2,235
1.2
2,110
7.2
8,286
7,758
6.8
- Treasury income
1,442
222
549.5
443
225.5
1,694
1,016
66.7
- Others
513
550
(6.7)
538
(4.6)
2,196
1,654
32.8
Operating income
9,670
8,259
17.1
7,903
22.4
31,216
26,903
16.0
Operating expenses
3,110
3,100
0.3
2,866
8.5
11,496
10,309
11.5
- Employee expenses
1,140
1,213
(6.0)
1,118
2.0
4,750
4,220
12.6
- Other Opex
1,970
1,888
4.3
1,749
12.6
6,746
6,089
10.8
Pre-provision Profit
6,560
5,158
27.2
5,037
30.2
19,720
16,595
18.8
Provisions & Contingencies
2,844
942
201.9
980
190.3
3,900
2,626
48.5
PBT
3,716
4,216
(11.9)
4,057
(8.4)
15,820
13,968
13.3
Provision for Tax
698
1,186
(41.2)
1,168
(40.3)
4,645
4,158
11.7
PAT
3,018
3,030
(0.4)
2,889
4.5
11,175
9,810
13.9
Effective Tax Rate (%)
18.8
28.1
(936)bp
28.8
(1002)bp
29.4
29.8
(41)bp
Source: Company, Angel Research
January 29, 2016
2
ICICI Bank | 3QFY2016 Result Update
Exhibit 2: 3QFY2016 performance analysis (Standalone)
Particulars
3QFY16 2QFY16
% chg (qoq) 3QFY15
% chg (yoy)
Balance sheet
Advances (` cr)
4,34,800
4,09,693
6.1
3,75,345
15.8
Deposits (` cr)
4,07,314
3,84,618
5.9
3,55,340
14.6
Credit-to-Deposit Ratio (%)
106.7
106.5
23bp
105.6
112bp
Current deposits (` cr)
57,181
49,504
15.5
45,916
24.5
Saving deposits (` cr)
1,26,918
1,23,985
2.4
1,10,533
14.8
CASA deposits (` cr)
1,84,099
1,73,489
6.1
1,56,449
17.7
CASA ratio (%)
45.2
45.1
9bp
44.0
117bp
CAR (%)
15.8
16.2
(38)bp
17.6
(180)bp
Tier 1 CAR (%)
11.8
12.1
(30)bp
13.0
(117)bp
Profitability Ratios (%)
Reported NIM
3.52
3.54
(2)bp
3.42
10bp
Cost-to-income ratio
32.2
37.5
(538)bp
36.3
(411)bp
Asset quality
Gross NPAs (` cr)
21,356
16,006
33.4
13,231
61.4
Gross NPAs (%)
4.7
3.8
95bp
3.4
132bp
Net NPAs (` cr)
10,014
6,828
46.7
4,773
109.8
Net NPAs (%)
2.3
1.7
63bp
1.3
101bp
Provision Coverage Ratio (%)
53.2
57.4
(420)bp
63.5
(1030)bp
Slippage ratio (%)
6.8
2.3
444bp
2.7
406bps
Provision exps. to avg. adv (%)
1.7
0.6
109bp
0.6
104bp
Source: Company, Angel Research
Healthy growth in advances, backed by retail loans
During 3QFY2016, the bank’s advances grew by 15.8% yoy (6.1% qoq), aided by
healthy retail loan book growth of 24% yoy. The main drivers leading to the
growth in the retail loan book were Personal loans and Home loans. Retail
contribution to total loans, increased to 43.8% as compared to 40.9% in 3QFY15.
The corporate book grew 10.2% yoy. NII grew by 13.3% yoy to `5,453 cr largely
in line with expectations. Due to high slippages the bank took provision of
`2,844cr vs `980cr in 3QFY15, up by 190%. However, proceeds from stake sale
in Life Insurance business helped reporting PAT growth of 4.5% to `3,018 cr.
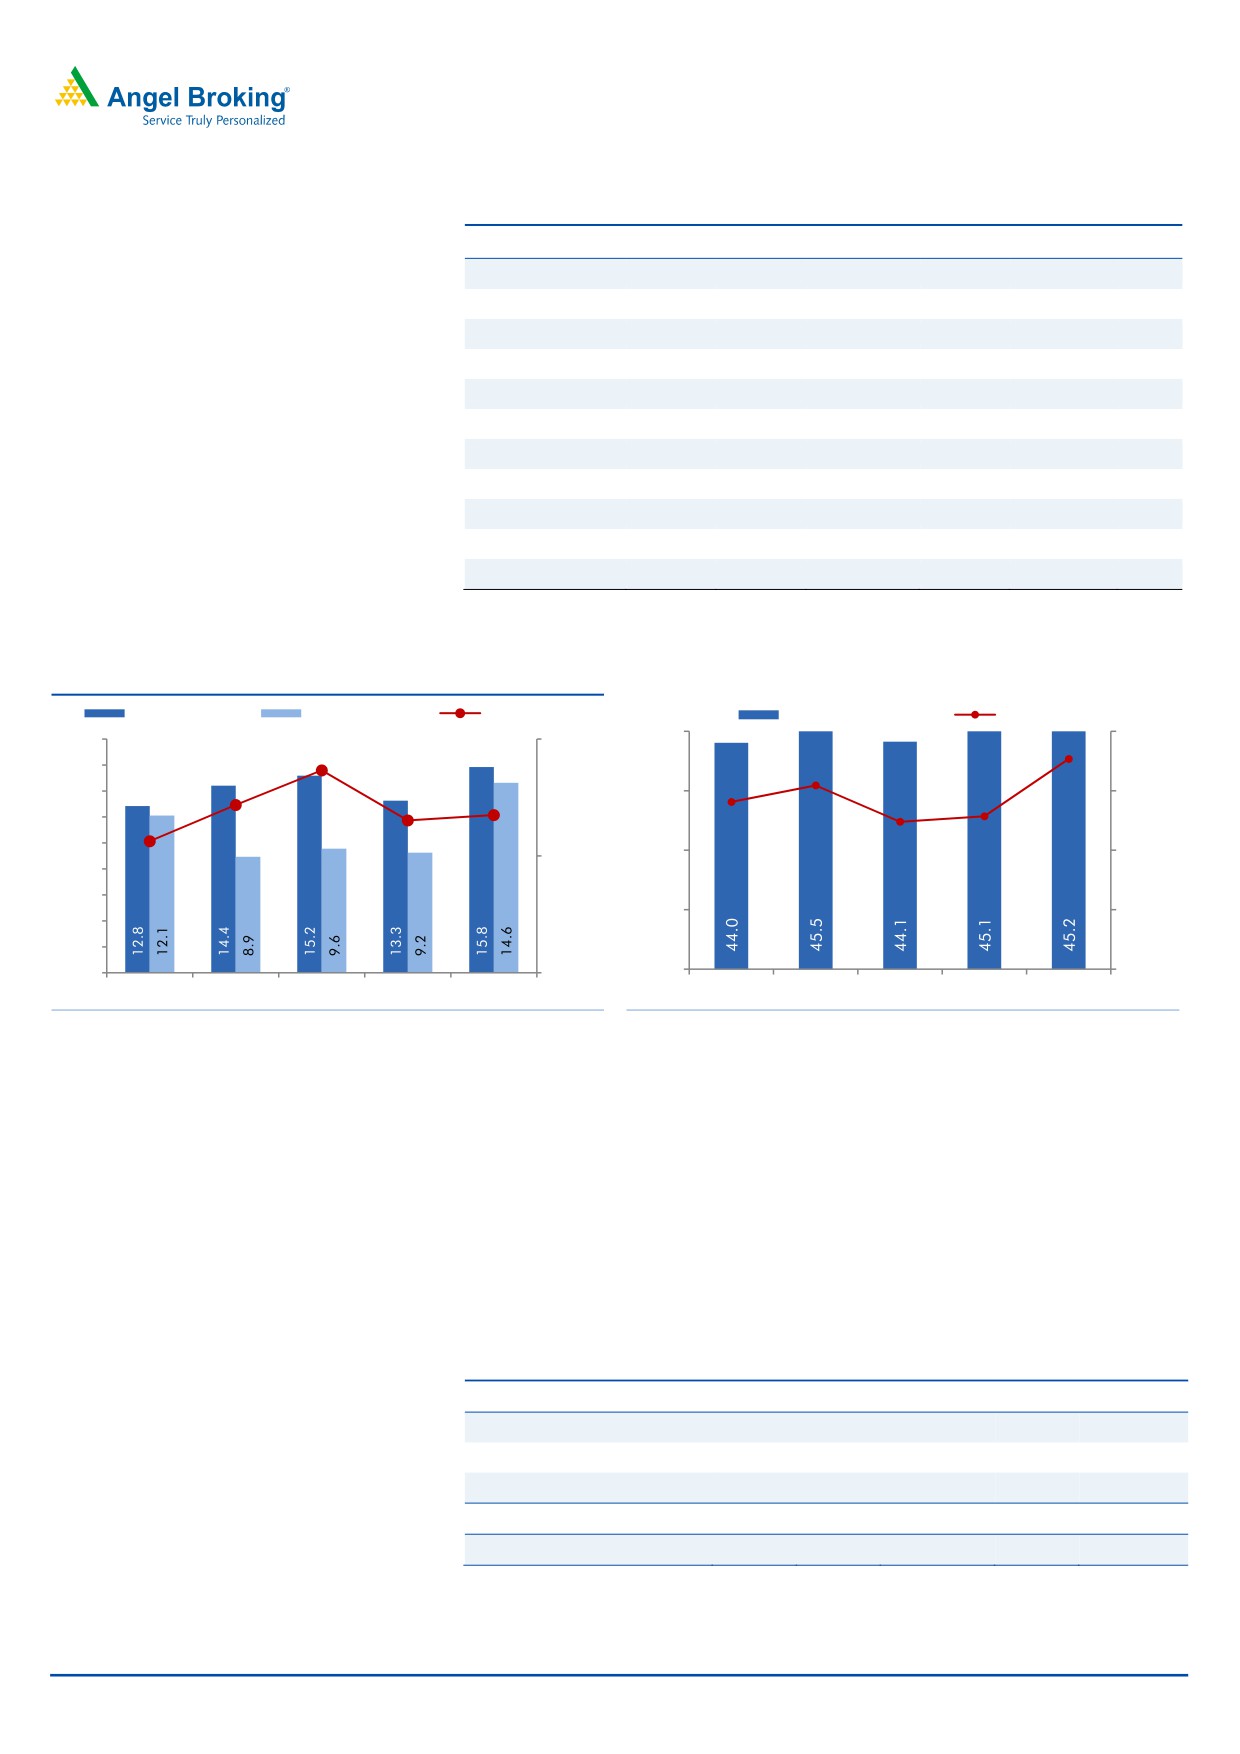
Deposits growth picked up
Deposits growth picked up in 3QFY16 growing by 14.6% yoy compared to 9.2%
growth reported in 2QFY16. CASA deposits also accelerated growing by 17.7%
yoy, resulting in improvement in CASA ratio by 120bp yoy to 45.2%. The Reported
NIM improved marginally by by 1bp qoq to 3.53%, with domestic NIM at 3.86%
as compared to 3.84% in 2QFY2016. Fee income reported a modest growth of
7.2% yoy.
January 29, 2016
3
ICICI Bank | 3QFY2016 Result Update
Exhibit 3: Retail lending supports Loan Growth
Particulars (` cr)
3QFY16
2QFY16
% chg (qoq) 3QFY15
% chg (yoy) % total
Domestic Corporate
1,25,222
1,16,353
7.6
1,08,850
15.0
28.4
Overseas branches
99,134
95,458
3.9
96,464
2.8
23.3
SME
20,001
17,617
13.5
16,515
21.1
4.3
Retail Total
1,90,442
1,80,265
5.6
1,53,516
24.1
44.0
-Home
1,04,553
99,326
5.3
84,434
23.8
55.1
-Vehicle loans
33,708
32,267
4.5
28,708
17.4
17.9
-Others
27,805
25,778
7.9
21,953
26.7
14.3
-Banking business
10,093
10,095
(0.0)
8,136
24.1
5.6
-Credit cards
5,142
4,507
14.1
3,838
34.0
2.5
-Personal loans
9,141
8,292
10.2
6,448
41.8
4.6
Total advances
4,34,800
4,09,693
6.1
3,75,345
15.8
100.0
Source: Company, Angel Research
Exhibit 4: Retail segment supports Advances growth
Exhibit 5: CASA ratio rises, CASA deposits up 17.7% yoy
Adv. yoy growth
Dep. yoy growth
CDR (%, RHS)
CASA ratio (%)
yoy Growth
45.0
20.0
18.0
110.0
108.7
16.0
15.5
107.2
14.1
14.0
106.7
40.0
12.9
17.7
15.0
106.5
12.4
12.0
105.6
10.0
35.0
10.0
105.0
8.0
6.0
30.0
5.0
4.0
2.0
-
100.0
25.0
-
3QFY15
4QFY15
1QFY16
2QFY16
3QFY16
3QFY15
4QFY15
1QFY16
2QFY16
3QFY16
Source: Company, Angel Research
Source: Company, Angel Research
Muted growth in fee income
The core fee income growth remained muted up by only 7.2% yoy. The bank
booked profit of `1,243cr on sale of 4% stake in its life insurance business during
the quarter. Excluding this onetime gain the non interest income would have
declined by 3.9% yoy. However, the bank is likely to get approval from the
concerned authorities for balance 2% stake sale in Life Insurance business and 9%
stake sales in its General Insurance business, which might flow in the coming
quarters.
Exhibit 6: ‘Treasury Income’ aides non-interest income performance
Particulars (` cr)
3QFY16 2QFY16
% chg (qoq) 3QFY15
% chg (yoy)
Fee income
2,262
2,235
1.2
2,110
7.2
Treasury
1,442
222
549.5
443
225.5
Others
513
550
(6.7)
538
(4.6)
Non-interest income
4,217
3,007
40.2
3,091
36.4
Non-int. income excl. treasury
2,775
2,785
(0.4)
2,648
4.8
Source: Company, Angel Research
January 29, 2016
4
ICICI Bank | 3QFY2016 Result Update
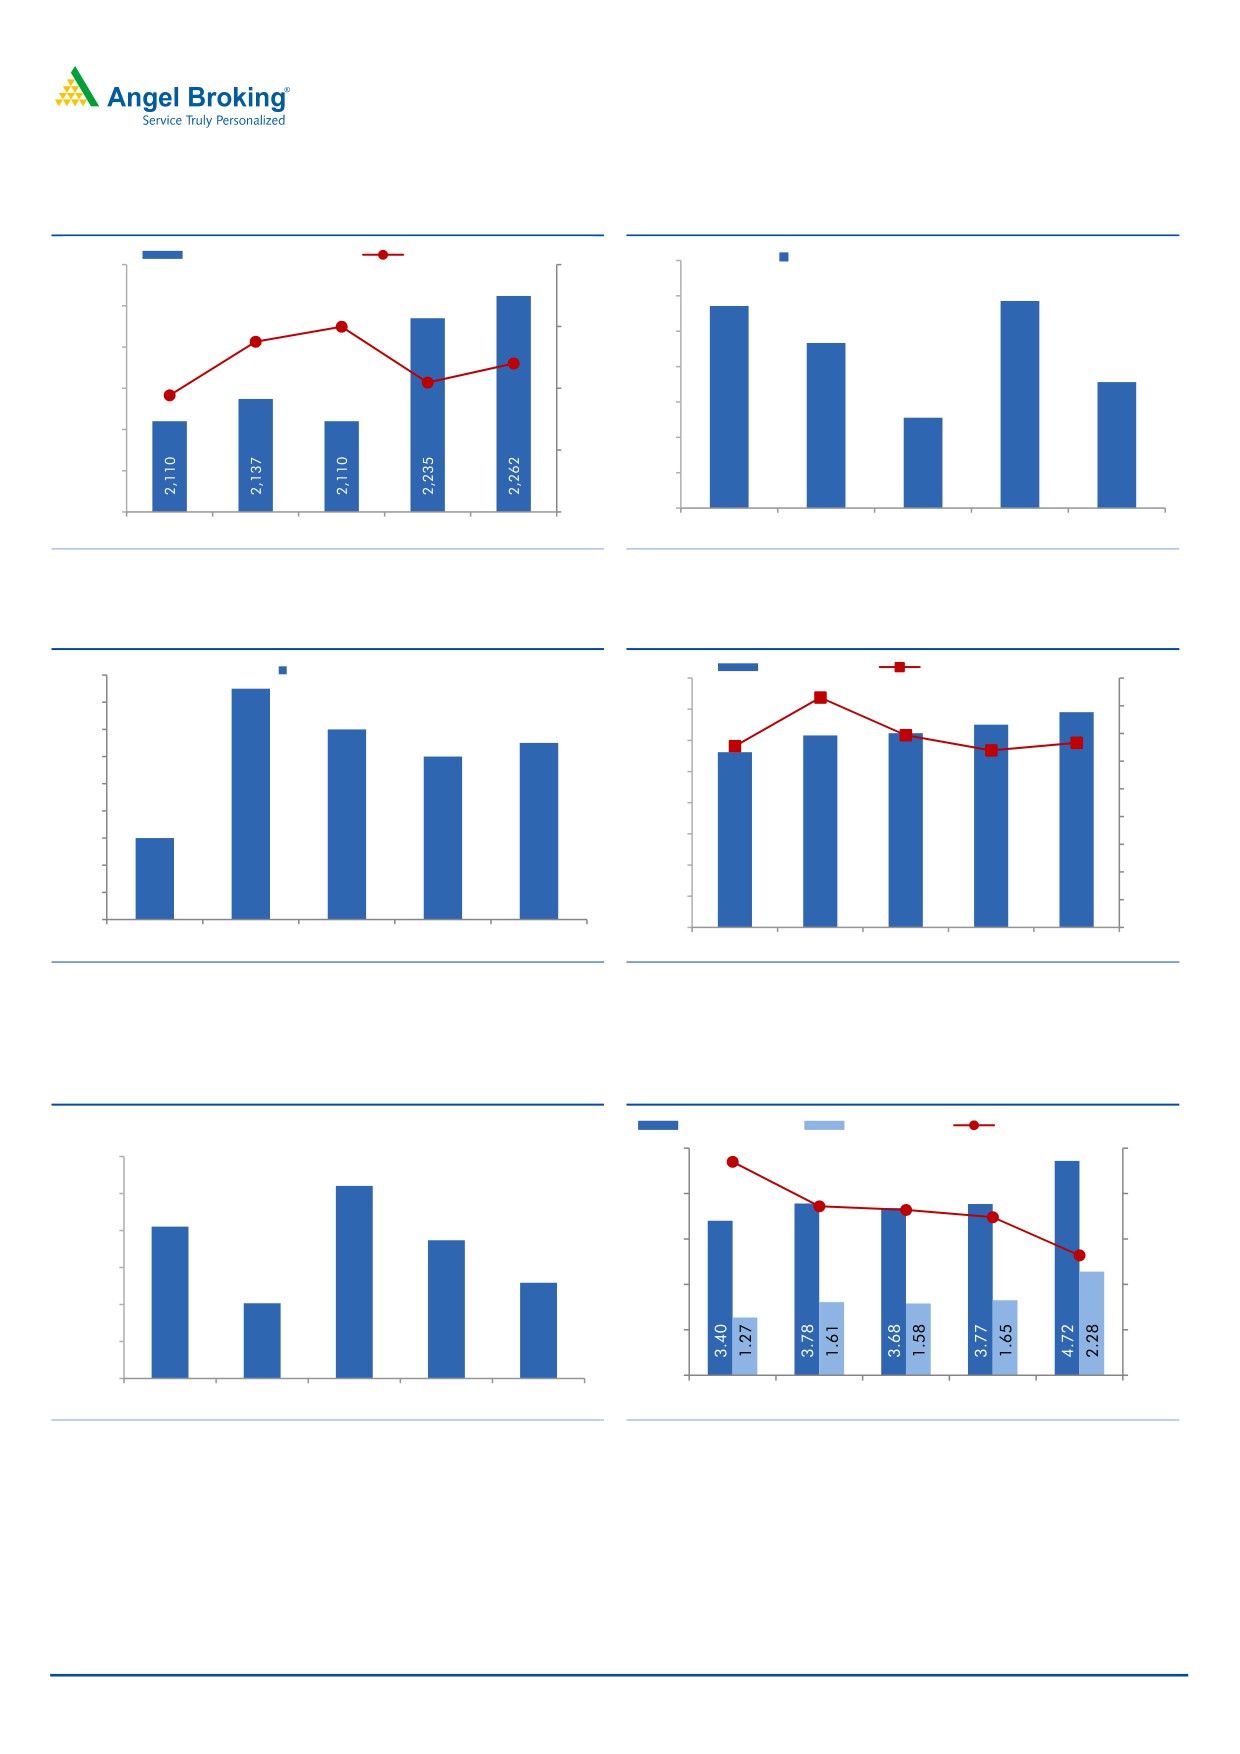
Exhibit 7: Fee income growth at 7.2% yoy
Exhibit 8: Share of fee income
Fee Income (` cr)
yoy growth (%, RHS)
Fee income to average assets (%)
2,300
12.0
1.4
9.0
1.4
1.4
1.4
2,250
8.3
9.0
1.4
1.4
2,200
7.2
5.7
6.3
1.3
1.3
2,150
6.0
1.3
1.3
2,100
1.3
3.0
2,050
1.3
2,000
-
1.3
3QFY15
4QFY15
1QFY16
2QFY16
3QFY16
3QFY15
4QFY15
1QFY16
2QFY16
3QFY16
Source: Company, Angel Research
Source: Company, Angel Research
Exhibit 9: NIM improves marginally on qoq basis
Exhibit 10: NII growth trends
NIM (Reported, %)
NII (` cr)
YoY growth (%, RHS)
3.58
6,000
18.0
3.56
16.0
5,500
3.54
14.0
5,000
3.52
16.6
13.9
12.0
13.1
13.3
4,500
12.8
3.50
10.0
4,000
3.48
8.0
3.46
3,500
6.0
3.44
3,000
4.0
3.42
2,500
3.46
3.57
3.54
3.52
3.53
2.0
3.40
2,000
-
3QFY15
4QFY15
1QFY16
2QFY16
3QFY16
3QFY15
4QFY15
1QFY16
2QFY16
3QFY16
Source: Company, Angel Research
Source: Company, Angel Research
Exhibit 11: O/s Restructured book declines qoq
Exhibit 12: Asset quality during the quarter
(` cr)
Gross NPAs (%)
Net NPAs (%)
Coverage ratio (%, RHS)
5.00
65.0
13,000
12,604
63.5
58.6
58.2
12,500
4.00
57.4
60.0
12,052
11,868
12,000
53.2
3.00
55.0
11,500
11,294
11,017
2.00
50.0
11,000
1.00
45.0
10,500
10,000
-
40.0
3QFY15
4QFY15
1QFY16
2QFY16
3QFY16
3QFY15
4QFY15
1QFY16
2QFY16
3QFY16
Source: Company, Angel Research
Source: Company, Angel Research
Asset Quality deteriorated sharply
Slippages went up sharply to `6,544cr (annualized slippage ratio at 6.8%) as
compared to `2,242cr in the sequential previous quarter (annualized slippage
ratio at 2.3%), with slippage from restructuring at `1,355 cr. 2/3 rd of the
slippages during the quarter came from the RBI highlighted accounts, with a large
January 29, 2016
5
ICICI Bank | 3QFY2016 Result Update
steel account being classified as NPA. The Gross NPA ratio increased 95bp
sequentially to 4.72%, whereas the Net NPA rose 63bp qoq to 2.28%. The bank
refinanced ~`450cr under the 5:25 scheme and SDR worth `1,670cr and expects
SDR of `700cr and 5:25 of `1,200cr in 4QFY16 and the management has guided
for similar level of slippages in 4QFY16 as well. Outstanding restructured loans
came down to `11,294cr at the end of 3QFY16 vs `11,868cr in 2QFY16.
Overview of performance of subsidiaries
ICICI Bank’s consolidated net profit for 3QFY2016 declined by 4.55% yoy to
`3,122cr. The consolidated reported RoE came in at 13.5% for 3QFY2016 as
compared to 15.5% in 3QFY2015.
ICICI Bank’s overseas subsidiary, ICICI Bank UK’s earnings remained flat yoy
during 3QFY2016 while ICICI Bank Canada’s earnings increased 88% yoy.
ICICI Prudential AMC reported a PAT of `82cr for 3QFY2016 as compared to
a PAT of `67cr for 3QFY2015.
ICICI Lombard General Insurance reported a 26% decline in PAT at `130 cr
for 3QFY2016, as against `176cr in 3QFY2015 whereas ICICI Home Finance
reported a PAT of `40 cr for 3QFY2016 as against a PAT of `50 cr in
3QFY2015. Earnings for ICICI Securities came in at `55cr for 3QFY2016
compared to `76 cr.
Exhibit 13: Performance of subsidiaries
Subsidiary
Parameter
3QFY16
3QFY15
% chg
FY2015
FY2014
% chg
ICICI Bank UK
PAT (USD mn)
6.1
6.1
-
18.3
25.2
(27.4)
ICICI Bank Canada
PAT (CAD mn)
5.4
3.0
80.0
33.7
48.3
(30.2)
ICICI Home Finance
PAT (` cr)
40
50
(19.4)
198.0
223.0
(11.2)
ICICI Prudential Life Insurance
APE (` cr)
1,259
1,290
(2.4)
4,744.0
3,444.0
37.7
NBP (` cr)
174
147
18.4
532.0
427.0
24.6
NBP margin (%)
14
11
21.1
11
12
-
AuM (` cr)
1,01,731
94,593
7.5
1,00,183
80,597
24.3
ICICI Lombard General Insurance
Gross Premium (` cr)
2,072
1,708
21.3
6,914
7,134
(3.1)
PAT (` cr)
130
176
(26.1)
536
511
4.9
ICICI Securities
PAT (` cr)
55
76
(27.6)
294
91
223.1
ICICI Securities PD
PAT (` cr)
63
75
(16.0)
217
132
64.4
ICICI Venture
PAT (` cr)
(9)
5
(280.0)
1
33
(97.0)
ICICI Prudential AMC
PAT (` cr)
82
67
22.4
247
183
35.0
Source: Company, Angel Research
Outlook and Valuation
At the current market price, the bank’s core banking business (after adjusting
`67/share towards the value of subsidiaries) is trading at 1.1x FY2017E ABV. The
stock has corrected in the last one quarter due to concerns over deteriorating asset
quality. Though pain in asset quality is likely to persist in the quarters to come, we
believe the current valuations adequately factor in the relatively higher stressed
assets in the bank’s books. We recommend an Accumulate rating on the stock,
with a revised target price of `254.
January 29, 2016
6
ICICI Bank | 3QFY2016 Result Update
Exhibit 14: SOTP valuation summary
Particulars
Target multiple
Value/share (`)
ICICI Bank
1.1x FY2017E ABV
187
Life Insurance
34.0x FY2017E NBP
33
General Insurance
32x FY2014 PAT
17
Others (Home Fin, AMC, VC, Securities
18
PD and Overseas subsidiaries)
SOTP value
254
Source: Angel Research
Exhibit 15: Recommendation summary
CMP
Tgt. Price
Upside
FY2017E
FY2017E
FY2017E
FY15-17E
FY2017E
FY2017E
Company
Reco.
(`)
(`)
(%)
P/ABV (x)
Tgt. P/ABV (x)
P/E (x)
EPS CAGR (%)
RoA (%)
RoE (%)
HDFCBk
Buy
1,049
1,262
20.3
3.2
3.8
17.2
22.4
1.9
19.7
ICICIBk*
Accumulate
230
254
10.3
1.6
1.3
9.4
13.5
1.6
14.7
YesBk
Neutral
747
-
-
1.9
2.0
10.7
20.5
1.6
19.6
AxisBk
Buy
408
494
21.0
1.7
2.0
9.4
18.4
1.8
18.9
SBI*
Accumulate
180
202
12.1
0.9
0.8
7.4
17.8
0.7
12.8
FedBk
Neutral
46
-
-
0.9
0.9
8.3
(2.9)
0.9
10.8
SIB
Neutral
19
-
-
0.7
0.7
5.6
21.6
0.7
11.6
BOB
Neutral
126
-
-
0.7
0.7
6.0
17.5
0.6
10.6
PNB
Neutral
91
-
-
0.4
0.4
3.3
28.5
0.7
12.0
BOI
Neutral
100
-
-
0.3
0.7
3.0
14.0
0.3
7.6
IndBk
Neutral
91
-
-
0.3
0.3
3.1
19.4
0.6
8.6
Vijaya Bank
Neutral
31
-
-
0.4
0.4
4.7
14.1
0.4
8.8
OBC
Neutral
112
-
-
0.2
0.3
2.5
65.5
0.5
9.4
Allahabad Bank Neutral
54
-
-
0.2
0.2
2.0
56.2
0.6
11.9
UnionBk
Neutral
130
-
-
0.4
0.3
3.3
18.1
0.6
11.4
CanBk
Neutral
194
-
-
0.3
0.2
2.8
12.0
0.6
11.2
IDBI#
Neutral
59
-
-
0.4
0.5
4.1
61.6
0.6
9.3
DenaBk
Neutral
36
-
-
0.3
0.4
3.6
45.6
0.4
7.9
Source: Company, Angel Research; Note:*Target multiples=SOTP Target Price/ABV (including subsidiaries), #Without adjusting for SASF
Company Background
ICICI Bank is India's largest private sector bank, with more than 5% market share
in credit. The bank has a pan-India extensive network of 4,156 branches and
around 13,372 ATMs. The bank has a large overseas presence (overseas loans
comprise ~23% of total loans). The bank also has market-leading subsidiaries in
life insurance, general insurance and asset management segments.
January 29, 2016
7
ICICI Bank | 3QFY2016 Result Update
Income statement (Standalone)
Y/E March (` cr)
FY12
FY13
FY14
FY15
FY16E
FY17E
Net Interest Income
10,734
13,866
16,476
19,040
21,824
25,222
- YoY Growth (%)
19.0
29.2
18.8
15.6
14.6
15.6
Other Income
7,503
8,346
10,428
12,064
13,344
15,295
- YoY Growth (%)
12.9
11.2
24.9
15.7
10.6
14.6
Operating Income
18,237
22,212
26,903
31,104
35,168
40,517
- YoY Growth (%)
16.4
21.8
21.1
15.6
13.1
15.2
Operating Expenses
7,850
9,013
10,309
11,496
12,933
14,988
- YoY Growth (%)
18.6
14.8
14.4
11.5
12.5
15.9
Pre - Provision Profit
10,386
13,199
16,595
19,608
22,235
25,529
- YoY Growth (%)
14.8
27.1
25.7
18.2
13.4
14.8
Prov. & Cont.
1,589
1,810
2,631
3,927
4,531
4,724
- YoY Growth (%)
(30.6)
13.9
45.4
49.2
15.4
4.2
Profit Before Tax
8,797
11,390
13,963
15,681
17,704
20,805
- YoY Growth (%)
30.2
29.5
22.6
12.3
12.9
17.5
Prov. for Taxation
2,332
3,064
4,153
4,636
5,225
6,125
- as a % of PBT
26.5
26.9
29.7
29.6
29.5
29.4
PAT
6,465
8,325
9,810
11,045
12,479
14,680
- YoY Growth (%)
25.5
28.8
17.8
12.6
13.0
17.6
Balance sheet (Standalone)
Y/E March (` cr)
FY12
FY13
FY14
FY15
FY16E
FY17E
Share Capital
1,503
1,504
1,505
1,517
1,517
1,517
- Equity
1,153
1,154
1,155
1,167
1,167
1,167
- Preference
350
350
350
350
350
350
Reserve & Surplus
59,252
65,552
72,052
79,107
87,837
98,134
Deposits
2,55,500
2,92,614
3,31,914
3,61,563
4,19,413
4,94,907
- Growth (%)
13.3
14.5
13.4
8.9
16.0
18.0
Borrowings
1,02,200
1,05,329
1,14,224
1,31,467
1,45,170
1,62,894
Tier 2 Capital
37,615
39,662
40,185
40,600.0
39,585
38,595
Other Liab. & Prov.
17,577
21,307
34,762
31,875
35,926
41,302
Total Liabilities
4,73,647
5,25,968
5,94,642
6,46,129
7,29,448
8,37,349
Cash Balances
20,461
19,053
21,822
25,653
20,971
24,745
Bank Balances
15,768
22,365
19,708
16,652
21,508
24,745
Investments
1,59,560
1,71,394
1,77,022
1,86,583
2,03,977
2,19,093
Advances
2,53,728
2,90,249
3,38,703
3,87,522
4,49,526
5,30,440
- Growth (%)
17.3
14.4
16.7
14.4
16.0
18.0
Fixed Assets
4,615
4,647
4,678
4,723
5,183
5,784
Other Assets
19,515
18,261
32,709
24,997
28,284
32,541
Total Assets
4,73,647
5,25,968
5,94,642
6,46,129
7,29,448
8,37,349
- Growth (%)
17.1
11.4
13.4
8.8
13.1
15.1
January 29, 2016
8
ICICI Bank | 3QFY2016 Result Update
Ratio analysis (Standalone)
Y/E March
FY12
FY13
FY14
FY15
FY16E
FY17E
Profitability ratios (%)
NIMs
2.7
3.0
3.2
3.3
3.4
3.4
Cost to Income Ratio
43.0
40.6
38.3
37.0
36.8
37.0
RoA
1.3
1.5
1.6
1.6
1.6
1.6
RoE
12.8
14.7
14.9
14.8
14.7
15.2
B/S ratios (%)
CASA Ratio
43.5
41.9
42.9
45.5
45.9
46.2
Credit/Deposit Ratio
99.3
99.2
102.0
107.2
107.2
107.2
CAR
18.5
18.7
17.7
17.6
16.4
15.1
- Tier I
12.7
12.8
12.8
12.6
12.2
11.6
Asset Quality (%)
Gross NPAs
3.6
3.2
3.0
3.8
4.7
4.8
Net NPAs
0.7
0.8
1.0
1.6
1.9
1.7
Slippages
1.3
1.4
1.5
2.3
2.5
1.9
Loan Loss Prov. /Avg. Assets
0.2
0.3
0.4
0.5
0.6
0.5
Provision Coverage
80.4
76.8
68.6
62.5
62.5
67.5
Per Share Data (`)
EPS
11.2
14.4
17.0
18.9
21.4
25.2
ABVPS (75% cover.)
104.8
115.6
120.9
116.7
124.9
149.8
DPS
3.3
4.0
4.5
6.3
5.9
6.9
Valuation Ratios
PER (x)
24.7
19.2
16.3
14.6
13.0
11.0
P/ABVPS (x)
2.6
2.4
2.3
2.4
2.2
1.8
Dividend Yield
1.2
1.4
1.6
2.3
2.1
2.5
DuPont Analysis
NII
2.5
2.8
3.0
3.1
3.2
3.3
(-) Prov. Exp.
0.4
0.4
0.5
0.6
0.7
0.6
Adj. NII
2.1
2.5
2.5
2.5
2.6
2.7
Treasury
(0.0)
0.1
0.1
0.2
0.2
0.2
Int. Sens. Inc.
2.1
2.6
2.7
2.7
2.8
2.9
Other Inc.
1.6
1.4
1.5
1.5
1.5
1.5
Op. Inc.
3.7
4.0
4.2
4.2
4.3
4.4
Opex
1.8
1.9
1.9
1.9
1.9
1.9
PBT
1.9
2.2
2.3
2.3
2.3
2.4
Taxes
0.5
0.6
0.8
0.8
0.8
0.8
RoA
1.3
1.5
1.6
1.6
1.6
1.6
Leverage
9.6
9.6
9.6
9.5
9.4
9.4
RoE
12.8
14.7
14.9
14.8
14.7
15.2
January 29, 2016
9
ICICI Bank | 3QFY2016 Result Update
Research Team Tel: 022 - 39357800
DISCLAIMER
Angel Broking Private Limited (hereinafter referred to as “Angel”) is a registered Member of National Stock Exchange of India Limited,
Bombay Stock Exchange Limited and Metropolitan Stock Exchange of India Limited. It is also registered as a Depository Participant with
CDSL and Portfolio Manager with SEBI. It also has registration with AMFI as a Mutual Fund Distributor. Angel Broking Private Limited is
a registered entity with SEBI for Research Analyst in terms of SEBI (Research Analyst) Regulations, 2014 vide registration number
INH000000164. Angel or its associates has not been debarred/ suspended by SEBI or any other regulatory authority for accessing
/dealing in securities Market. Angel or its associates including its relatives/analyst do not hold any financial interest/beneficial
ownership of more than 1% in the company covered by Analyst. Angel or its associates/analyst has not received any compensation /
managed or co-managed public offering of securities of the company covered by Analyst during the past twelve months. Angel/analyst
has not served as an officer, director or employee of company covered by Analyst and has not been engaged in market making activity
of the company covered by Analyst.
This document is solely for the personal information of the recipient, and must not be singularly used as the basis of any investment
decision. Nothing in this document should be construed as investment or financial advice. Each recipient of this document should
make such investigations as they deem necessary to arrive at an independent evaluation of an investment in the securities of the
companies referred to in this document (including the merits and risks involved), and should consult their own advisors to determine
the merits and risks of such an investment.
Reports based on technical and derivative analysis center on studying charts of a stock's price movement, outstanding positions and
trading volume, as opposed to focusing on a company's fundamentals and, as such, may not match with a report on a company's
fundamentals.
The information in this document has been printed on the basis of publicly available information, internal data and other reliable
sources believed to be true, but we do not represent that it is accurate or complete and it should not be relied on as such, as this
document is for general guidance only. Angel Broking Pvt. Limited or any of its affiliates/ group companies shall not be in any way
responsible for any loss or damage that may arise to any person from any inadvertent error in the information contained in this report.
Angel Broking Pvt. Limited has not independently verified all the information contained within this document. Accordingly, we cannot
testify, nor make any representation or warranty, express or implied, to the accuracy, contents or data contained within this document.
While Angel Broking Pvt. Limited endeavors to update on a reasonable basis the information discussed in this material, there may be
regulatory, compliance, or other reasons that prevent us from doing so.
This document is being supplied to you solely for your information, and its contents, information or data may not be reproduced,
redistributed or passed on, directly or indirectly.
Neither Angel Broking Pvt. Limited, nor its directors, employees or affiliates shall be liable for any loss or damage that may arise from
or in connection with the use of this information.
Note: Please refer to the important ‘Stock Holding Disclosure' report on the Angel website (Research Section). Also, please refer to the
latest update on respective stocks for the disclosure status in respect of those stocks. Angel Broking Pvt. Limited and its affiliates may
have investment positions in the stocks recommended in this report.
Disclosure of Interest Statement
ICICI Bank
1. Analyst ownership of the stock
No
2. Angel and its Group companies ownership of the stock
No
3. Angel and its Group companies' Directors ownership of the stock
No
4. Broking relationship with company covered
No
Note: We have not considered any Exposure below ` 1 lakh for Angel, its Group companies and Directors
Ratings (Based on expected returns
Buy (> 15%)
Accumulate (5% to 15%)
Neutral (-5 to 5%)
over 12 months investment period):
Reduce (-5% to -15%)
Sell (< -15)
January 29, 2016
10