2QFY2016 Result Update | Banking
November 3, 2015
ICICI Bank
BUY
CMP
`279
Performance Highlights
Target Price
`348
Particulars (` cr)
2QFY16 1QFY16
% chg (qoq) 2QFY15
% chg (yoy)
Investment Period
12 Months
NII
5,251
5,115
2.7
4,657
12.8
Pre-prov. profit
5,158
5,038
2.4
4,698
9.8
Stock Info
PAT
3,030
2,976
1.8
2,709
11.9
Sector
Banking
Source: Company, Angel Research
Market Cap (` cr)
1,62,215
ICICI Bank reported a decent set of number for 2QFY2016, with PAT growth of
Beta
1.5
11.9% yoy to `3,030cr (in-line with our expectation).
52 Week High / Low
393/248
Avg. Daily Volume
1,34,75,982
Healthy growth in retail advances
Face Value (`)
2
During 2QFY2016, the bank’s advances grew by 13.3% yoy (2.5% qoq), aided by
BSE Sensex
26,559
healthy retail loan book growth of 25.2% yoy. The main drivers leading to the
Nifty
8,051
growth in the retail loan book were Personal loans and Home loans, which grew
Reuters Code
ICBK.NS
Bloomberg Code
ICICIBC@IN
by 56% and 25% yoy respectively. Retail contribution to total loans increased to
44.0% as compared to 39.8% in the corresponding quarter of the previous year.
The corporate book grew 7.2% yoy. Advances were made mainly towards working
Shareholding Pattern (%)
capital requirements while some of the incremental lending was done to PSU
Promoters
NA
companies and other better rated companies.
MF / Banks / Indian Fls
23.7
Deposits growth was modest at 9.2% yoy, while CASA deposits saw a moderate
FII / NRIs / OCBs
38.2
growth of 12.9% yoy, resulting in improvement in CASA ratio by 144bp yoy to
45.1%. The Reported NIM fell by 2bp qoq to 3.52%, with domestic NIM at 3.84%
Indian Public / Others
38.0
as compared to 3.90% in 1QFY2016. The non-interest income (excluding treasury)
for the bank grew 7.1% yoy.
On the asset quality front, the bank witnessed slippages during the quarter to the
Abs. (%)
3m 1yr
3yr
tune of `2,242cr (annualized slippage ratio at 2.3%) as compared to `1,672cr in
Sensex
(5.5)
(4.7)
41.6
the sequential previous quarter (annualized slippage ratio at 1.73%), with slippage
ICICI Bank
(7.7)
(14.1)
29.4
from restructuring at `931cr. The Gross NPA ratio increased 9bp sequentially to
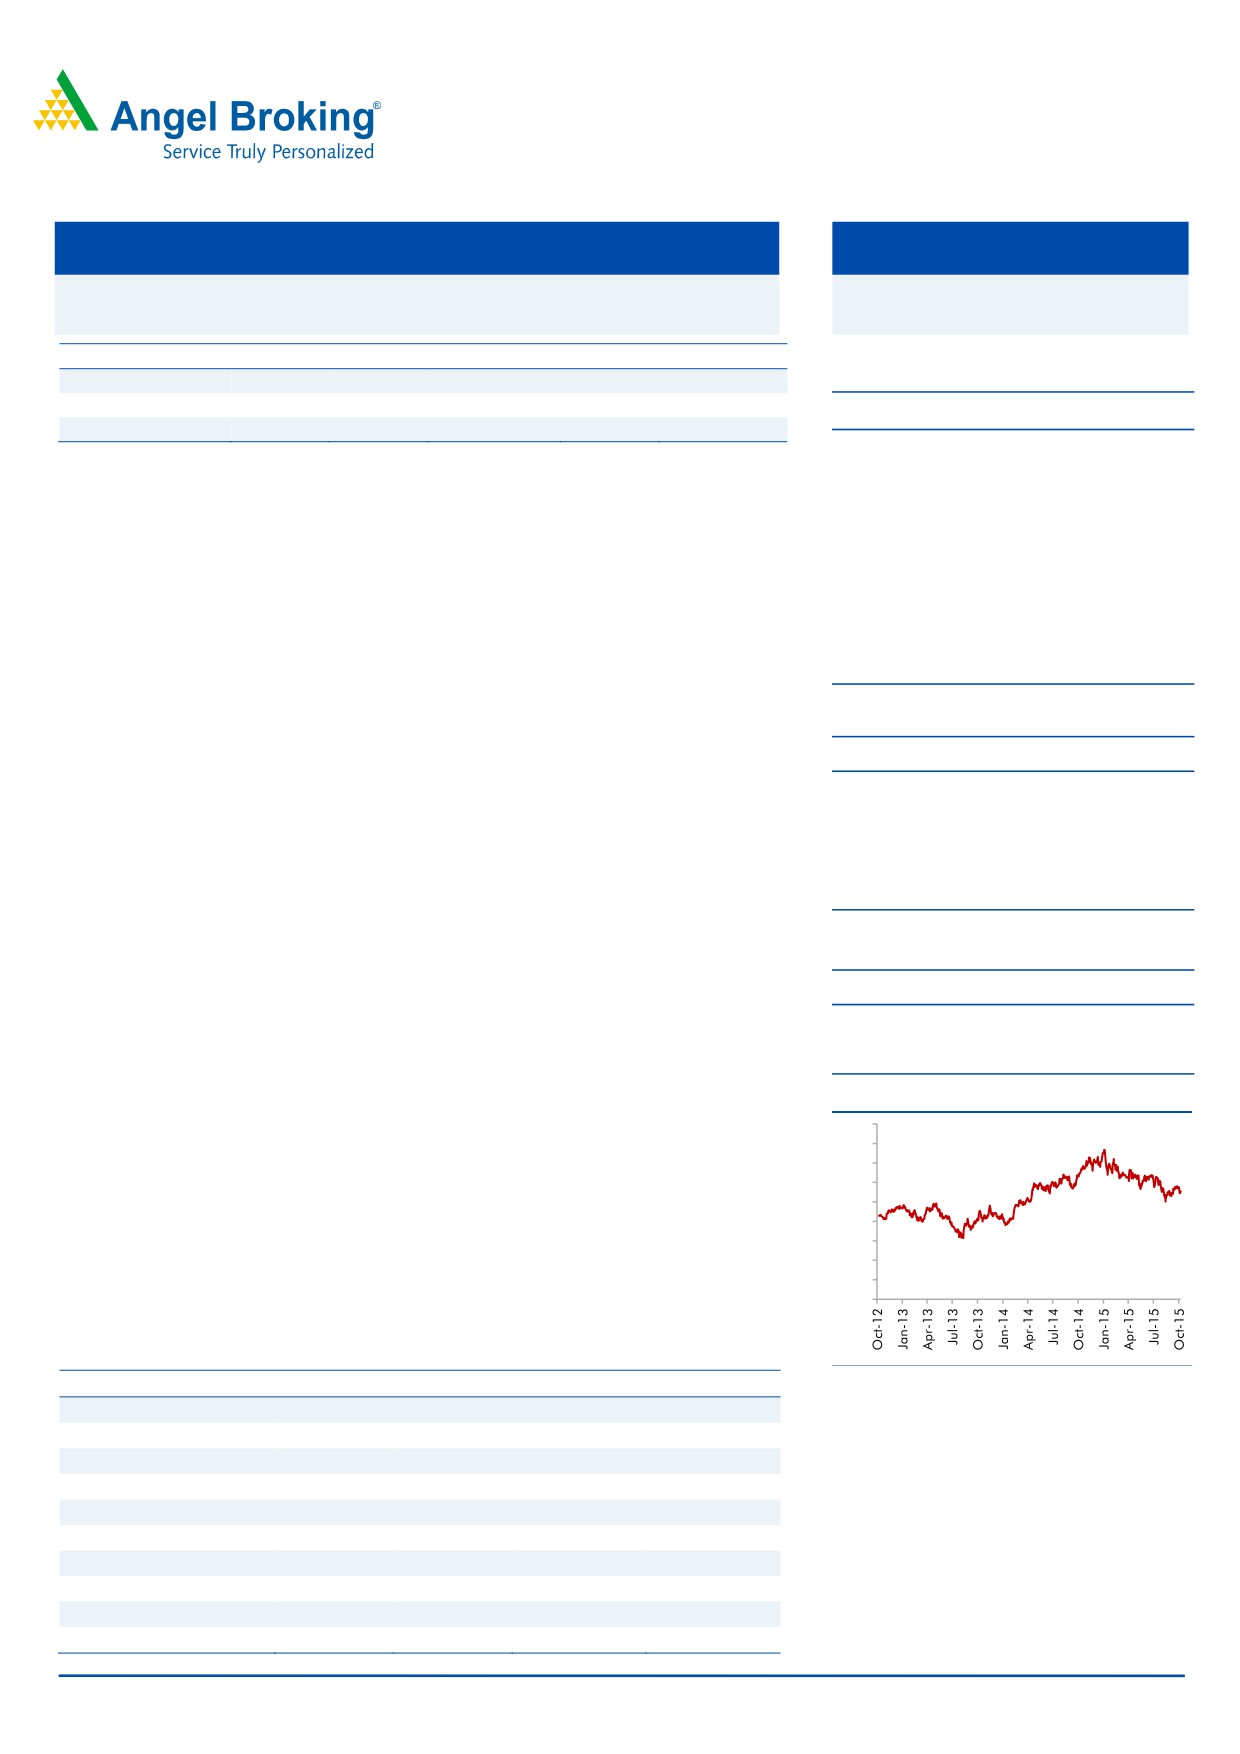
3-year price chart
3.77%, whereas the Net NPA rose 7bp qoq to1.65%. The bank refinanced
450
~`2,000cr under the 5:25 scheme. The Management has guided for lower
400
addition to NPA and restructuring in FY2016 as against FY2015.
350
300
250
Outlook and valuation: At the current market price, the bank’s core banking
200
business (after adjusting `58/share towards value of subsidiaries) is trading at 1.5x
150
FY2017E ABV. The valuation discount in our view vis-à-vis other private banks
100
50
adequately factors in the relatively higher stressed assets in the bank’s books. We
0
recommend a Buy rating on the stock, with a target price of `348.
Key financials (Standalone)
Source: Company, Angel Research
Y/E March (` cr)
FY2014
FY2015
FY2016E
FY2017E
NII
16,476
19,040
21,824
25,222
% chg
18.8
15.6
14.6
15.6
Net profit
9,810
11,045
12,479
14,680
% chg
17.8
12.6
13.0
17.6
Vaibhav Agrawal
NIM (%)
3.2
3.3
3.4
3.4
022 - 3935 7800 Ext: 6808
EPS (`)
17.0
18.9
21.4
25.2
P/E (x)
16.3
14.6
13.0
11.0
P/ABV (x)
2.3
2.4
2.2
1.8
Chintan Shah
RoA (%)
1.6
1.6
1.6
1.6
022 - 4000 3600 Ext: 6828
RoE (%)
14.9
14.8
14.7
15.2
Source: Company, Angel Research; Note: CMP as of November 2, 2015
Please refer to important disclosures at the end of this report
1
ICICI Bank | 2QFY2016 Result Update
Exhibit 1: 2QFY2016 performance (Standalone)
Particulars (` cr)
2QFY16
1QFY16
% chg (qoq)
2QFY15
% chg (yoy)
FY2015
FY2014
% chg
Interest earned
13,099
12,813
2.2
12,151
7.8
49,091
44,178
11.1
- on Advances / Bills
9,665
9,375
3.1
8,874
8.9
35,631
31,428
13.4
- on investments
2,661
2,659
0.1
2,972
(10.5)
11,945
11,557
3.4
- on balance with RBI & others
31
32
(0.2)
54
(41.5)
195
200
(2.4)
- on others
741
747
(0.7)
251
195.9
1,320
993
32.9
Interest Expended
7,847
7,697
1.9
7,494
4.7
30,052
27,703
8.5
Net Interest Income
5,251
5,115
2.7
4,657
12.8
19,040
16,476
15.6
Other income
3,007
2,990
0.6
2,738
9.8
12,176
10,428
16.8
Other income excl. treasury
2,785
2,783
0.1
2,601
7.1
10,482
9,412
11.4
- Fee income
2,235
2,110
5.9
2,103
6.3
8,286
7,758
6.8
- Treasury income
222
207
7.2
137
62.0
1,694
1,016
66.7
- Others
550
673
(18.3)
498
10.4
2,196
1,654
32.8
Operating income
8,259
8,105
1.9
7,395
11.7
31,216
26,903
16.0
Operating expenses
3,100
3,067
1.1
2,697
15.0
11,496
10,309
11.5
- Employee expenses
1,213
1,267
(4.3)
1,086
11.6
4,750
4,220
12.6
- Other Opex
1,888
1,800
4.9
1,611
17.2
6,746
6,089
10.8
Pre-provision Profit
5,158
5,038
2.4
4,698
9.8
19,720
16,595
18.8
Provisions & Contingencies
942
955
(1.4)
849
10.9
3,900
2,626
48.5
PBT
4,216
4,082
3.3
3,848
9.6
15,820
13,968
13.3
Provision for Tax
1,186
1,106
7.2
1,139
4.1
4,645
4,158
11.7
PAT
3,030
2,976
1.8
2,709
11.9
11,175
9,810
13.9
Effective Tax Rate (%)
28.1
27.1
103bp
29.6
(147)bp
29.4
29.8
(41)bp
Source: Company, Angel Research
November 3, 2015
2
ICICI Bank | 2QFY2016 Result Update
Exhibit 2: 2QFY2016 performance analysis (Standalone)
Particulars
2QFY16 1QFY16
% chg (qoq) 2QFY15
% chg (yoy)
Balance sheet
Advances (` cr)
4,09,693
3,99,738
2.5
3,61,757
13.3
Deposits (` cr)
3,84,618
3,67,877
4.6
3,52,055
9.2
Credit-to-Deposit Ratio (%)
106.5
108.7
(214)bp
102.8
376bp
Current deposits (` cr)
49,504
45,549
8.7
48,118
2.9
Saving deposits (` cr)
1,23,985
1,16,765
6.2
1,05,607
17.4
CASA deposits (` cr)
1,73,489
1,62,314
6.9
1,53,725
12.9
CASA ratio (%)
45.1
44.1
99bp
43.7
144bp
CAR (%)
16.2
16.4
(22)bp
17.4
(126)bp
Tier 1 CAR (%)
12.1
12.6
(55)bp
12.8
(66)bp
Profitability Ratios (%)
Reported NIM
3.52
3.54
(2)bp
3.42
10bp
Cost-to-income ratio
37.5
37.8
(30)bp
36.5
107bp
Asset quality
Gross NPAs (` cr)
15,858
15,138
4.8
11,547
37.3
Gross NPAs (%)
3.8
3.7
9bp
3.1
65bp
Net NPAs (` cr)
6,828
6,333
7.8
3,942
73.2
Net NPAs (%)
1.7
1.6
7bp
1.1
56bp
Provision Coverage Ratio (%)
57.4
58.2
(80)bp
65.9
(850)bp
Slippage ratio (%)
2.3
2.0
34bp
2.0
34bps
Provision exps. to avg. adv (%)
0.6
0.6
(1)bp
0.6
1bp
Source: Company, Angel Research
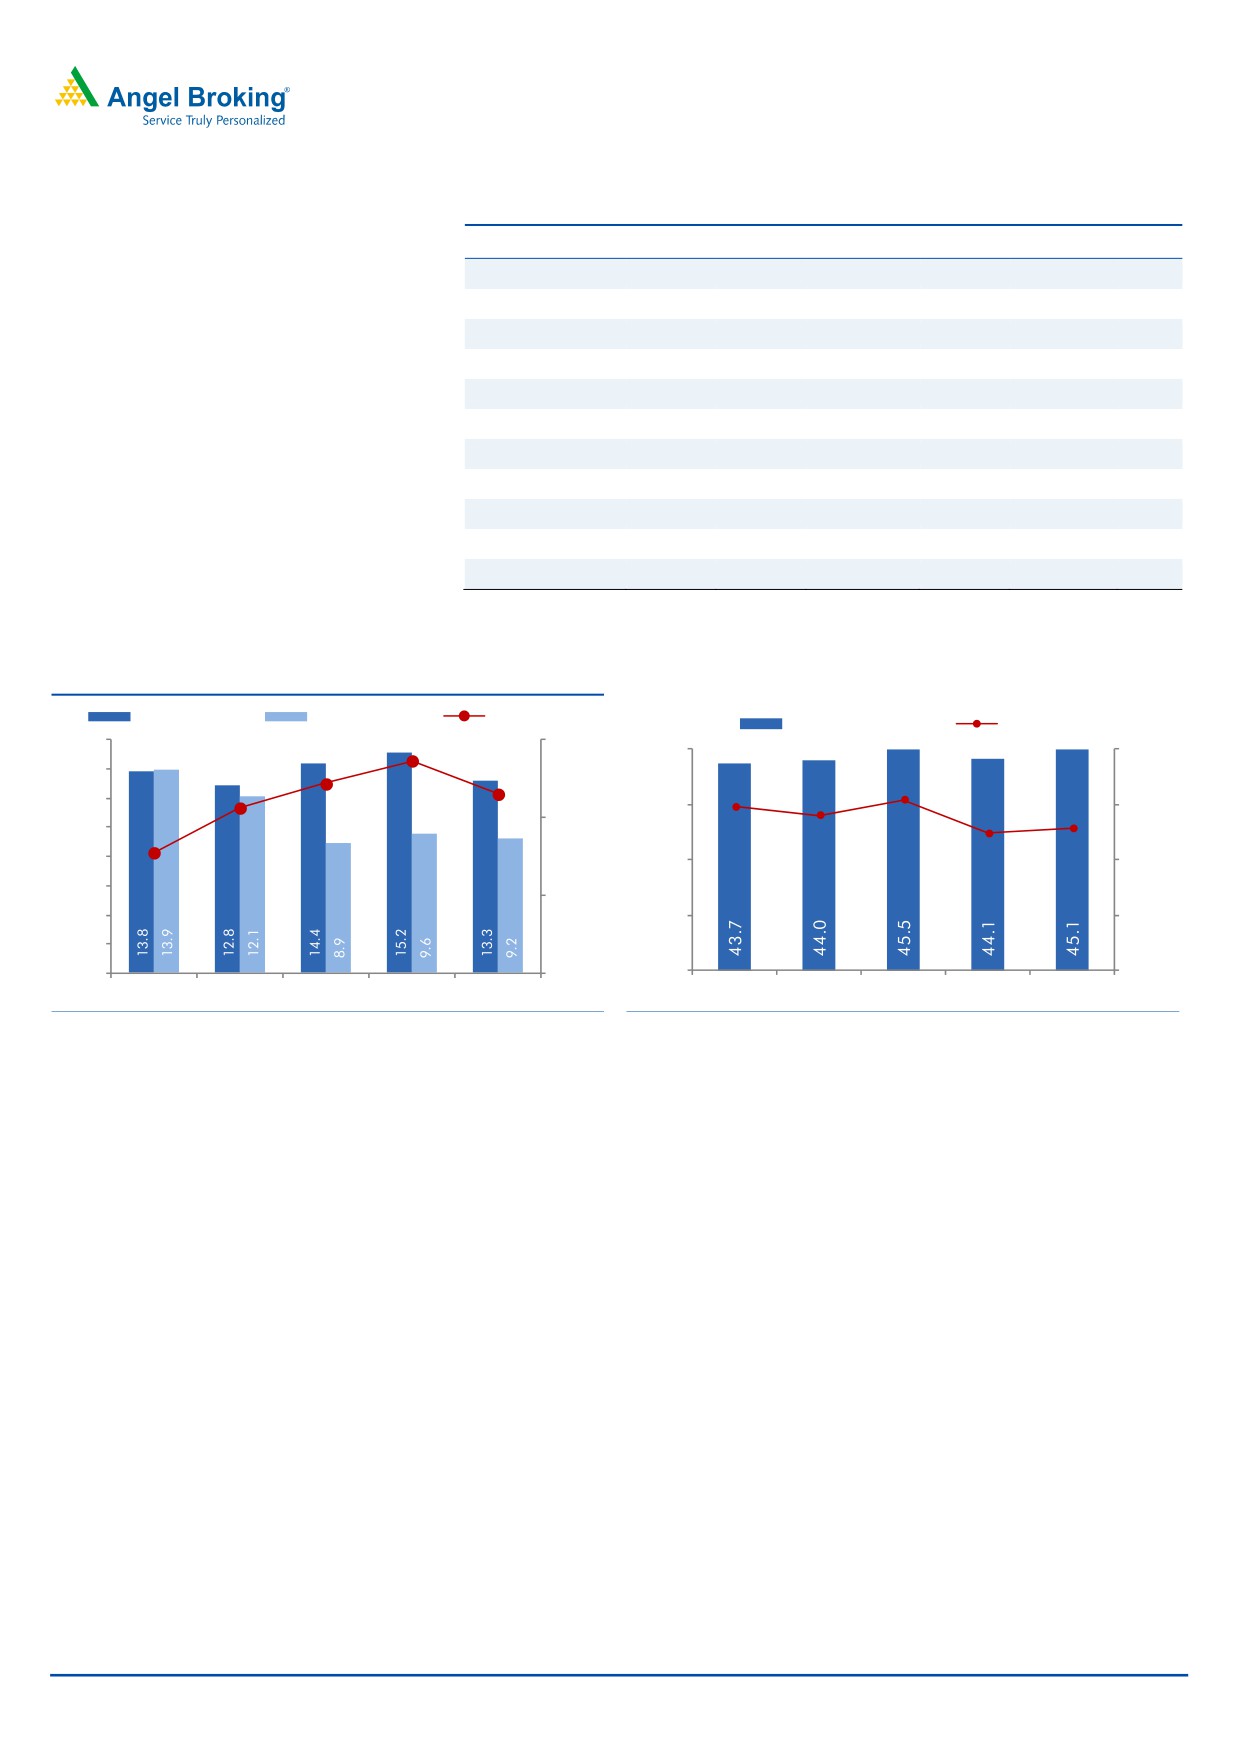
Retail drives healthy loan growth
During 2QFY2016, the bank’s advances grew by 13.3% yoy (2.5% qoq), aided by
healthy retail loan book growth of 25.2% yoy. The main drivers leading to the
growth in the retail loan book were Personal loans and Home loans which grew by
56% and 25% yoy, respectively. Retail contribution to total loans increased to
44.0% as compared to 39.8% in the corresponding quarter of the previous year.
The corporate book grew 7.2% yoy, where advances were mainly towards working
capital requirements while some of the incremental lending was done to PSU
companies and other better rated companies.
Deposits growth was modest at 9.2% yoy, while CASA deposits saw a moderate
growth of 12.9% yoy, resulting in improvement in CASA ratio by 144bp yoy to
45.1% as of 2QFY2016. The bank is well placed in terms of capital required to
support its growth. Given its current capital position, the bank is of the view that
the bank does not need to raise further capital till March 2018.
November 3, 2015
3
ICICI Bank | 2QFY2016 Result Update
Exhibit 3: Strong Retail lending supports Loan Growth
Particulars (` cr)
2QFY16
1QFY16
% chg (qoq) 2QFY15
% chg (yoy) % total
Domestic Corporate
1,16,353
1,14,725
1.4
1,08,527
7.2
28.4
Overseas branches
95,458
96,737
(1.3)
92,972
2.7
23.3
SME
17,617
17,189
2.5
16,279
8.2
4.3
Retail Total
1,80,265
1,71,088
5.4
1,43,979
25.2
44.0
-Home
99,326
93,927
5.7
79,189
25.4
55.1
-Vehicle loans
32,267
30,625
5.4
27,788
16.1
17.9
-Others
25,778
25,663
0.4
19,725
30.7
14.3
-Banking business
10,095
9,239
9.3
8,351
20.9
5.6
-Credit cards
4,507
4,106
9.8
3,599
25.2
2.5
-Personal loans
8,292
7,528
10.2
5,327
55.7
4.6
Total advances
4,09,693
3,99,738
2.5
3,61,757
13.3
100.0
Source: Company, Angel Research
Exhibit 4: Retail segment supports Advances growth
Exhibit 5: CASA ratio rises, CASA deposits up 12.9% yoy
Adv. yoy growth
Dep. yoy growth
CDR (%, RHS)
CASA ratio (%)
yoy Growth
16.0
108.7
110.0
45.0
20.0
107.2
14.0
106.5
15.5
105.6
14.8
12.0
14.1
40.0
12.9
15.0
12.4
105.0
10.0
102.8
8.0
35.0
10.0
6.0
100.0
4.0
30.0
5.0
2.0
-
95.0
25.0
-
2QFY15
3QFY15
4QFY15
1QFY16
2QFY16
2QFY15
3QFY15
4QFY15
1QFY16
2QFY16
Source: Company, Angel Research
Source: Company, Angel Research
NIM decreases qoq
The Reported NIM fell by 2bp qoq to 3.52%, with domestic NIM at 3.84% as
compared to 3.90% in 1QFY2016. The non-interest income (excluding treasury)
for the bank grew 7.1% yoy.
Decrease in domestic NIM was mainly on account of reduction in base rate during
the quarter by 5bp which was cushioned to an extent by increase in International
NIM to 2% in 1QFY2016 compared to 1.88% in 1QFY2016 and also decline in
the cost of funds by 10bp qoq to 5.93%.
The bank has further reduced its base rate by 35 basis points effective October 5,
2015 to 9.35%. Hence the net interest margins in the third quarter of 2016 could
decline; but the Management continues to target to maintain overall net interest
margin for FY2016 at a similar level compared to FY2015 in spite of declining
interest rates.
November 3, 2015
4
ICICI Bank | 2QFY2016 Result Update
Exhibit 6: NIM dips marginally by 2bp on qoq basis
Exhibit 7: NII growth trends
NIM (Reported, %)
NII (` cr)
YoY growth (%, RHS)
3.57
5,600
18.0
3.54
3.52
3.46
5,300
3.42
16.0
3.50
5,000
16.6
14.0
4,700
15.2
4,400
13.9
12.0
13.1
12.8
3.00
4,100
10.0
3,800
8.0
3,500
3,200
6.0
2.50
2,900
4.0
2,600
2.0
2,300
2.00
2,000
-
2QFY15
3QFY15
4QFY15
1QFY16
2QFY16
2QFY15
3QFY15
4QFY15
1QFY16
2QFY16
Source: Company, Angel Research
Source: Company, Angel Research
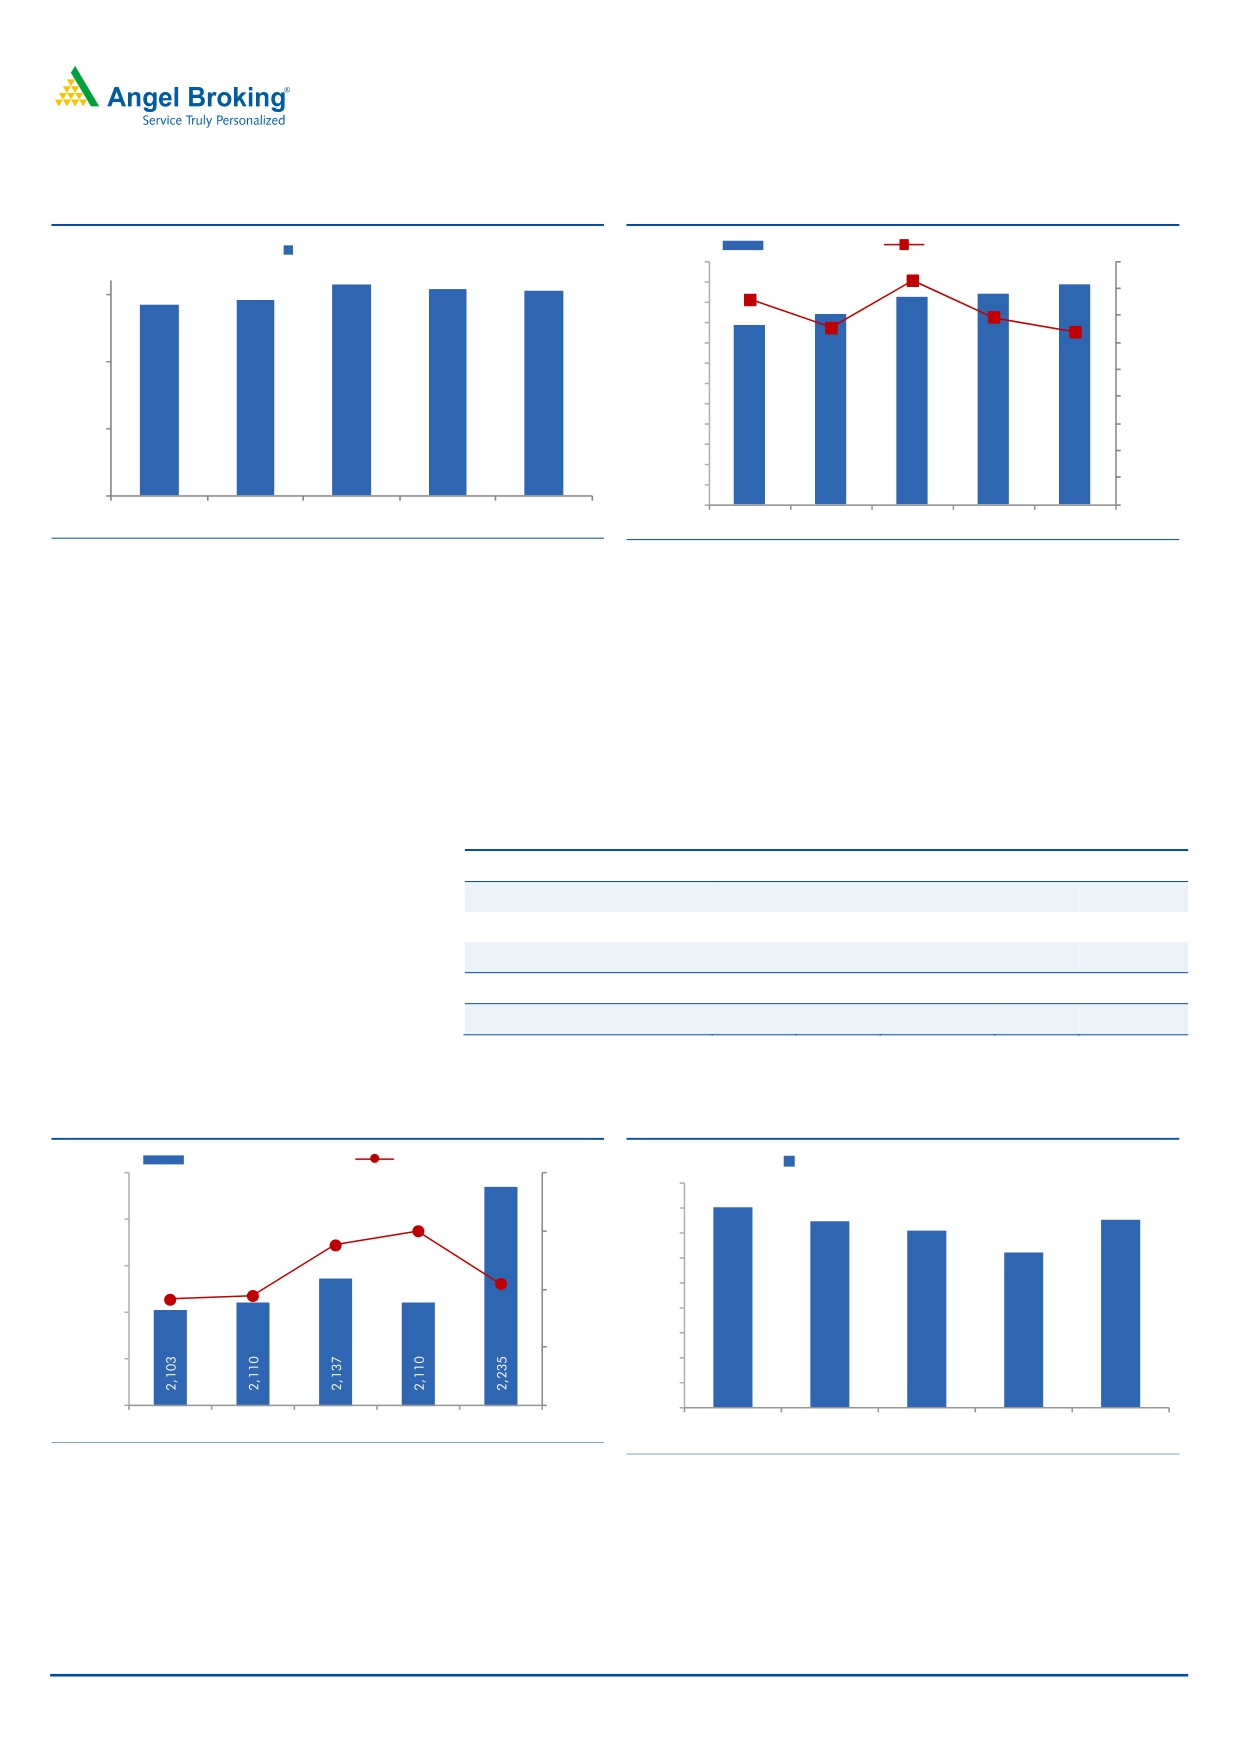
Soft growth in fee income
The non-interest income (excluding treasury) for the bank grew 7.1% yoy. Treasury
income grew by 62.0% yoy, leading to a 9.8% yoy growth in overall other income.
While retail fees continued to grow at a healthy rate, the growth in overall fee
remains impacted by subdued corporate activity and consequent decline in
corporate fee income. Retail fees for the bank constituted about 65% of the overall
fees for the quarter.
Exhibit 8: ‘Treasury Income’ aides non-interest income performance
Particulars (` cr)
2QFY16 1QFY16
% chg (qoq) 2QFY15
% chg (yoy)
Fee income
2,235
2,110
5.9
2,103
6.3
Treasury
222
207
7.2
137
62.0
Others
550
673
(18.3)
498
10.4
Non-interest income
3,007
2,990
0.6
2,738
9.8
Non-int. income excl. treasury
2,785
2,783
0.1
2,601
7.1
Source: Company, Angel Research
Exhibit 9: Fee income growth at 6.3% yoy
Exhibit 10: Healthy share of fee income
Fee Income (` cr)
yoy growth (%, RHS)
Fee income to average assets (%)
2,250
12.0
1.5
1.4
1.4
1.4
8.3
9.0
1.4
2,200
1.4
9.0
1.4
1.3
6.3
1.3
5.5
2,150
5.7
1.3
6.0
2,100
1.2
1.2
3.0
2,050
1.1
1.1
2,000
-
1.0
2QFY15
3QFY15
4QFY15
1QFY16
2QFY16
2QFY15
3QFY15
4QFY15
1QFY16
2QFY16
Source: Company, Angel Research
Source: Company, Angel Research
November 3, 2015
5
ICICI Bank | 2QFY2016 Result Update
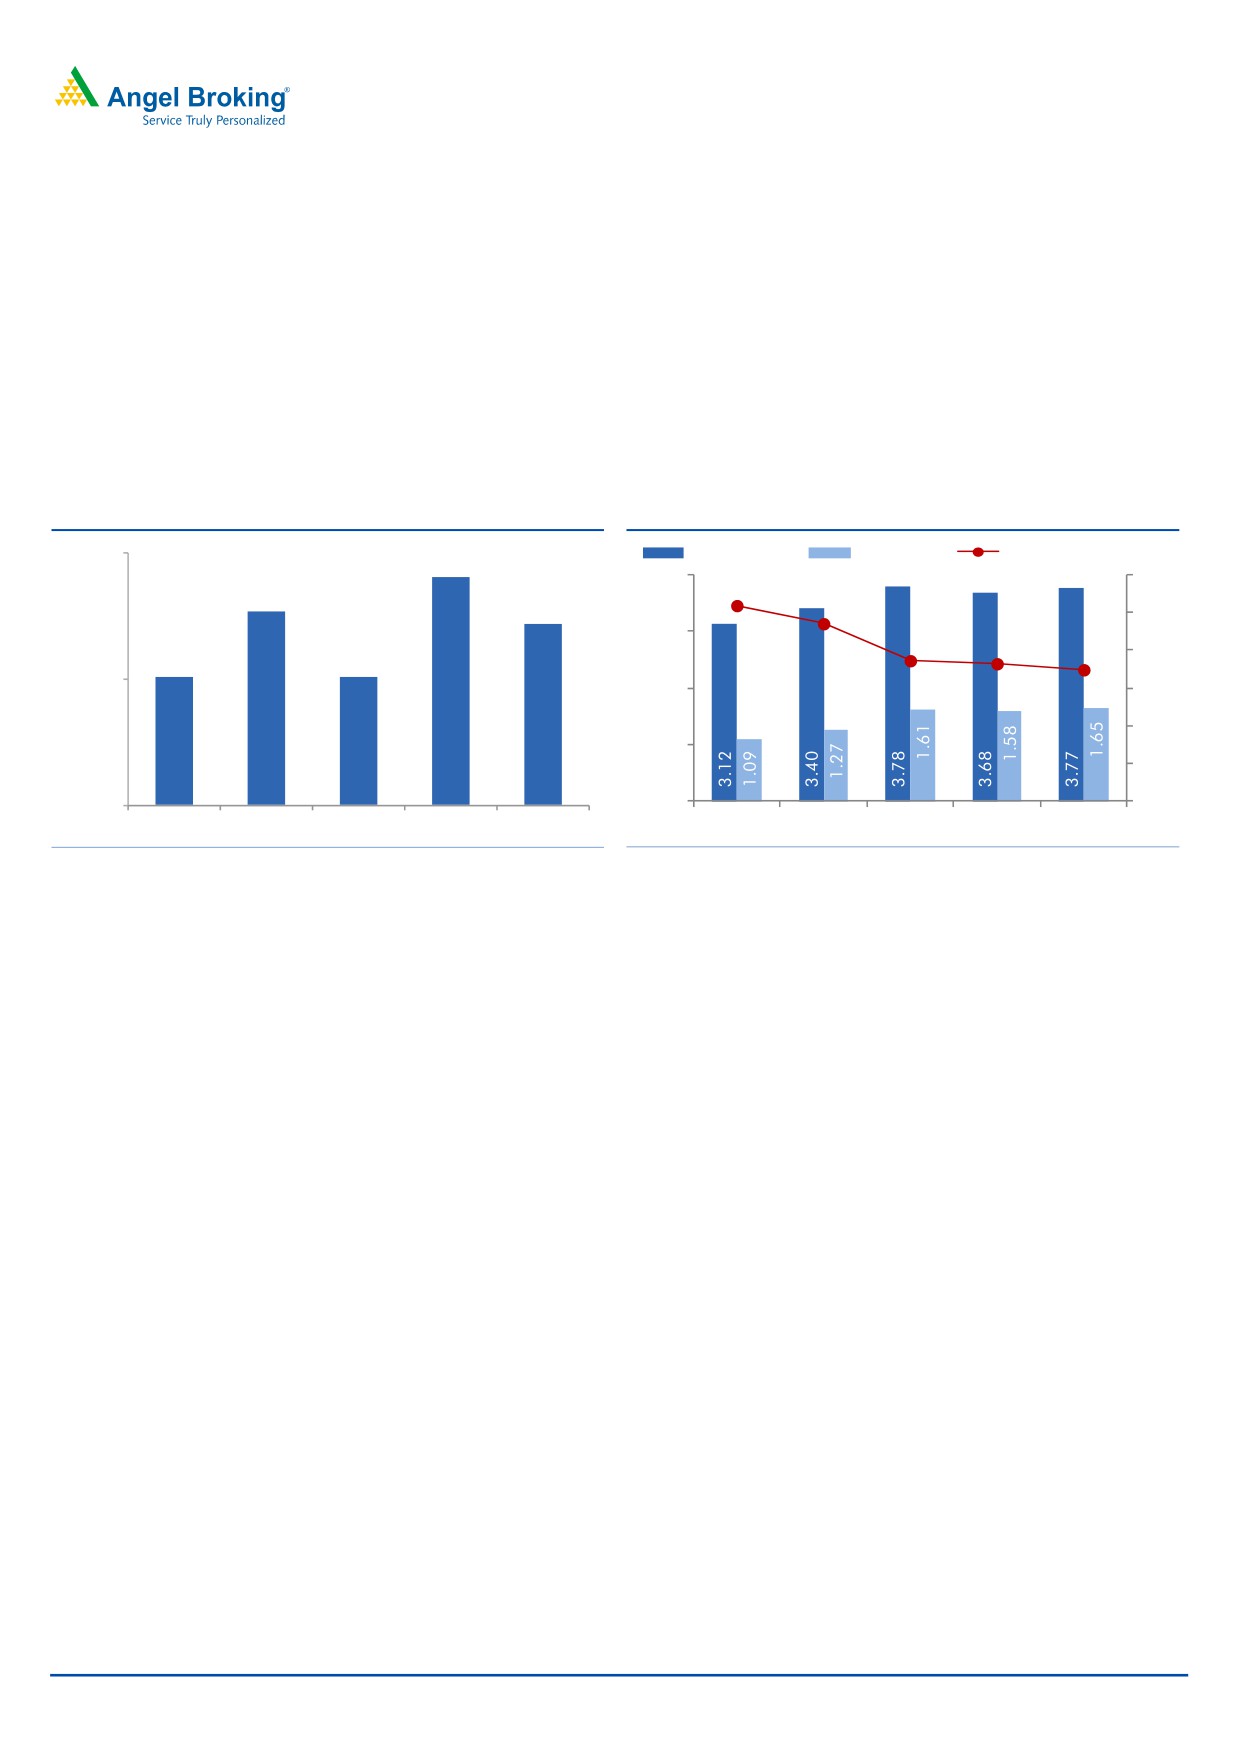
Slippages rise qoq, but Management outlook unchanged on
asset quality
On the asset quality front, the bank witnessed slippages during the quarter to the
tune of `2,242cr (annualized slippage ratio at 2.3%) as compared to `1,672cr in
sequential previous quarter (annualized slippage ratio at 1.73%), with slippage
from restructuring at `931cr. The Gross NPA ratio rose 9bp sequentially to 3.77%,
whereas the Net NPA ratio rose 7bp qoq to1.65%. The bank refinanced
~`2,000cr under the 5:25 scheme. The Management has guided for lower
addition to NPA and restructuring in FY2016 as against FY2015.
Exhibit 11: O/s Restructured book declines qoq
Exhibit 12: Asset quality during the quarter
13,000
Gross NPAs (%)
Net NPAs (%)
Coverage ratio (%, RHS)
(` cr)
12,604
4.00
70.0
65.9
12,052
63.5
11,868
65.0
3.00
58.6
58.2
57.4
60.0
11,020
11,017
11,000
2.00
55.0
50.0
1.00
45.0
9,000
-
40.0
2QFY15
3QFY15
4QFY15
1QFY16
2QFY16
2QFY15
3QFY15
4QFY15
1QFY16
2QFY16
Source: Company, Angel Research
Source: Company, Angel Research
Overview of performance of subsidiaries
ICICI Bank’s consolidated net profit for 2QFY2016 rose by 11.5% yoy to
`3,419cr. The consolidated reported RoE came in at 15.3% for 2QFY2016 as
compared to 15.1% in 2QFY2015.
ICICI Bank’s overseas subsidiary, ICICI Bank UK witnessed an earnings
decline of around 88.2% yoy for 2QFY2016. The lower profits in the second
quarter of fiscal 2016 were on account of higher provisions on existing
impaired loans while ICICI Bank Canada’s earnings dipped by 28.3% yoy.
ICICI Prudential AMC reported a PAT of `84cr for 2QFY2016 as compared to
a PAT of `62cr for 2QFY2015.
ICICI Lombard General Insurance reported a PAT of `143cr for 2QFY2016,
as against `158cr in 2QFY2015 whereas ICICI Home Finance reported a PAT
of `48.9cr for 2QFY2016 as against a PAT of `48.1cr in 2QFY2015. Earnings
for ICICI Securities came in at `60cr for 2QFY2016.
November 3, 2015
6
ICICI Bank | 2QFY2016 Result Update
Exhibit 13: Performance of subsidiaries
Subsidiary
Parameter
2QFY16
2QFY15
% chg
FY2015
FY2014
% chg
ICICI Bank UK
PAT (USD mn)
0.6
5.1
(88.2)
18.3
25.2
(27.4)
ICICI Bank Canada
PAT (CAD mn)
6.6
9.2
(28.3)
33.7
48.3
(30.2)
ICICI Home Finance
PAT (` cr)
49
48
1.6
198.0
223.0
(11.2)
ICICI Prudential Life Insurance
APE (` cr)
1,325
1,197
10.7
4,744.0
3,444.0
37.7
NBP (` cr)
183
130
40.8
532.0
427.0
24.6
NBP margin (%)
14
11
26.6
11
12
-
AuM (` cr)
99,127
90,726
9.3
1,00,183
80,597
24.3
ICICI Lombard General Insurance
Gross Premium (` cr)
1,999
1,638
22.0
6,914
7,134
(3.1)
PAT (` cr)
143
158
(9.5)
536
511
4.9
ICICI Securities
PAT (` cr)
60
68
(11.8)
294
91
223.1
ICICI Securities PD
PAT (` cr)
86
49
75.5
217
132
64.4
ICICI Venture
PAT (` cr)
(3)
(1)
200.0
1
33
(97.0)
ICICI Prudential AMC
PAT (` cr)
84
62
35.5
247
183
35.0
Source: Company, Angel Research
Outlook and Valuation
At the current market price, the bank’s core banking business (after adjusting
`58/share towards value of subsidiaries) is trading at 1.5x FY2017E ABV. The
valuation discount, in our view, vis-à-vis other private banks adequately factors in
the relatively higher stressed assets in the bank’s books in the near term. We
recommend a Buy rating on the stock, with a target price of `348.
Exhibit 14: SOTP valuation summary
Particulars
Target multiple
Value/share (`)
ICICI Bank
2.0x FY2017E ABV
289
Life Insurance
25.0x FY2017E NBP
24
General Insurance
32x FY2014 PAT
17
Others (Home Fin, AMC, VC, Securities
18
PD and Overseas subsidiaries)
SOTP value
348
Source: Angel Research
Exhibit 15:
Source: Company, Angel Research; Note:*Target multiples=SOTP Target Price/ABV (including subsidiaries), #Without adjusting for SASF
November 3, 2015
7
ICICI Bank | 2QFY2016 Result Update
Exhibit 16: Recommendation summary
CMP
Tgt. Price
Upside
FY2017E
FY2017E
FY2017E
FY15-17E
FY2017E
FY2017E
Company
Reco.
(`)
(`)
(%)
P/ABV (x)
Tgt. P/ABV (x)
P/E (x)
EPS CAGR (%)
RoA (%)
RoE (%)
HDFCBk
Buy
1,083
1,262
16.5
3.3
3.8
17.7
22.4
1.9
19.7
ICICIBk*
Buy
279
348
24.5
1.9
2.0
11.1
15.3
1.6
15.2
YesBk
Buy
770
914
18.6
2.0
2.4
11.1
20.2
1.6
19.6
AxisBk
Buy
478
630
31.6
1.9
2.6
11.0
18.4
1.8
18.9
SBI*
Buy
237
295
24.4
1.1
1.2
9.7
17.8
0.7
12.8
FedBk
Neutral
55
-
-
1.0
1.0
8.8
3.1
1.0
11.9
SIB
Neutral
21
-
-
0.7
0.8
6.2
21.6
0.7
11.6
BOB
Neutral
162
-
-
0.8
0.8
6.5
27.1
0.7
12.1
PNB
Neutral
130
-
-
0.6
0.6
4.8
28.5
0.7
12.0
BOI
Neutral
133
-
-
0.3
1.0
4.0
14.0
0.3
7.6
IndBk
Neutral
133
-
-
0.4
0.4
4.4
19.4
0.7
9.3
Vijaya Bank
Neutral
36
-
-
0.5
0.5
5.4
14.1
0.4
8.8
OBC
Neutral
146
-
-
0.3
0.5
3.2
65.5
0.5
9.4
Allahabad Bank Neutral
76
-
-
0.3
0.3
3.0
53.5
0.6
10.9
UnionBk
Neutral
160
-
-
0.5
0.4
4.1
18.1
0.6
11.4
CanBk
Neutral
278
-
-
0.4
0.3
4.0
9.8
0.5
10.7
AllBk
Neutral
76
-
-
0.3
0.4
3.0
53.5
0.6
10.9
IDBI#
Neutral
86
-
-
0.6
0.6
6.0
61.6
0.6
9.3
Source: Company, Angel Research
Company Background
ICICI Bank is India's largest private sector bank, with more than 5% market share
in credit. The bank has a pan-India extensive network of 4,054 branches and
around 12,964 ATMs. The bank has a large overseas presence (overseas loans
comprise 23.3% of total loans). The bank also has market-leading subsidiaries in
life insurance, general insurance and asset management segments.
November 3, 2015
8
ICICI Bank | 2QFY2016 Result Update
Income statement (Standalone)
Y/E March (` cr)
FY12
FY13
FY14
FY15
FY16E
FY17E
Net Interest Income
10,734
13,866
16,476
19,040
21,824
25,222
- YoY Growth (%)
19.0
29.2
18.8
15.6
14.6
15.6
Other Income
7,503
8,346
10,428
12,064
13,344
15,295
- YoY Growth (%)
12.9
11.2
24.9
15.7
10.6
14.6
Operating Income
18,237
22,212
26,903
31,104
35,168
40,517
- YoY Growth (%)
16.4
21.8
21.1
15.6
13.1
15.2
Operating Expenses
7,850
9,013
10,309
11,496
12,933
14,988
- YoY Growth (%)
18.6
14.8
14.4
11.5
12.5
15.9
Pre - Provision Profit
10,386
13,199
16,595
19,608
22,235
25,529
- YoY Growth (%)
14.8
27.1
25.7
18.2
13.4
14.8
Prov. & Cont.
1,589
1,810
2,631
3,927
4,531
4,724
- YoY Growth (%)
(30.6)
13.9
45.4
49.2
15.4
4.2
Profit Before Tax
8,797
11,390
13,963
15,681
17,704
20,805
- YoY Growth (%)
30.2
29.5
22.6
12.3
12.9
17.5
Prov. for Taxation
2,332
3,064
4,153
4,636
5,225
6,125
- as a % of PBT
26.5
26.9
29.7
29.6
29.5
29.4
PAT
6,465
8,325
9,810
11,045
12,479
14,680
- YoY Growth (%)
25.5
28.8
17.8
12.6
13.0
17.6
Balance sheet (Standalone)
Y/E March (` cr)
FY12
FY13
FY14
FY15
FY16E
FY17E
Share Capital
1,503
1,504
1,505
1,517
1,517
1,517
- Equity
1,153
1,154
1,155
1,167
1,167
1,167
- Preference
350
350
350
350
350
350
Reserve & Surplus
59,252
65,552
72,052
79,107
87,837
98,134
Deposits
2,55,500
2,92,614
3,31,914
3,61,563
4,19,413
4,94,907
- Growth (%)
13.3
14.5
13.4
8.9
16.0
18.0
Borrowings
1,02,200
1,05,329
1,14,224
1,31,467
1,45,170
1,62,894
Tier 2 Capital
37,615
39,662
40,185
40,600.0
39,585
38,595
Other Liab. & Prov.
17,577
21,307
34,762
31,875
35,926
41,302
Total Liabilities
4,73,647
5,25,968
5,94,642
6,46,129
7,29,448
8,37,349
Cash Balances
20,461
19,053
21,822
25,653
20,971
24,745
Bank Balances
15,768
22,365
19,708
16,652
21,508
24,745
Investments
1,59,560
1,71,394
1,77,022
1,86,583
2,03,977
2,19,093
Advances
2,53,728
2,90,249
3,38,703
3,87,522
4,49,526
5,30,440
- Growth (%)
17.3
14.4
16.7
14.4
16.0
18.0
Fixed Assets
4,615
4,647
4,678
4,723
5,183
5,784
Other Assets
19,515
18,261
32,709
24,997
28,284
32,541
Total Assets
4,73,647
5,25,968
5,94,642
6,46,129
7,29,448
8,37,349
- Growth (%)
17.1
11.4
13.4
8.8
13.1
15.1
November 3, 2015
9
ICICI Bank | 2QFY2016 Result Update
Ratio analysis (Standalone)
Y/E March
FY12
FY13
FY14
FY15
FY16E
FY17E
Profitability ratios (%)
NIMs
2.7
3.0
3.2
3.3
3.4
3.4
Cost to Income Ratio
43.0
40.6
38.3
37.0
36.8
37.0
RoA
1.3
1.5
1.6
1.6
1.6
1.6
RoE
12.8
14.7
14.9
14.8
14.7
15.2
B/S ratios (%)
CASA Ratio
43.5
41.9
42.9
45.5
45.9
46.2
Credit/Deposit Ratio
99.3
99.2
102.0
107.2
107.2
107.2
CAR
18.5
18.7
17.7
17.6
16.4
15.1
- Tier I
12.7
12.8
12.8
12.6
12.2
11.6
Asset Quality (%)
Gross NPAs
3.6
3.2
3.0
3.8
4.7
4.8
Net NPAs
0.7
0.8
1.0
1.6
1.9
1.7
Slippages
1.3
1.4
1.5
2.3
2.5
1.9
Loan Loss Prov. /Avg. Assets
0.2
0.3
0.4
0.5
0.6
0.5
Provision Coverage
80.4
76.8
68.6
62.5
62.5
67.5
Per Share Data (`)
EPS
11.2
14.4
17.0
18.9
21.4
25.2
ABVPS (75% cover.)
104.8
115.6
120.9
116.7
124.9
149.8
DPS
3.3
4.0
4.5
6.3
5.9
6.9
Valuation Ratios
PER (x)
24.7
19.2
16.3
14.6
13.0
11.0
P/ABVPS (x)
2.6
2.4
2.3
2.4
2.2
1.8
Dividend Yield
1.2
1.4
1.6
2.3
2.1
2.5
DuPont Analysis
NII
2.5
2.8
3.0
3.1
3.2
3.3
(-) Prov. Exp.
0.4
0.4
0.5
0.6
0.7
0.6
Adj. NII
2.1
2.5
2.5
2.5
2.6
2.7
Treasury
(0.0)
0.1
0.1
0.2
0.2
0.2
Int. Sens. Inc.
2.1
2.6
2.7
2.7
2.8
2.9
Other Inc.
1.6
1.4
1.5
1.5
1.5
1.5
Op. Inc.
3.7
4.0
4.2
4.2
4.3
4.4
Opex
1.8
1.9
1.9
1.9
1.9
1.9
PBT
1.9
2.2
2.3
2.3
2.3
2.4
Taxes
0.5
0.6
0.8
0.8
0.8
0.8
RoA
1.3
1.5
1.6
1.6
1.6
1.6
Leverage
9.6
9.6
9.6
9.5
9.4
9.4
RoE
12.8
14.7
14.9
14.8
14.7
15.2
November 3, 2015
10
ICICI Bank | 2QFY2016 Result Update
Research Team Tel: 022 - 39357800
DISCLAIMER
Angel Broking Private Limited (hereinafter referred to as “Angel”) is a registered Member of National Stock Exchange of India Limited,
Bombay Stock Exchange Limited and Metropolitan Stock Exchange of India Limited. It is also registered as a Depository Participant with
CDSL and Portfolio Manager with SEBI. It also has registration with AMFI as a Mutual Fund Distributor. Angel Broking Private Limited is
a registered entity with SEBI for Research Analyst in terms of SEBI (Research Analyst) Regulations, 2014 vide registration number
INH000000164. Angel or its associates has not been debarred/ suspended by SEBI or any other regulatory authority for accessing
/dealing in securities Market. Angel or its associates including its relatives/analyst do not hold any financial interest/beneficial
ownership of more than 1% in the company covered by Analyst. Angel or its associates/analyst has not received any compensation /
managed or co-managed public offering of securities of the company covered by Analyst during the past twelve months. Angel/analyst
has not served as an officer, director or employee of company covered by Analyst and has not been engaged in market making activity
of the company covered by Analyst.
This document is solely for the personal information of the recipient, and must not be singularly used as the basis of any investment
decision. Nothing in this document should be construed as investment or financial advice. Each recipient of this document should
make such investigations as they deem necessary to arrive at an independent evaluation of an investment in the securities of the
companies referred to in this document (including the merits and risks involved), and should consult their own advisors to determine
the merits and risks of such an investment.
Reports based on technical and derivative analysis center on studying charts of a stock's price movement, outstanding positions and
trading volume, as opposed to focusing on a company's fundamentals and, as such, may not match with a report on a company's
fundamentals.
The information in this document has been printed on the basis of publicly available information, internal data and other reliable
sources believed to be true, but we do not represent that it is accurate or complete and it should not be relied on as such, as this
document is for general guidance only. Angel Broking Pvt. Limited or any of its affiliates/ group companies shall not be in any way
responsible for any loss or damage that may arise to any person from any inadvertent error in the information contained in this report.
Angel Broking Pvt. Limited has not independently verified all the information contained within this document. Accordingly, we cannot
testify, nor make any representation or warranty, express or implied, to the accuracy, contents or data contained within this document.
While Angel Broking Pvt. Limited endeavors to update on a reasonable basis the information discussed in this material, there may be
regulatory, compliance, or other reasons that prevent us from doing so.
This document is being supplied to you solely for your information, and its contents, information or data may not be reproduced,
redistributed or passed on, directly or indirectly.
Neither Angel Broking Pvt. Limited, nor its directors, employees or affiliates shall be liable for any loss or damage that may arise from
or in connection with the use of this information.
Note: Please refer to the important ‘Stock Holding Disclosure' report on the Angel website (Research Section). Also, please refer to the
latest update on respective stocks for the disclosure status in respect of those stocks. Angel Broking Pvt. Limited and its affiliates may
have investment positions in the stocks recommended in this report.
Disclosure of Interest Statement
ICICI Bank
1. Analyst ownership of the stock
No
2. Angel and its Group companies ownership of the stock
No
3. Angel and its Group companies' Directors ownership of the stock
No
4. Broking relationship with company covered
No
Note: We have not considered any Exposure below ` 1 lakh for Angel, its Group companies and Directors
Ratings (Based on expected returns
Buy (> 15%)
Accumulate (5% to 15%)
Neutral (-5 to 5%)
over 12 months investment period):
Reduce (-5% to -15%)
Sell (< -15)
November 3, 2015
11