2QFY2016 Result Update | Cons. Durables
October 30, 2015
Hitachi Home & Life Solutions
NEUTRAL
CMP
`1,346
Performance Highlights
Target Price
-
Y/E March (` cr)
2QFY2016 1QFY2014
% chg (yoy) 4QFY2014 % chg (qoq)
Investment Period
-
Net sales
251
254
(1.2)
709
(64.6)
EBITDA
(5)
16.3
(128.0)
87
(105.3)
EBITDA margin (%)
(1.8)
6.4
(822)bp
12.2
(1402)bp
Stock Info
Reported PAT
(10.7)
9.1
(218.1)
46.5
(123.1)
Sector
Cons. Durable
Source: Company, Angel Research
Market Cap (` cr)
3,659
Hitachi Home & Life Solutions (India) Ltd (HHLS) reported a disappointing set of
Net Debt
134
numbers for 2QFY2016. Although the decline in the top-line is of 1.2% on a yoy
Beta
1.1
52 Week High / Low
1,745 / 551
basis to `251cr, but the same is far lower than our expectation of `320cr. HHLS
Avg. Daily Volume
25,009
reported an EBITDA loss of `4.5cr for the quarter as against a positive EBITDA of
Face Value (`)
10
`16.3cr in the same quarter last year. A jump of 387bp yoy and 398bp yoy in
BSE Sensex
26,657
raw material cost and other expenses as a percentage of sales, respectively, led to
Nifty
8,066
an 822bp yoy decline in the EBITDA margin. As a result, HHLS reported a net loss
Reuters Code
HITA.NS
of `10.7cr for the quarter as against a net profit of `9.1cr in the corresponding
Bloomberg Code
HTHL IN
quarter of the previous year.
Favorable outlook for the room AC (RAC) segment to support growth: The
domestic economy is now expected to improve, after having witnessed a phase of
Shareholding Pattern (%)
lackluster growth in the past few years. We believe that steady economic growth
Promoters
74.3
will lead to higher disposable incomes in the hands of the consumers, thus
MF / Banks / Indian Fls
7.6
triggering higher demand for room ACs. Also the company will benefit from the
FII / NRIs / OCBs
1.5
improved demand from the commercial/institutional clients for its ductable ACs.
Indian Public / Others
16.7
Strong technological support from parent: HHLS has been sourcing advanced
technology from its Japanese parent which has enabled it to launch superior
products in the Indian market. “Hitachi” enjoys a strong brand pull, which has
Abs.(%)
3m 1yr 3yr
helped the company to steadily grow its market share in India. As per HHLS, their
Sensex
(2.6)
(1.0)
44.0
market share in the room AC segment has improved from a mere 5.3% in
HHLS
(8.7)
123.7
922.4
FY2009 to 13.3% in FY2015. We expect the company to successfully leverage on
both, the technical support and brand strength, to grow in India.
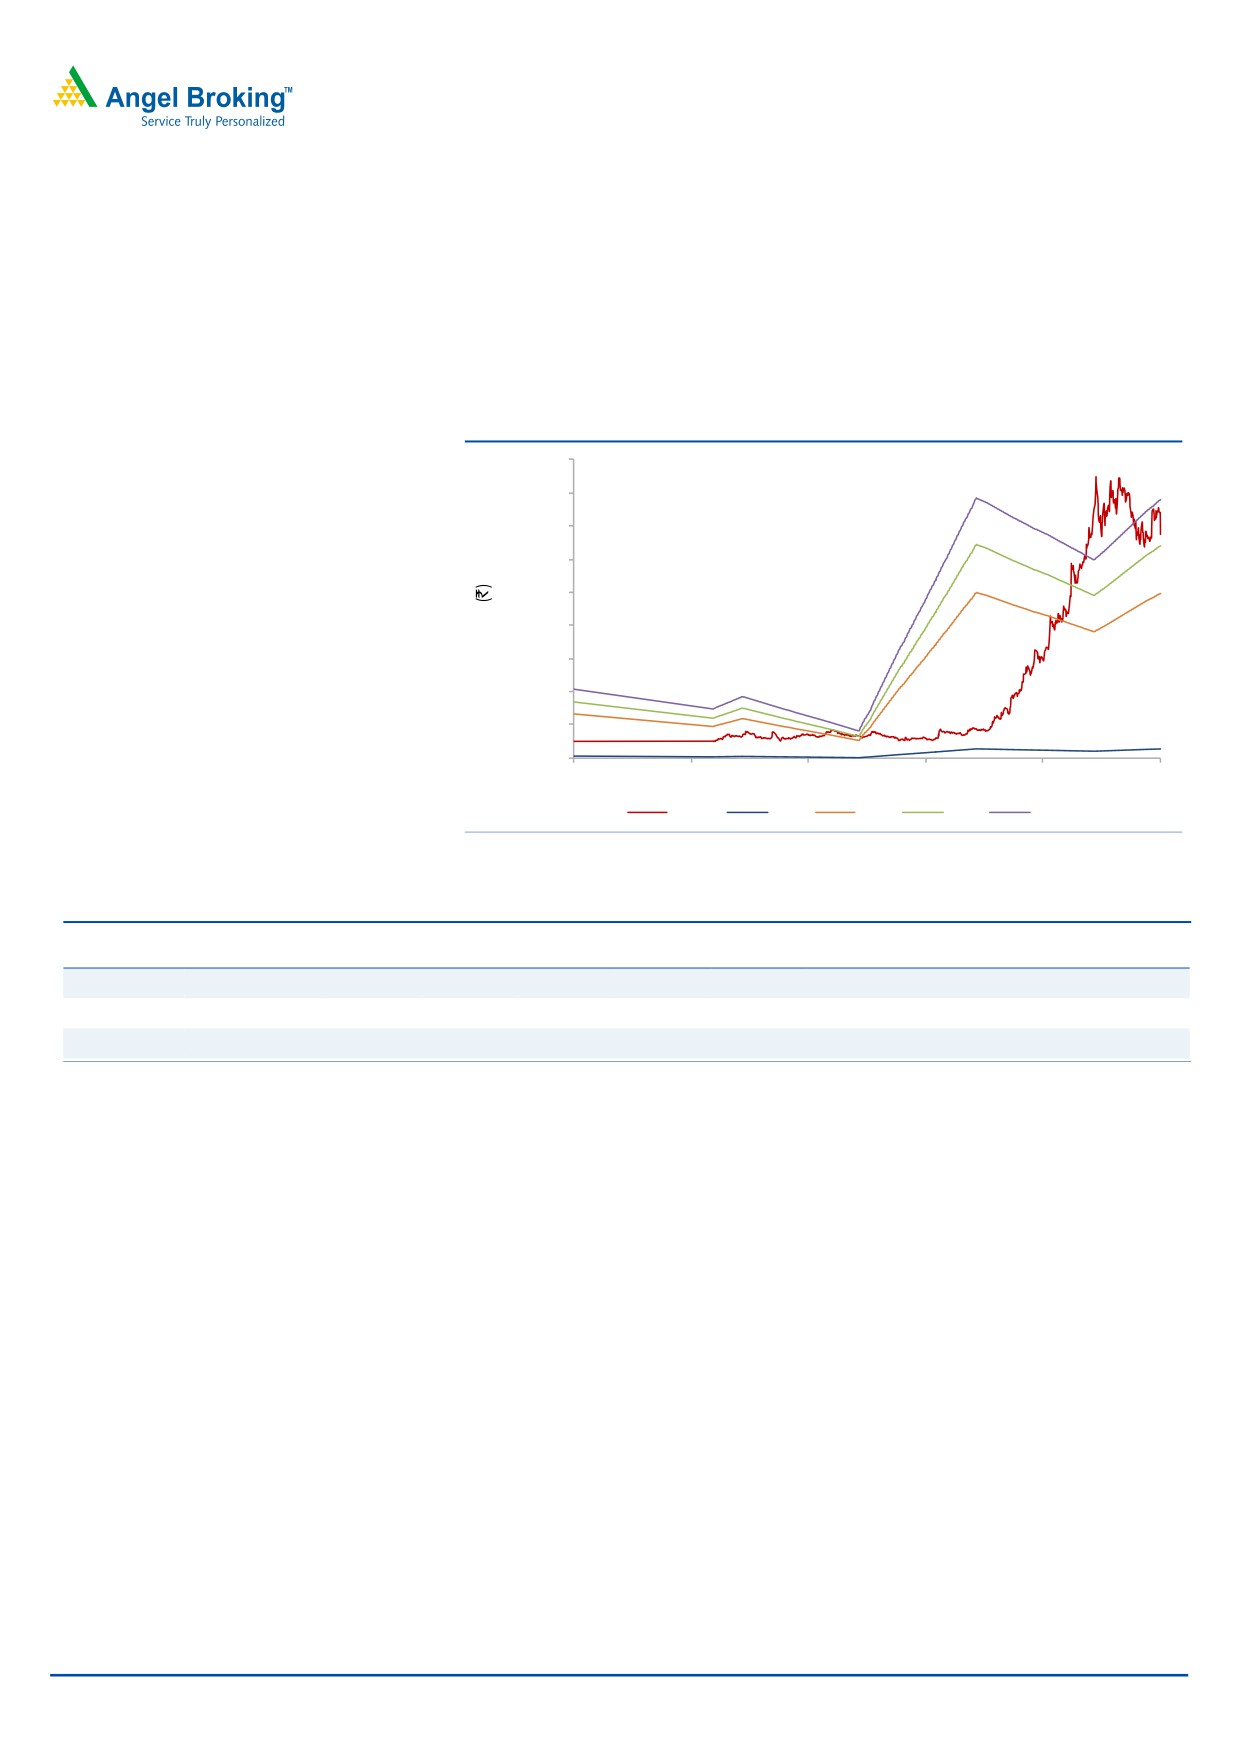
3 Year Price Chart
Outlook and valuation: We expect HHLS to post a 15.0% CAGR in revenue over
1,800
FY2015-17E to `2,081cr. The EBITDA margin is expected to be at 8.8% in
1,600
FY2017E. PAT is expected to post a CAGR of 8.1% over FY2015-17E to `91cr. At
1,400
1,200
the current levels, the stock is trading at a PE of 40.2x its FY2016E earnings which
1,000
we believe is expensive. We maintain our Neutral view on the stock.
800
600
Key financials
400
Y/E March (` cr)
FY2014
FY2015
FY2016E
FY2017E
200
-
Net sales
1,100
1,573
1,779
2,081
% chg
18.3
43.0
13.1
17.0
Net profit
8
78
59
91
% chg
(47.8)
866.1
(23.8)
53.3
EBITDA margin (%)
5.6
9.0
7.8
8.8
EPS (`)
3.0
28.6
21.8
33.4
P/E (x)
454.5
47.0
61.7
40.2
P/BV (x)
15.2
11.7
10.0
8.1
RoE (%)
3.4
28.1
17.4
22.1
RoCE (%)
7.7
24.0
19.0
24.0
Milan Desai
EV/Sales (x)
3.4
2.4
2.1
1.8
+91- 22- 4000 3600 Ext: 6846
EV/EBITDA (x)
61.6
26.8
27.2
20.3
Source: Company, Angel Research
Please refer to important disclosures at the end of this report
1
HHLS | 2QFY2016 Result update
Exhibit 1: 2QFY2016 performance
Y/E March (` cr)
2QFY16
2QFY15
yoy chg (%)
1QFY15
qoq chg (%)
1HFY16
1HFY15
% chg
Net Sales
251
254
(1.2)
709
(64.6)
959
854
12.3
Net raw material
159
151
5.2
445
(64.2)
604
529
14.2
(% of Sales)
63.5
59.7
387bp
62.8
63.0
61.9
Staff Costs
26
25
2.5
28
(9.9)
54
53
1.8
(% of Sales)
10.2
9.8
37bp
4.0
5.6
6.2
Other Expenses
70
61
15.1
149
(52.7)
219
187
17.2
(% of Sales)
28.1
24.1
398bp
21.0
22.9
21.9
Total Expenditure
255
237
7.4
622
(59.0)
877
769
14.1
EBITDA
(5)
16
(128.0)
87
(105.3)
82
85
(3.4)
EBITDA margin (%)
(1.8)
6.4
(822)bp
12.2
(1402)bp
8.5
9.9
(139)bp
Interest (incl. forex losses)
3
3
2.2
6
(54.8)
9
5
86.8
Depreciation
10
8
28.4
11
(7.0)
22
16
36.0
Other Income
0
3
(85.2)
0
11.0
1
4
(82.8)
PBT
(17)
8
(316.3)
70
(124.9)
52
68
(23.6)
(% of Sales)
(6.9)
3.2
9.8
5.4
8.0
Tax
(7)
(1)
525.0
23
(128.7)
16
16
0.8
(% of PBT)
38.2
(13.2)
33.2
31.5
23.9
Reported PAT
(11)
9
(218.1)
47
(123.1)
36
52
(31.3)
PATM
(4.3)
3.6
6.6
3.7
6.1
Equity capital (cr)
23
23
23
23
23
EPS (`)
(4.7)
4.0
(218.1)
20.3
(123.1)
15.6
22.7
(31.3)
Source: Company, Angel Research
Exhibit 2: 2QFY2016 - Actual vs. Angel estimates
(` cr)
Actual
Estimate
Variation (%)
Net Sales
251
320
(21.6)
EBITDA
(4.5)
20.8
(121.9)
EBIDTA margin (%)
(1.8)
6.5
(831)bp
Adjusted PAT
(11)
6
(267.5)
Source: Company, Angel Research
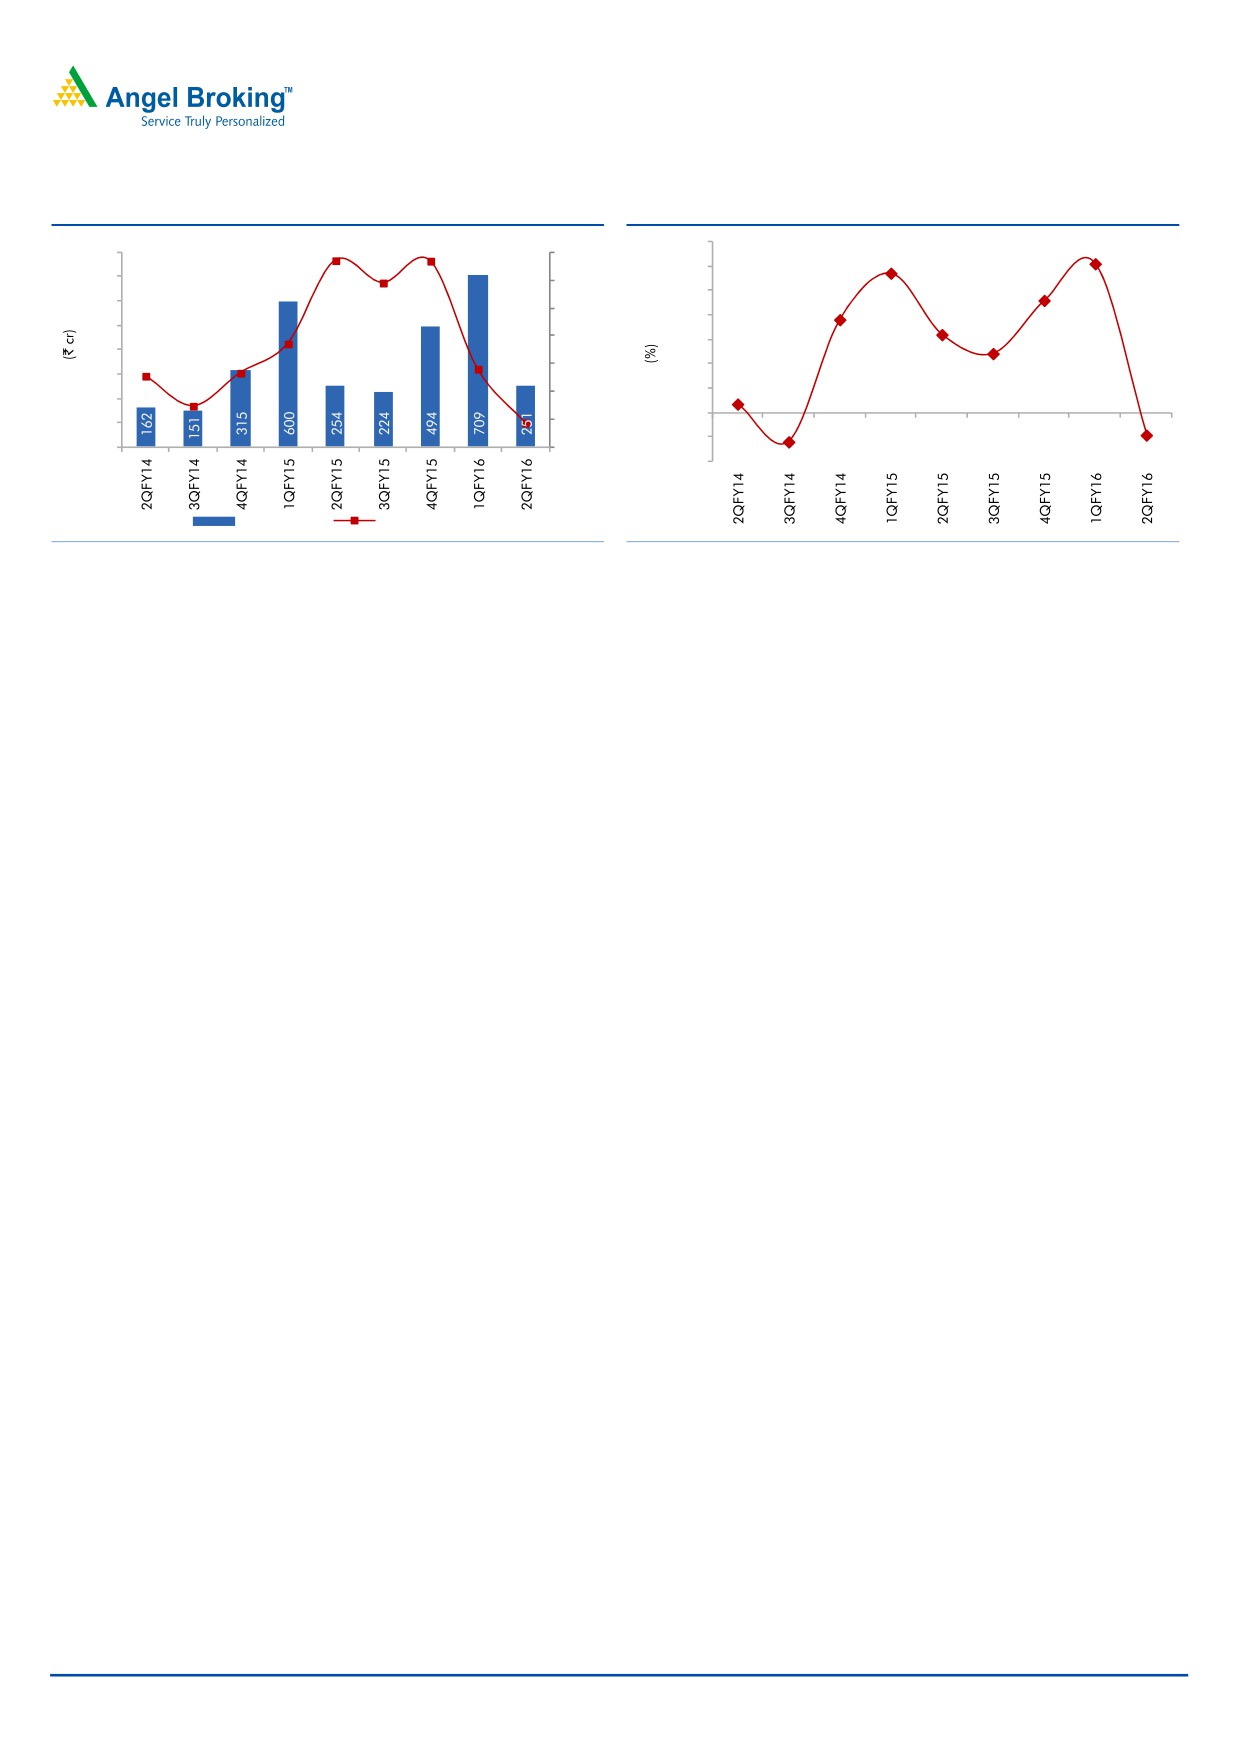
Top-line disappoints; loss at EBITDA level
The top-line for 2QFY2016 declined by 1.2% yoy to `251cr, which is far below our
expectation of `320cr. Industry reports suggest the room AC segment grew by
~5% in value terms during the quarter. HHLS’s operating expenses during the
quarter increased by 7.4% on a yoy basis to `255cr, resulting in an EBITDA loss of
`5cr. The loss was due to a 387bp yoy increase in raw material costs as a
percentage of sales to 63.5%, and 398bp yoy increase in other expenses as a
percentage of sales to 28%. Employee expense grew by a marginal 37bp yoy to
10.2% of sales. On account of higher depreciation and lower other income, the
company reported a net loss of `11cr while we had estimated a net profit of `6cr
for the quarter.
October 30, 2015
2
HHLS | 2QFY2016 Result update
Exhibit 3: Revenue trend
Exhibit 4: EBITDA Margins
57.0
56.8
14.0
12.2
800
60.0
11.4
49.0
12.0
700
50.0
9.2
10.0
600
7.6
40.0
8.0
6.4
500
27.1
30.0
6.0
400
16.6
4.9
15.5
18.1
20.0
4.0
300
4.8
2.0
0.7
10.0
200
0.0
100
0.0
(1.2)
(2.0)
0
(10.0)
(2.4)
(1.8)
(4.0)
Revenue (LHS)
yoy growth (RHS)
Source: Company, Angel Research
Source: Company, Angel Research
Updates on Open offer, Change in parent company
On January 14, 2015, HHLS’s parent - Hitachi Appliances, had divested its stake
in HHLS to a new proposed JV entity between Johnson Controls and Hitachi.
Johnson Controls would own 60% and Hitachi would hold the balance 40% in the
JV. On January 26, 2015, both the parties jointly made an offer to acquire
25.75% shares in HHLS at `821.38/share (against the then prevalent market price
of HHLS of `1,133). Upon completion of global acquisition on October 1, 2015,
Hitachi’s share holding in HHLS was transferred to JCHAC India Holdco Ltd which
is now being controlled by Johnson Controls-Hitachi Air Conditioning Holding (UK)
Ltd (the global joint venture between the Hitachi group and Johnson Controls). The
follow-up open offer was made on October 9, 2015 at `880.12/share.
October 30, 2015
3
HHLS | 2QFY2016 Result update
Investment rationale
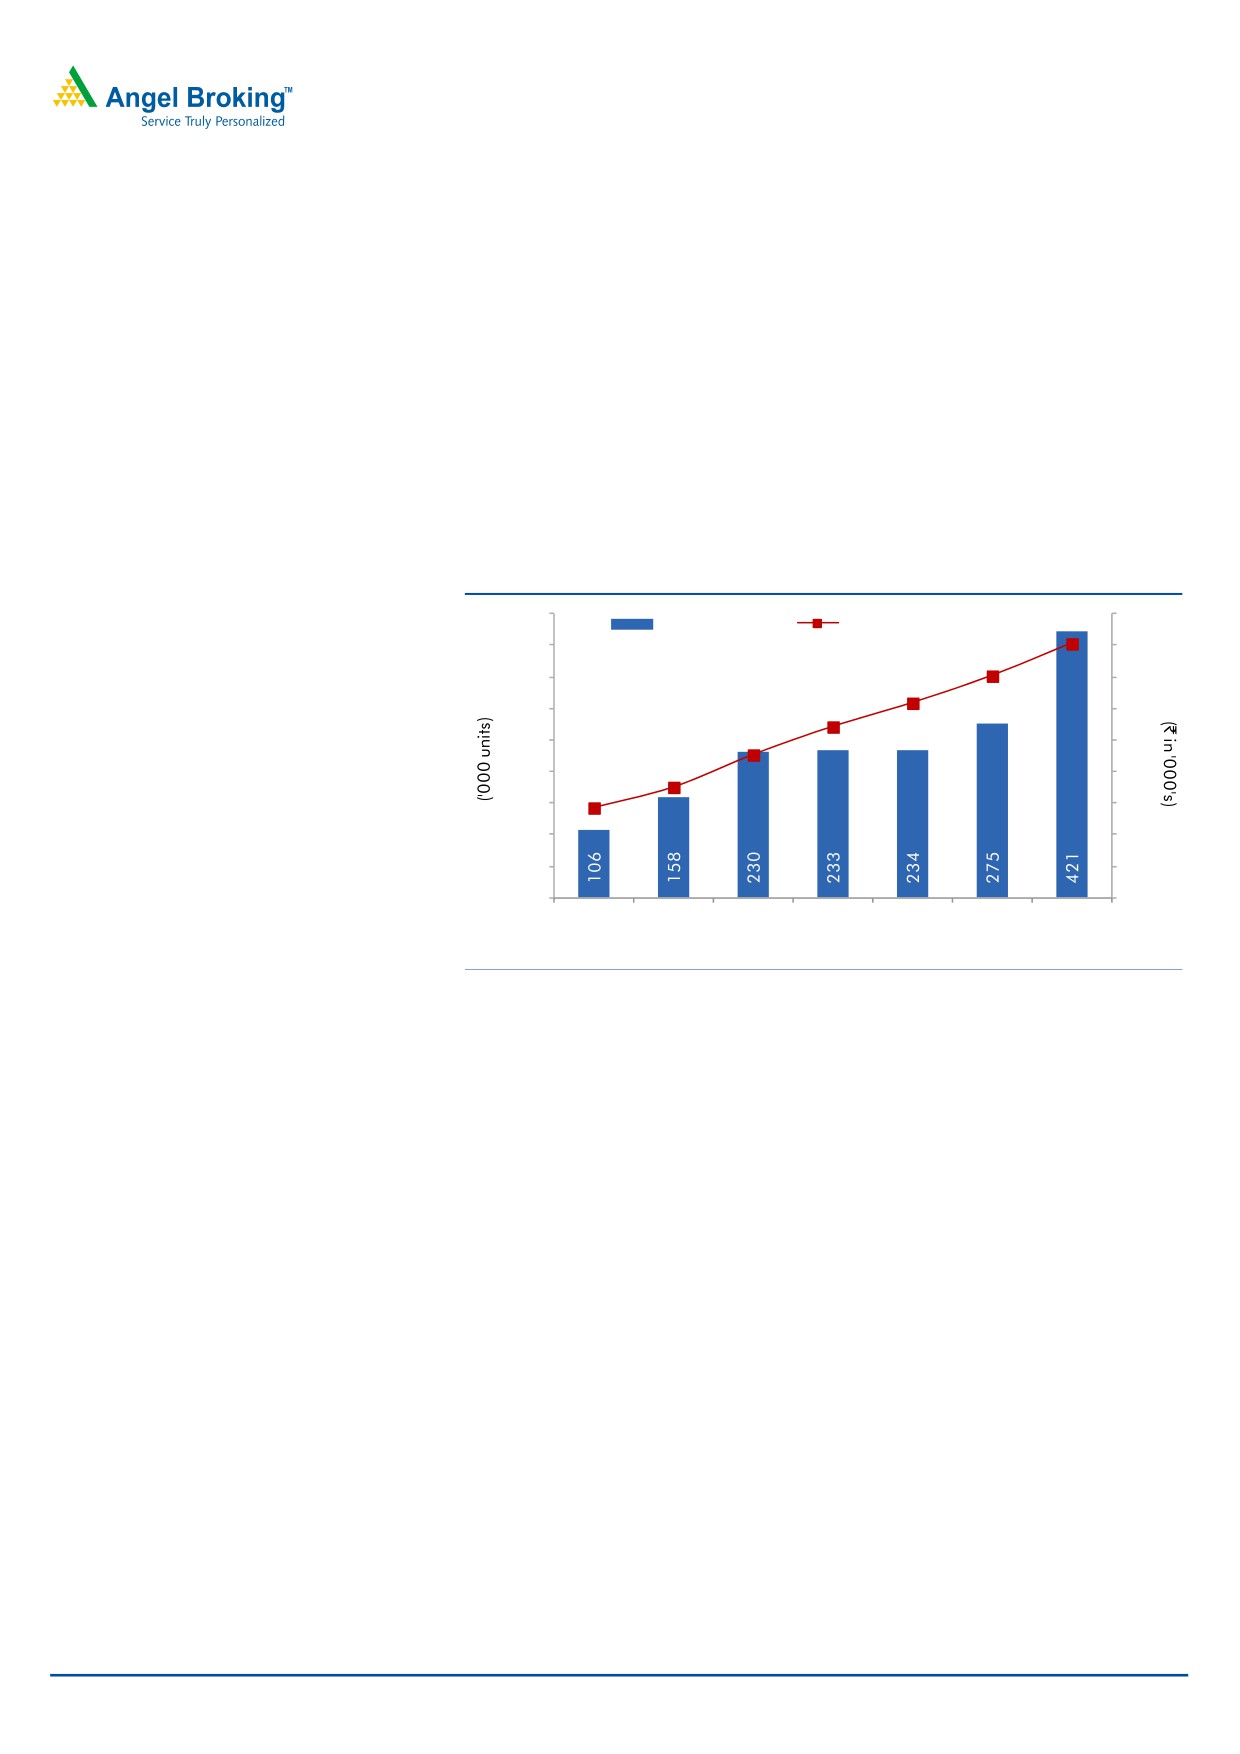
Favorable outlook for the RAC industry
With an imminent improvement in economic conditions, the disposable income
levels of consumers in India are expected to improve, going forward. As per IMF
estimates, the per capita income in India grew at a 11.7% CAGR over FY2009-15
to `1,00,463 in FY2015 while HHLS’ room AC sales volume posted a 25.8%
CAGR over the same period. We believe that the expected improvement in
disposable incomes augurs well for HHLS’ room AC sales, going forward.
Moreover, industry reports suggest that the penetration levels of room ACs in India
are lower compared to most developed and developing markets.
Exhibit 5: RAC sales volume for HHLS vs per capita income
450
110
AC volume (LHS)
Per capita income (RHS)
100
400
100
90
350
82
90
300
74
80
65
250
70
55
200
60
48
150
50
100
40
50
30
0
20
FY09
FY10
FY11
FY12
FY13
FY14
FY15
Source: IMF, Angel Research
Apart from its premium range of products, the company has also diversified into
the low-priced AC segment. In order to widen its reach in tier II & tier III cities, the
company has expanded its distribution network to more than 4,000 outlets. Since
tier-II and tier-III cities are expected to be the major contributors to the growth in
the consumer durables segment going forward, revenue contribution from these
segments would add to the company’s top-line growth.
Strong technological support from parent
HHLS has been sourcing superior technology from its Japanese parent which has
enabled it to create a strong presence in the room AC segment. HHLS continues to
leverage on its strong parental roots in terms of R&D to launch superior products
for the Indian market. This association and the brand pull have helped the
company in steadily growing its market share in India. As per HHLS, its market
share in the RAC segment has improved from mere 5.3% in FY2009 to 13.3% in
FY2015.
October 30, 2015
4
HHLS | 2QFY2016 Result update
Financials
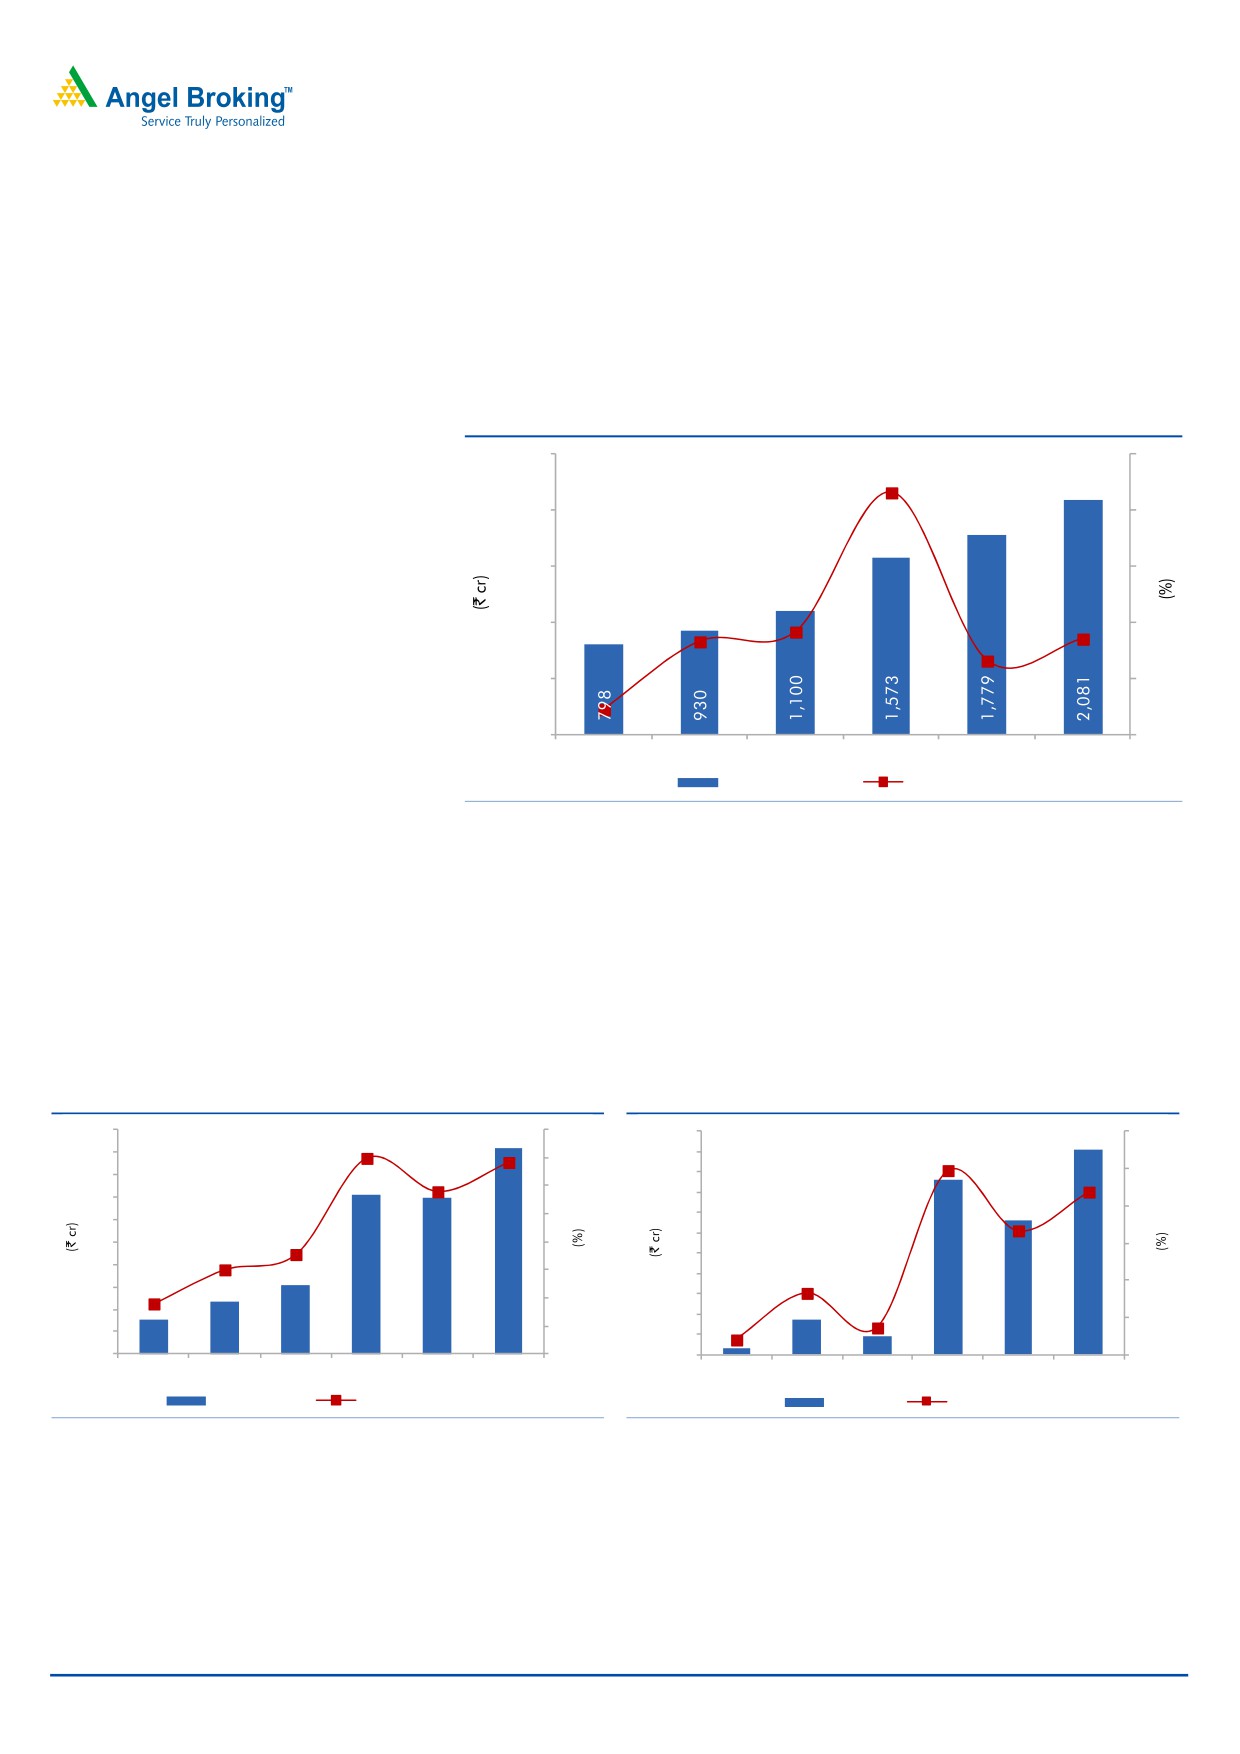
Revenue to grow at a CAGR of 15.0% over FY2015-17E
The company’s room AC segment has grown at more than twice the industry
growth rate over the last five years. We expect HHLS’ revenue to grow at a CAGR
of 15.0% over FY2015-17E to `2,081cr in FY2017E.
Exhibit 6: Revenue growth to be at 15.0% CAGR
2,500
50
43.0
2,000
40
1,500
30
1,000
16.5
18.3
20
17.0
13.1
500
10
4.5
0
0
FY2012
FY2013
FY2014
FY2015
FY2016E FY2017E
Revenue (LHS)
Revenue growth (RHS)
Source: Company, Angel Research
EBITDA margins to consolidate at 8.8%
HHLS has relocated the manufacturing facilities in Jammu to its main plant at
Kadi, Gujarat in order to centralise the production activity. With an exception of the
current quarter, the benefits of this move are evident in the company’s operating
performance in the past few quarters. With improvement in volumes, we expect the
EBITDA margin to be at 8.8% and net profit to be at `91cr in FY2017E.
Exhibit 7: EBITDA margin trend
Exhibit 8: Net profit margin trend
200
10
99
6
9.0
8.8
180
90
4.9
9
7.8
81
5
160
8
4.4
72
140
3.3
4
7
63
120
5.6
54
100
6
3
5.0
45
80
5
36
1.7
3.8
2
60
4
27
40
0.7
18
0.4
1
20
3
30
47
61
141
139
184
9
15
78
59
91
3
8
0
2
0
0
FY2012
FY2013
FY2014 FY2015 FY2016E FY2017E
FY2012
FY2013
FY2014 FY2015 FY2016E FY2017E
EBITDA (LHS)
EBITDA margin (RHS)
PAT (LHS)
PAT margin (RHS)
Source: Company, Angel Research
Source: Company, Angel Research
October 30, 2015
5
HHLS | 2QFY2016 Result update
Outlook and valuation
We expect HHLS to post a 15.0% CAGR in revenue over FY2015-17E. The EBITDA
margin is expected to be at 8.8% in FY2017E. PAT is expected to post a CAGR of
8.1% over FY2015-17E to `91cr. At the current levels, the stock is trading at a PE
of 40.2x its FY2016E earnings, which we believe is expensive. We maintain our
Neutral view on the stock.
Exhibit 9: One-year forward PE band
1800.0
1600.0
1400.0
1200.0
1000.0
800.0
600.0
400.0
200.0
0.0
Oct-10
Oct-11
Oct-12
Oct-13
Oct-14
Oct-15
Price
25x
35x
45x
55x
Source: Company, Angel Research
Exhibit 10: Relative valuation
Year end
Sales
OPM
PAT
EPS
ROE
P/E
P/BV
EV/EBITDA EV/Sales
(` cr)
(%)
(` cr)
(`)
(%)
(x)
(x)
(x)
(x)
HHLS
FY2017E
2,081
8.8
91
33.4
22.1
40.2
8.1
20.3
1.8
Blue Star
FY2017E
4,196
6.1
140
15.5
26.0
25.4
6.1
14.9
0.9
Voltas
FY2017E
6,413
8.9
463
14.1
18.0
20.2
3.4
15.4
1.3
Source: Angel Research, Bloomberg
Company Background
HHLS is part of a global joint venture between Johnson Controls of USA and
Hitachi Ltd. HHLS was transferred into a global joint venture between Johnson
Controls and Hitachi Air Conditioning Holding (UK) Ltd with the latter controlling
HHLS indirectly. Johnson Controls indirectly holds 60% in HHLS while Hitachi Ltd
owns the balance.
HHLS manufactures and sells ACs and is engaged in the trading of refrigerators,
washing machines and chillers. The company’s manufacturing capacity at Gujarat
has an installed capacity of of 2,30,000 units per annum. The company’s air
conditioners segment includes home ACs, commercial/ductable ACs and telecom
ACs. The company operates in the mass premium segment.
October 30, 2015
6
HHLS | 2QFY2016 Result update
Profit & Loss Statement
Y/E March (` cr)
FY2013
FY2014
FY2015
FY2016E
FY2017E
Gross sales
1,019
1,199
1,707
1,941
2,275
Less: Excise duty
89
100
134
162
194
Net Sales
930
1,100
1,573
1,779
2,081
Total operating income
930
1,100
1,573
1,779
2,081
% chg
16.5
18.3
43.0
13.1
17.0
Net Raw Materials
603
697
960
1,118
1,297
Personnel
65
82
114
123
141
Other
216
260
358
399
459
Total Expenditure
883
1,039
1,432
1,640
1,897
EBITDA
47
61
141
139
184
% chg
53.8
31.1
131.3
(1.9)
32.7
(% of Net Sales)
5.0
5.6
9.0
7.8
8.8
Depreciation
20
30
36
41
45
EBIT
26
31
105
97
139
% chg
120.6
17.6
239.4
(7.5)
42.3
(% of Net Sales)
2.8
2.8
6.7
5.5
6.7
Interest (incl. forex loss on ECB)
7
25
11
15
11
Other Income
2
6
7
4
6
(% of Net sales)
0.2
0.5
0.5
0.2
0.3
PBT
21
11
101
87
134
% change
640.4
(45.5)
791.9
(13.7)
53.3
Tax
5
3
23
28
43
(% of PBT)
25.7
28.9
23.0
32.0
32.0
PAT (reported)
15
8
78
59
91
Extraordinary (Exp.)/Inc.
0
-
-
-
-
ADJ. PAT
15
8
78
59
91
% chg
371.7
(47.8)
866.1
(23.8)
53.3
(% of Net Sales)
1.7
0.7
4.9
3.3
4.4
Basic EPS (`)
6.7
3.0
28.6
21.8
33.4
Adjusted EPS (`)
6.7
3.0
28.6
21.8
33.4
% chg
371.7
(47.8)
866.1
(23.8)
53.3
October 30, 2015
7
HHLS | 2QFY2016 Result update
Balance Sheet
Y/E March (` cr)
FY2013
FY2014
FY2015
FY2016E
FY2017E
SOURCES OF FUNDS
Equity Share Capital
23
27
27
27
27
Reserves & Surplus
159
213
286
340
427
Shareholders’ Funds
236
240
313
367
454
Total Loans
166
125
140
133
119
Deferred Tax Liability
0
(1)
1
1
1
Other Long Term Liabilities
0
0
0
0
0
Long Term Provisions
14
28
33
37
43
Total Liabilities
416
392
486
538
618
APPLICATION OF FUNDS
Gross Block
260
305
381
419
461
Less: Acc. Depreciation
82
110
138
179
224
Net Block
178
195
243
240
237
Capital Work-in-Progress
11
2
3
3
3
Goodwill
-
-
-
-
-
Investments
-
-
-
-
-
Long term Loans & adv
18
31
25
28
33
Other non current assets
0
-
-
-
-
Current Assets
625
532
808
883
1,057
Cash
72
22
6
23
51
Loans & Advances
28
29
27
31
36
Inventory
306
290
490
520
609
Debtors
165
188
284
308
361
Other current assets
55
1
1
1
1
Current liabilities
415
368
592
615
712
Net Current Assets
210
164
216
268
346
Misc. Exp. not written off
-
-
-
-
-
Total Assets
416
392
486
538
618
October 30, 2015
8
HHLS | 2QFY2016 Result update
Cash Flow Statement
Y/E March (` cr)
FY2013
FY2014 FY2015 FY2016E FY2017E
Profit before tax
21
11
101
87
134
Depreciation
20
30
36
41
45
Change in Working Capital
(22)
(4)
(69)
(34)
(50)
Other income
56
23
12
(4)
(6)
Direct taxes paid
(8)
(3)
(25)
(28)
(43)
Cash Flow from Operations
68
58
55
62
80
(Inc.)/Dec. in Fixed Assets
(44)
(37)
(76)
(38)
(42)
(Inc.)/Dec. in Investments
-
-
-
-
-
(Inc.)/Dec. In L.T loans & adv
(1)
(13)
6
(3)
(5)
Balances in current/ credit/ FD
0
20
(20)
-
-
Interest received
2
6
7
4
6
Others
(69)
(28)
12
-
-
Cash Flow from Investing
(113)
(51)
(71)
(37)
(41)
Issue of Equity
-
-
-
-
-
Inc./(Dec.) in loans
67
(41)
15
(7)
(13)
Inc. /(Dec.) in long term provision
3
14
5
4
6
Dividend Paid (Incl. Tax)
(5)
(5)
(5)
(5)
(4)
Others
49
(24)
(14)
-
-
Cash Flow from Financing
114
(56)
0
(8)
(11)
Inc./(Dec.) in Cash
69
(50)
(16)
17
29
Opening Cash balances
3
72
22
6
23
Closing Cash balances
72
22
6
23
51
October 30, 2015
9
HHLS | 2QFY2016 Result update
Key Ratios
Y/E March
FY2013
FY2014
FY2015
FY2016E
FY2017E
Valuation Ratio (x)
P/E (on FDEPS)
237.2
454.5
47.0
61.7
40.2
P/CEPS
102.8
96.1
32.2
36.5
26.9
P/BV
15.5
15.2
11.7
10.0
8.1
Dividend yield (%)
0.1
0.0
0.0
0.0
0.0
EV/Sales
4.0
3.4
2.4
2.1
1.8
EV/EBITDA
80.6
61.6
26.8
27.2
20.3
EV / Total Assets
10.4
9.6
7.8
7.0
6.0
Per Share Data (`)
EPS (Basic)
6.7
3.0
28.6
21.8
33.4
EPS (fully diluted)
6.7
3.0
28.6
21.8
33.4
Cash EPS
15.5
14.0
41.8
36.9
50.1
DPS
1.8
1.5
1.5
1.5
1.5
Book Value
103.0
88.3
115.1
135.1
167.0
Dupont Analysis
EBIT margin
2.8
2.8
6.7
5.5
6.7
Tax retention ratio
0.7
0.7
0.8
0.7
0.7
Asset turnover (x)
3.3
3.0
3.3
3.5
3.7
ROIC (Post-tax)
7.0
6.0
17.0
12.9
16.7
Cost of Debt (Post Tax)
3.2
14.5
6.3
7.5
6.3
Leverage (x)
0.4
0.4
0.4
0.3
0.1
Operating ROE
8.6
2.4
21.5
14.5
18.3
Returns (%)
ROCE (Pre-tax)
8.3
7.7
24.0
19.0
24.0
Angel ROIC (Pre-tax)
9.8
9.8
24.9
19.7
25.8
ROE
7.6
3.4
28.1
17.4
22.1
Turnover ratios (x)
Asset Turnover
3.6
3.6
4.1
4.2
4.5
Inventory / Sales (days)
113
99
91
104
99
Receivables (days)
61
63
66
63
63
Payables (days)
151
138
122
137
137
WC (ex-cash) (days)
39
43
41
47
47
Solvency ratios (x)
Net debt to equity
0.4
0.4
0.4
0.3
0.1
Net debt to EBITDA
2.0
1.7
0.9
0.8
0.4
Interest Coverage
3.7
1.2
9.2
6.7
12.5
October 30, 2015
10
HHLS | 2QFY2016 Result update
Research Team Tel: 022 - 39357800
DISCLAIMER
Angel Broking Private Limited (hereinafter referred to as “Angel”) is a registered Member of National Stock Exchange of India Limited,
Bombay Stock Exchange Limited and Metropolitan Stock Exchange of India Limited. It is also registered as a Depository Participant with
CDSL and Portfolio Manager with SEBI. It also has registration with AMFI as a Mutual Fund Distributor. Angel Broking Private Limited is
a registered entity with SEBI for Research Analyst in terms of SEBI (Research Analyst) Regulations, 2014 vide registration number
INH000000164. Angel or its associates has not been debarred/ suspended by SEBI or any other regulatory authority for accessing
/dealing in securities Market. Angel or its associates including its relatives/analyst do not hold any financial interest/beneficial
ownership of more than 1% in the company covered by Analyst. Angel or its associates/analyst has not received any compensation /
managed or co-managed public offering of securities of the company covered by Analyst during the past twelve months. Angel/analyst
has not served as an officer, director or employee of company covered by Analyst and has not been engaged in market making activity
of the company covered by Analyst.
This document is solely for the personal information of the recipient, and must not be singularly used as the basis of any investment
decision. Nothing in this document should be construed as investment or financial advice. Each recipient of this document should
make such investigations as they deem necessary to arrive at an independent evaluation of an investment in the securities of the
companies referred to in this document (including the merits and risks involved), and should consult their own advisors to determine
the merits and risks of such an investment.
Reports based on technical and derivative analysis center on studying charts of a stock's price movement, outstanding positions and
trading volume, as opposed to focusing on a company's fundamentals and, as such, may not match with a report on a company's
fundamentals.
The information in this document has been printed on the basis of publicly available information, internal data and other reliable
sources believed to be true, but we do not represent that it is accurate or complete and it should not be relied on as such, as this
document is for general guidance only. Angel Broking Pvt. Limited or any of its affiliates/ group companies shall not be in any way
responsible for any loss or damage that may arise to any person from any inadvertent error in the information contained in this report.
Angel Broking Pvt. Limited has not independently verified all the information contained within this document. Accordingly, we cannot
testify, nor make any representation or warranty, express or implied, to the accuracy, contents or data contained within this document.
While Angel Broking Pvt. Limited endeavors to update on a reasonable basis the information discussed in this material, there may be
regulatory, compliance, or other reasons that prevent us from doing so.
This document is being supplied to you solely for your information, and its contents, information or data may not be reproduced,
redistributed or passed on, directly or indirectly.
Neither Angel Broking Pvt. Limited, nor its directors, employees or affiliates shall be liable for any loss or damage that may arise from
or in connection with the use of this information.
Note: Please refer to the important ‘Stock Holding Disclosure' report on the Angel website (Research Section). Also, please refer to the
latest update on respective stocks for the disclosure status in respect of those stocks. Angel Broking Pvt. Limited and its affiliates may
have investment positions in the stocks recommended in this report.
Disclosure of Interest Statement
HHLS
1. Analyst ownership of the stock
No
2. Angel and its Group companies ownership of the stock
No
3. Angel and its Group companies' Directors ownership of the stock
No
4. Broking relationship with company covered
No
Note: We have not considered any Exposure below ` 1 lakh for Angel, its Group companies and Directors
Ratings (Based on expected returns
Buy (> 15%)
Accumulate (5% to 15%)
Neutral (-5 to 5%)
over 12 months investment period):
Reduce (-5% to -15%)
Sell (< -15)
October 30, 2015
11