2QFY2016 Result Update | Automobile
October 23, 2015
Hero MotoCorp
NEUTRAL
CMP
`2,619
Performance Highlights
Target Price
-
Y/E March (` cr)
2QFY16 2QFY15
% chg (yoy) 1QFY16
% chg (qoq)
Investment Period
-
Net Sales
6,837
6,915
(1.1)
6,955
(1.7)
EBITDA
1,083
935
15.9
1,048
3.4
Stock Info
EBITDA margin (%)
15.8
13.5
230 bp
15.1
70 bp
Sector
Automobile
Adj. PAT
772
763
1.1
750
2.9
Market Cap (` cr)
52,299
Source: Company, Angel Research
Net Debt (` cr)
(3,313)
Beta
0.7
Hero MotoCorp (HMCL)’s 2QFY2016 results have come in ahead of our
52 Week High / Low
3,272/2,252
estimates with the company positively surprising on the operating margin front.
Avg. Daily Volume
17,212
Revenues declined by 1% yoy to `6,837cr, although they are marginally ahead of
Face Value (`)
2
our estimate of
`6,657cr. While volumes declined by
7% yoy, the
BSE Sensex
27,288
realization/vehicle grew 6% yoy on account of price hikes, better product mix and
Nifty
8,252
higher spare sales. Despite the subdued top-line, the company’s margins
Reuters Code
HROM.BO
improved by 230bp yoy to 15.8% (better than our estimate of 14.7%). Soft
Bloomberg Code
HMCL@IN
commodity prices and cost control initiatives undertaken by the company under
the “Leap” program led to an improvement in margins. Given the strong
Shareholding Pattern (%)
operating performance, the net profit for the quarter came in at `772cr, beating
our expectation of `726cr.
Promoters
34.6
MF / Banks / Indian Fls
15.3
Outlook and valuation: HMCL’s volumes are likely to be subdued in the near
FII / NRIs / OCBs
38.4
term, given the poor sentiments in rural areas, which account for about half of the
Indian Public / Others
11.6
company’s sales. Deficient rainfall for a second consecutive year, and only a
moderate increase in the MSPs, have impacted rural income levels, and in turn
rural demand. Given the demand weakness, the company has also delayed its
Abs. (%)
3m 1yr 3yr
capacity expansion plans by two quarters. We believe, in the domestic two-
Sensex
(3.2)
2.7
46.1
wheeler universe, HMCL is likely to be most impacted by the rural slowdown,
Hero MotoCorp
(2.5)
(12.6)
41.6
given that rural demand accounts for a higher proportion of HMCL’s overall
sales, vis-a- vis competition. Also, the margins are likely to decline in 2HFY2016,
given the increase in advertising and branding expenses. We have broadly
3-year price chart
retained our earnings estimates for both FY2016 and FY2017. We continue to
3,500
maintain a Neutral view on the stock.
3,000
Key financials (Standalone)
2,500
Y/E March (` cr)
FY2014
FY2015 FY2016E
FY2017E
2,000
Net Sales
25,275
27,585
28,561
31,559
% chg
6.3
9.1
3.5
10.5
1,500
Net Profit
2,109
2,386
3,018
3,259
1,000
% chg
(0.4)
13.1
26.5
8.0
EBITDA margin (%)
14.0
12.8
14.7
14.7
EPS (`)
105.6
127.2
151.1
163.2
Source: Company, Angel Research
P/E (x)
24.8
20.6
17.3
16.1
P/BV (x)
9.3
8.0
6.7
5.7
RoE (%)
37.7
38.8
38.7
35.6
RoCE (%)
51.7
53.2
53.6
48.8
Bharat Gianani
EV/Sales (x)
1.9
1.8
1.7
1.5
022-3935 7800 Ext: 6817
EV/EBITDA (x)
13.6
13.8
11.2
10.0
Source: Company, Angel Research; Note: CMP as of October 21, 2015
Please refer to important disclosures at the end of this report
1
Hero MotoCorp | 2QFY2016 Result Update
Exhibit 1: Quarterly financial performance (Standalone)
Y/E March (` cr)
2QFY16
2QFY15
% chg (yoy)
1QFY16
% chg (qoq)
1HFY16 1HFY15
% chg (yoy)
Net Sales
6,837
6,915
(1.1)
6,955
(1.7)
13,792
13,952
(1.1)
Consumption of RM
4,666
4,971
(6.1)
4,811
(3.0)
9,477
10,082
(6.0)
(% of Sales)
68.2
71.9
69.2
68.7
72.3
Staff Costs
310
285
8.7
314
(1.5)
624
553
12.9
(% of Sales)
4.5
4.1
4.5
4.5
4.0
Other Expenses
778
725
7.3
782
(0.6)
1,560
1,435
8.7
(% of Sales)
11.4
10.5
11.3
11.3
10.3
9.9
Total Expenditure
5,754
5,981
(3.8)
5,907
(2.6)
11,661
12,070
(3.4)
Operating Profit
1,083
935
15.9
1,048
3.4
2,131
1,882
8.7
OPM (%)
15.8
13.5
15.1
15.5
13.5
Interest
1
5
(89.1)
1
1.9
1
8
(86.5)
Depreciation
109
75
45.5
103
5.9
212
366
(42.1)
Other Income
103
194
(47.0)
102
0.7
205
306
(33.2)
PBT (excl. Extr. Items)
1,076
1,048
2.7
1,046
2.9
2,123
1,814
17.0
Extr. Income/(Expense)
-
-
-
-
-
PBT (incl. Extr. Items)
1,076
1,048
2.7
1,046
2.9
2,123
1,814
17.0
(% of Sales)
15.7
15.2
15.0
15.4
13.0
Provision for Taxation
304
285
6.8
296
2.8
600
488
23.1
(% of PBT)
28.3
27.2
28.3
28.3
26.9
Reported PAT
772
763
1.1
750
2.9
1,522
1,326
14.8
Adj PAT
772
763
1.1
750
2.9
1,522
1,326
14.8
Adj. PATM
11.3
11.0
10.8
11.0
9.5
Equity capital (cr)
39.9
39.9
39.9
39.9
39.9
Adjusted EPS (`)
38.7
38.2
1.1
37.6
2.9
76.2
66.4
14.8
Source: Company, Angel Research
Exhibit 2: 2QFY2016 - Actual vs Angel estimates
Y/E March (` cr)
Actual
Estimates
Variation (%)
Net Sales
6,837
6,657
2.7
EBITDA
1,083
980
10.5
EBITDA margin (%)
15.8
14.7
130 bp
Adj. PAT
772
726
6.4
Source: Company, Angel Research
Exhibit 3: Quarterly volume performance
(units)
2QFY16
2QFY15
% chg (yoy)
1QFY16
% chg (qoq)
1HFY16
1HFY15
% chg (yoy)
Total two-wheelers
1,574,861
1,692,523
(7.0)
1,645,853
(4.3)
3,220,714
3,407,654
(5.5)
Domestic
1,515,302
1,633,046
(7.2)
1,600,552
(5.3)
3,115,854
3,311,522
(5.9)
Exports
59,559
59,477
0.1
45,301
31.5
104,860
96,132
9.1
Motorcycles
1,402,270
1,497,690
(6.4)
1,477,047
(5.1)
2,879,317
3,020,419
(4.7)
Domestic
1,359,777
1,466,494
(7.3)
1,451,644
(6.3)
2,811,421
2,959,192
(5.0)
Exports
42,493
31,196
36.2
25,403
67.3
67,896
61,227
10.9
Scooters
172,591
194,833
(11.4)
168,806
2.2
341,397
387,235
(11.8)
Domestic
155,525
166,552
(6.6)
148,908
4.4
304,433
352,330
(13.6)
Exports
17,066
28,281
(39.7)
19,898
(14.2)
36,964
34,905
5.9
Source: Company, Angel Research
October 23, 2015
2
Hero MotoCorp | 2QFY2016 Result Update
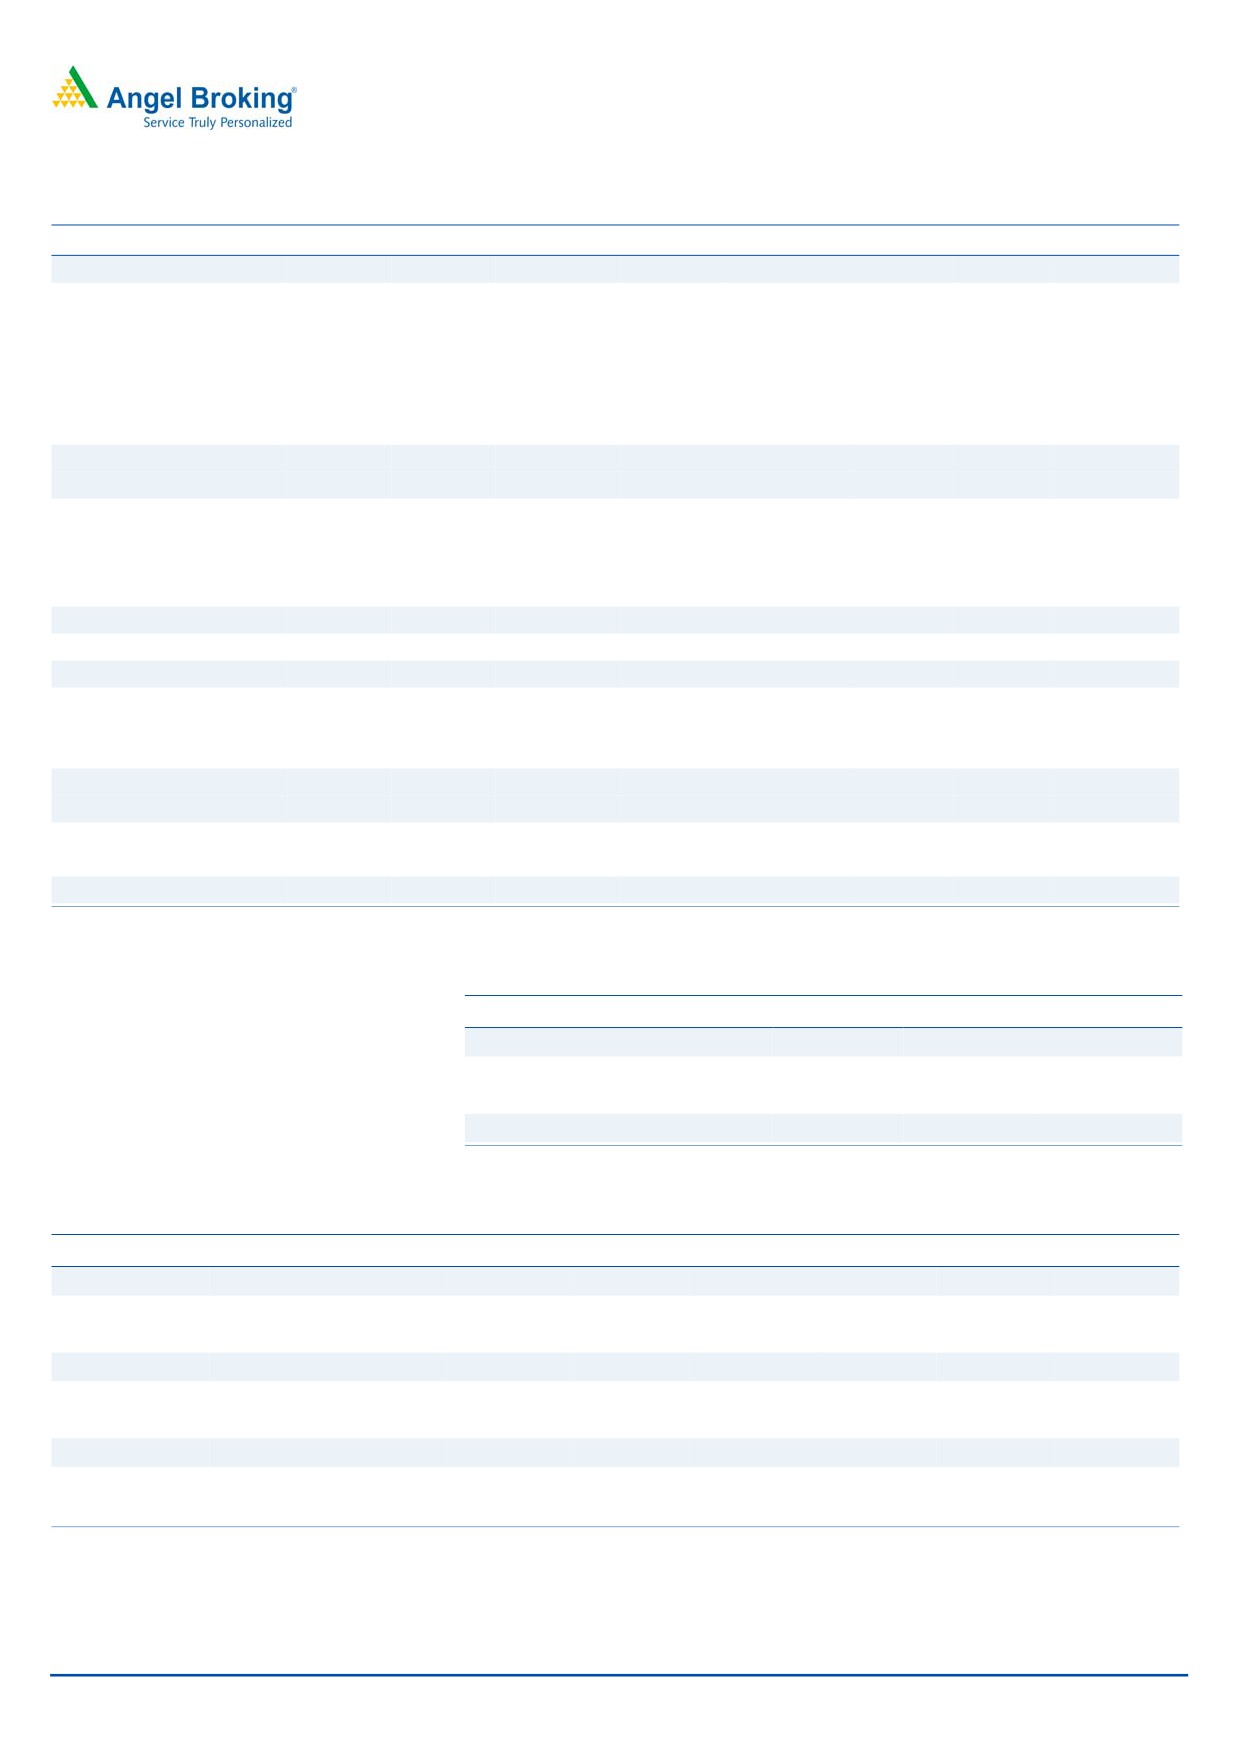
Volumes remained under pressure, declining for the fourth consecutive
quarter. Slowdown in the rural segment due to deficient rainfall and owing to
only a moderate increase in Minimum Support Prices (MSPs) for crops, hurt the
company’s volumes. HMCL lost market share by 230bp yoy, primarily due to
production adjustments, before new model launches, in the scooter segment.
Realisation/vehicle grew 6% yoy to `43,414 and was better than our estimate
of `42,267 on account of better product mix, price hikes and increased
proportion of spares. Contribution/vehicle, at `13,785, grew 5.8% qoq and
was slightly ahead of our estimate. Subdued commodity prices and raw
material cost savings under the margin improvement program boosted gross
margins.
The share of scooters in the overall mix declined marginally to 11% as the
company made production adjustments prior to the launch of two new
scooters (Maestro Edge and Duet).
Exhibit 4: Volumes flat yoy
Exhibit 5: Realisation & contribution/vehicle improve
1,800,000
25
44,000
16,000
1,600,000
20
42,000
14,000
15
1,400,000
10
1,200,000
40,000
12,000
5
1,000,000
0
38,000
10,000
800,000
(5)
36,000
8,000
600,000
(10)
Volumes
yoy growth (%)
Realisation/vehicle (`)
Contribution/vehicle (`)
Source: Company, Angel Research
Source: Company, Angel Research
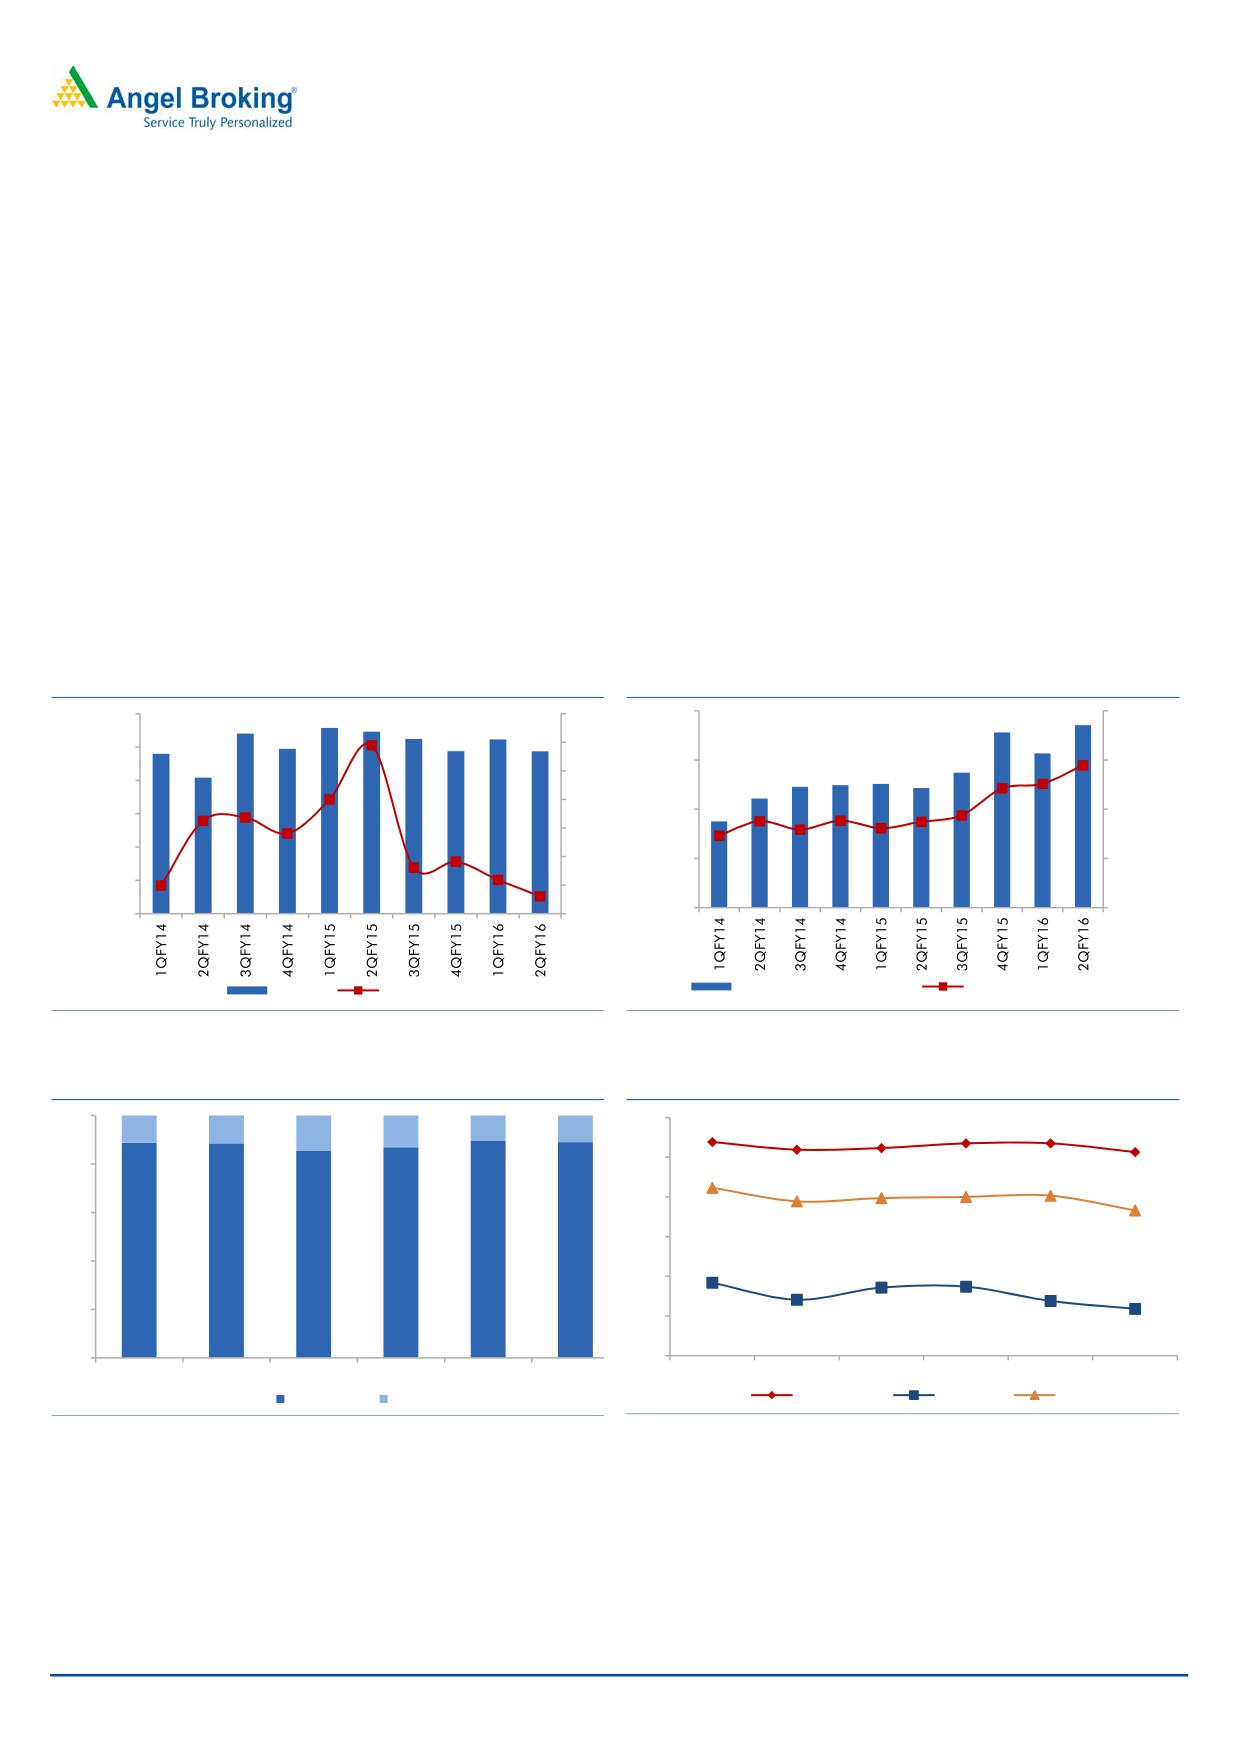
Exhibit 6: Volume mix
Exhibit 7: Domestic market share trend
100
60
53.8
53.5
53.5
11.2
11.5
10.3
11.0
51.9
52.3
51.3
14.4
13.1
50
80
42.3
39.7
40.0
40.3
38.9
36.6
40
60
30
88.8
88.5
85.6
86.9
89.7
89.0
40
18.4
17.2
17.4
20
14.1
13.8
11.8
20
10
0
0
1QFY15
2QFY15
3QFY15
4QFY15
1QFY16
2QFY16
1QFY15
2QFY15
3QFY15
4QFY15
1QFY16
2QFY16
Motorcycles
Scooters
Motorcycles
Scooters
Overall
Source: Company, Angel Research
Source: SIAM, Angel Research
October 23, 2015
3
Hero MotoCorp | 2QFY2016 Result Update
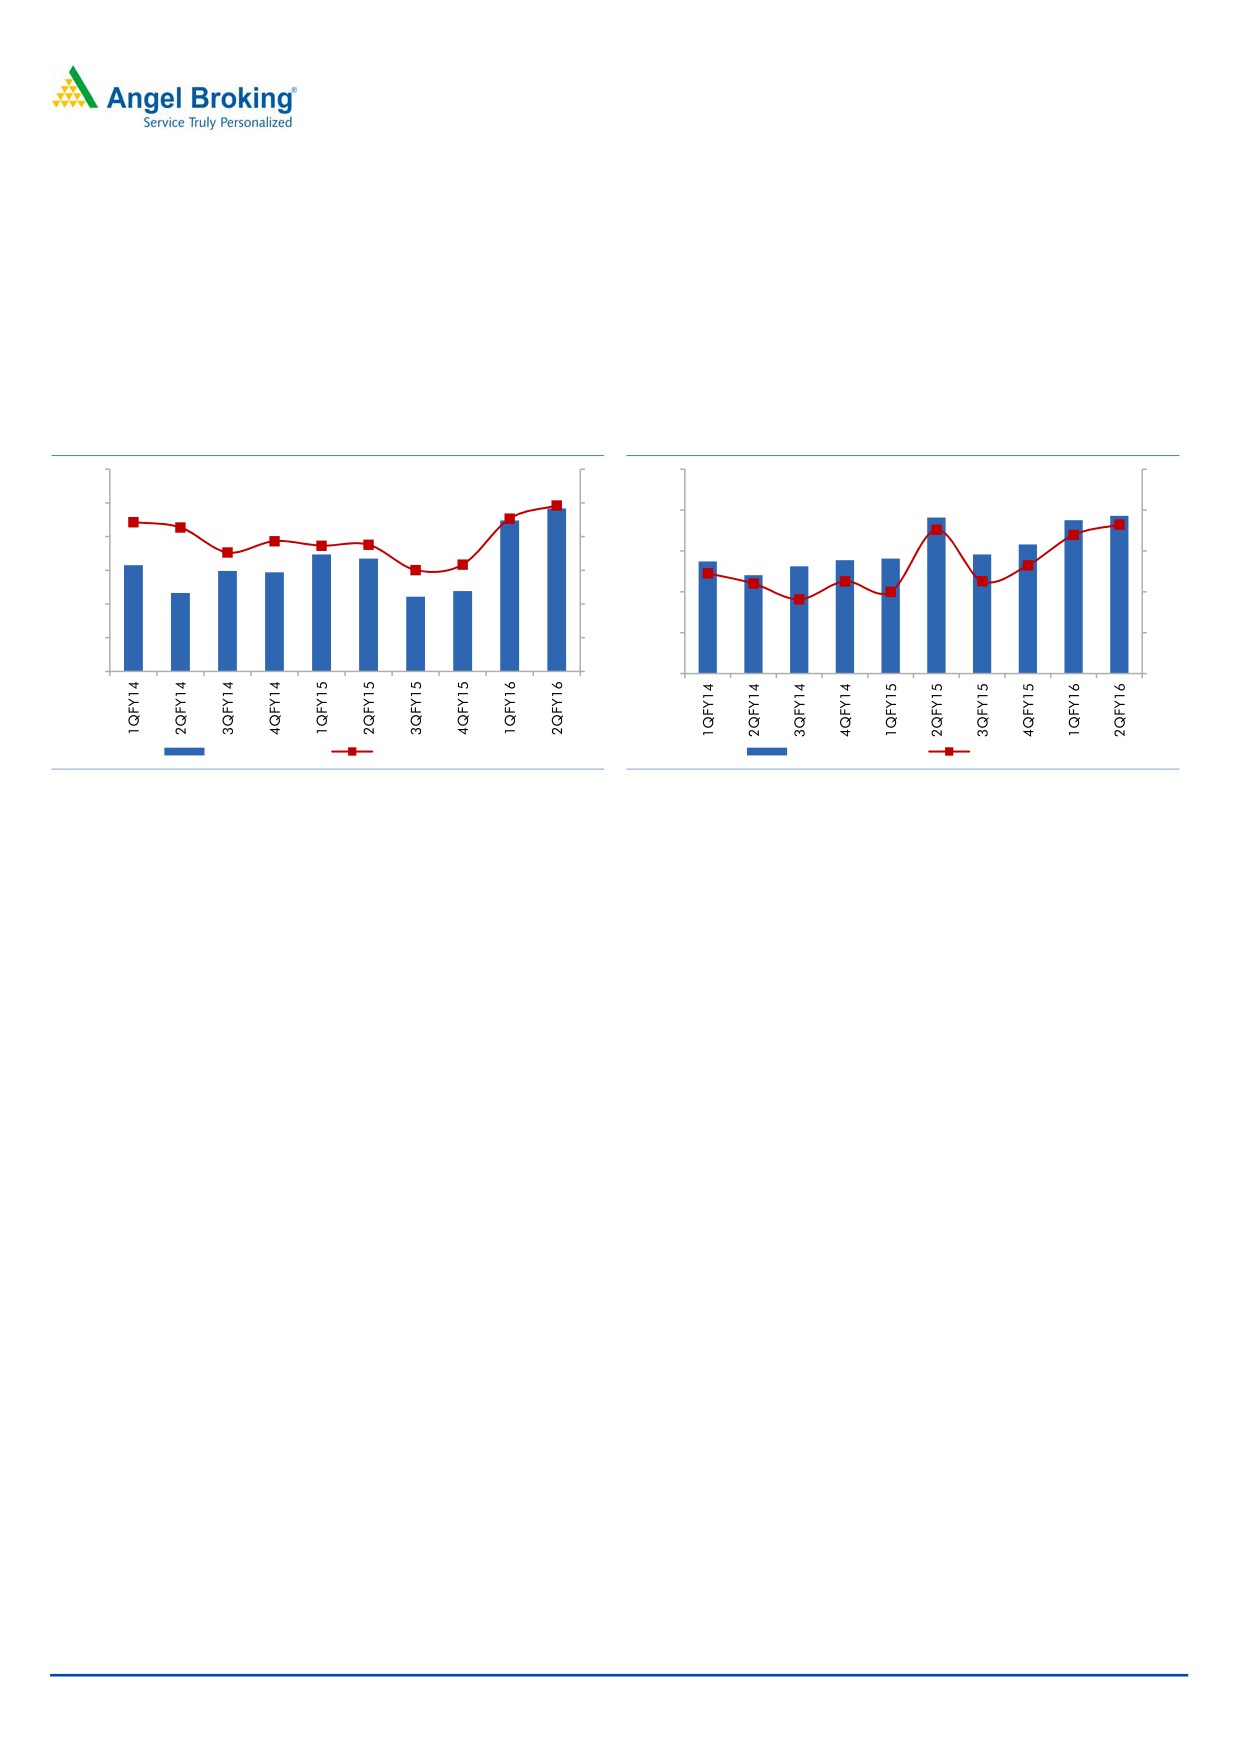
EBIDTA margin, at 15.8%, improved strongly by 230bp yoy, led by subdued
commodity prices and cost control initiatives undertaken by the company
under the margin improvement program - “Leap”.
A robust operating performance boosted the bottom-line. The Adjusted Net
Profit at `772cr (beat our estimate of `726cr) grew marginally on a yoy basis,
despite a decline in volumes.
Exhibit 8: EBITDA margin beats estimate
Exhibit 9: Bottom-line grows despite subdued volumes
1,200
1
1,000
14
1,100
1
800
12
1,000
1
600
10
900
1
400
8
800
1
200
6
700
8
600
6
0
4
EBIDTA (` cr)
EBIDTA Margin (%)
Net Profit (` cr)
Net Margin (%)
Source: Company, Angel Research
Source: Company, Angel Research
Conference call - Key highlights
The two-wheeler industry continues to remain sluggish owing to weak rural
sentiments. Rural areas contribute by about 40-45% to the industry’s overall
sales. Deficient rainfall and only a moderate increase in MSPs has hurt the
rural economy, and in turn, demand for two-wheelers. HMCL expects the two-
wheeler industry to recover from 2HFY2016 given the onset of the festive
season and a gradual pick up in the rural demand.
HMCL’s margin improvement program - “Leap” has been running successfully
and the same has enabled towards considerable cost savings. HMCL realized
benefits of `169cr and `329cr in FY2014 and FY2015 respectively. Further,
HMCL realized `60cr benefits in 1HFY2016 and aims to garner benefits to the
tune of `200cr in FY2016.
To tap the festive demand, HMCL has introduced three new products, which
include Splendor Pro in the bike space and Maestro Edge and Duet in the
scooter space.
HMCL expects commodity prices to remain soft in the near term.
HMCL has commenced operations at its Colombian plant under the CKD
format. Currently, the plant assembles about 3,000 units/month and aims to
increase the volumes to about 4,000 units/month by the end of FY2016.
On the export front, HMCL aims to sell 250,000 units in FY2016, implying a
growth of 25% yoy; and aims to enter major export markets of Nigeria,
Argentina and Mexico, going forward.
As per the Management, margins are expected to come down in 2HFY2016,
given the incurrence of higher advertising and marketing spends. HMCL has
October 23, 2015
4
Hero MotoCorp | 2QFY2016 Result Update
given an overall margin guidance of 15% for FY2016 as against 15.5%
margin achieved in 1HFY2016.
Given the slowdown in the two-wheeler industry, HMCL has delayed its
capacity expansion plans. The new Gujarat plant will commence production
from 2QFY2017 and will have an initial capacity of 750,000 units as against
1200,000 planned earlier. The plant would reach production level of 1.2mn
units only by the end of FY2017.
October 23, 2015
5
Hero MotoCorp | 2QFY2016 Result Update
Investment arguments
Expect demand to recover from 2HFY2016: We expect demand to recover
from 2HFY2016 on account of the festive season, gradual recovery in the rural
economy, reduction in interest rates and new product launches scheduled by
the company. Further, HMCL is entering new export geographies which would
enhance volumes, going ahead. We expect the company to register a positive
volume growth from 2HFY2016 onwards, as compared to demand decline in
the last four quarters.
Capacity expansion to meet future increase in demand: HMCL has a current
installed capacity of
7.65mn units across its four plants in Haridwar,
Dharuhera, Gurgaon and Neemrana. The company is setting up a new plant
in Gujarat (1.8mn units) and would further increase capacity at Neemrana
plant (by ~0.5mn units) which would come on stream in FY2017, thus taking
the overall capacity to 9.9mn units. As a result of capacity expansion, HMCL
remains well-poised to meet increase in demand, going ahead.
Outlook and valuation
HMCL’s volumes are likely to be subdued in the near term, given the poor
sentiments in rural areas, which account for about half of the company’s sales.
Deficient rainfall for a second consecutive year, and only a moderate increase in
the MSPs, have impacted rural income levels, and in turn rural demand. Given the
demand weakness, the company has also delayed its capacity expansion plans by
two quarters. We believe, in the domestic two-wheeler universe, HMCL is likely to
be most impacted by the rural slowdown, given that rural demand accounts for a
higher proportion of HMCL’s overall sales, vis-a- vis competition. Also, the
margins are likely to decline in 2HFY2016, given the increase in advertising and
branding expenses. We have broadly retained our earnings estimates for both
FY2016 and FY2017. We continue to maintain a Neutral view on the stock.
Exhibit 10: Key assumptions - Volumes
Y/E March (` cr)
FY2012
FY2013
FY2014
FY2015
FY2016E
FY2017E
Total motorcycles
5,779,621
5,499,322
5,538,356
5,799,695
5,700,404
6,016,800
Domestic
5,628,513
5,362,807
5,425,118
5,679,634
5,547,950
5,808,733
Exports
151,108
136,515
113,238
120,061
152,454
208,067
Total scooters
455,584
574,336
707,604
832,008
880,000
1,003,200
Domestic
414,389
549,808
690,079
752,052
782,454
881,267
Exports
41,195
24,528
17,525
79,956
97,546
121,933
Total two-wheelers
6,235,205
6,073,658
6,245,960
6,631,703
6,580,404
7,020,000
Source: Company, Angel Research
October 23, 2015
6
Hero MotoCorp | 2QFY2016 Result Update
Company background
Hero MotoCorp (HMCL) is a leading 2W manufacturer globally and the market
leader in the domestic motorcycle segment with an ~52% market share. HMCL
has four manufacturing facilities in India, located at Gurgaon, Dharuhera,
Haridwar and Neemrana with a total capacity of ~7.7mn units/year as of
FY2014. Over 2008-14, HMCL recorded a strong volume CAGR of ~11%,
backed by its strong brands (Passion and Splendor) and a well-entrenched
dealership network, which has a good presence across rural areas. Rural areas
account for ~49% of total volumes of the company.
October 23, 2015
7
Hero MotoCorp | 2QFY2016 Result Update
Profit and loss statement (Standalone)
Y/E March (` cr)
FY2012
FY2013
FY2014
FY2015
FY2016E
FY2017E
Total operating income
23,579
23,768
25,275
27,585
28,561
31,559
% chg
21.6
0.8
6.3
9.1
3.5
10.5
Total expenditure
19,960
20,484
21,735
24,043
24,356
26,929
Net raw material costs
17,282
17,398
18,230
19,754
19,544
21,592
Employee expenses
736
821
930
1,173
1,292
1,430
Other
1,943
2,265
2,575
3,116
3,520
3,907
EBITDA
3,619
3,284
3,540
3,542
4,205
4,630
% chg
38.5
(9.2)
20.3
0.1
18.7
10.1
EBITDA margin
15.3
13.8
14.0
12.8
14.7
14.7
Depreciation & amort.
1,097
1,142
1,107
540
471
662
EBIT
2,521
2,143
2,879
3,495
4,179
4,476
% chg
14.1
(15.0)
13.3
21.4
19.6
7.1
(% of total op. income)
10.7
9.0
11.4
12.7
14.6
14.2
Interest and other charges
21
12
12
11
7
12
Other income
365
398
446
493
445
508
Recurring PBT
2,865
2,529
2,867
3,484
4,172
4,464
% chg
15.3
(11.7)
13.4
21.5
19.7
7.0
Extraord. income/(exp.)
0
0
0
(155)
0
0
PBT
2,865
2,529
2,867
3,329
4,172
4,464
Tax
487
411
758
943
1,154
1,205
(% of PBT)
17.0
16.3
26.4
27.1
27.7
27.0
PAT (reported)
2,378
2,118
2,109
2,541
3,018
3,259
ADJ. PAT
2,378
2,118
2,109
2,386
3,018
3,259
% chg
18.4
(10.9)
(0.4)
20.5
18.8
8.0
(% of total op. income)
10.1
8.9
8.3
9.2
10.6
10.3
Basic EPS (`)
119.1
106.1
105.6
127.2
151.1
163.2
Adj. EPS (`)
119.1
106.1
105.6
127.2
151.1
163.2
% chg
18.4
(10.9)
(0.4)
20.5
18.8
8.0
October 23, 2015
8
Hero MotoCorp | 2QFY2016 Result Update
Balance sheet statement (Standalone)
Y/E March (` cr)
FY2012 FY2013 FY2014 FY2015E FY2016E
FY2017E
SOURCES OF FUNDS
Equity share capital
40
40
40
40
40
40
Reserves & surplus
4,250
4,966
5,560
6,501
7,754
9,106
Shareholders’ Funds
4,290
5,006
5,600
6,541
7,794
9,146
Total loans
-
-
-
-
Deferred tax liability
208
132
(106)
(74)
(106)
(106)
Other long term liabilities
1,011
302
24
31
31
31
Long term provisions
38
30
50
66
75
95
Total Liabilities
5,547
5,471
5,568
6,565
7,794
9,167
APPLICATION OF FUNDS
Gross block
6,308
6,685
6,909
8,158
9,458
10,758
Less: Acc. depreciation
2,523
3,614
4,666
5,191
5,662
6,324
Net Block
3,786
3,071
2,243
2,967
3,796
4,434
Capital work-in-progress
39
62
854
713
400
200
Investments
3,964
3,624
4,089
3,154
3,343
3,611
Long term loans and adv.
534
780
477
617
772
903
Other noncurrent assets
26
36
48
60
60
60
Current assets
1,541
2,068
2,280
2,938
3,996
5,006
Cash
77
181
118
159
1,346
2,128
Loans & advances
476
554
550
568
570
580
Other
988
1,334
1,612
2,211
2,080
2,298
Current liabilities
4,341
4,171
4,423
3,883
4,574
5,047
Net current assets
(2,801)
(2,102)
(2,143)
(946)
(577)
(41)
Misc. exp. not written off
-
-
-
-
Total Assets
5,547
5,471
5,568
6,565
7,794
9,167
Note: Cash includes cash with scheduled banks on dividend current accounts
October 23, 2015
9
Hero MotoCorp | 2QFY2016 Result Update
Cash flow statement (Standalone)
Y/E March (` cr)
FY2012 FY2013 FY2014 FY2015E FY2016E FY2017E
Profit before tax
2,865
2,529
2,867
3,484
4,172
4,464
Depreciation
1,097
1,142
1,052
526
471
662
Change in working capital
(691)
(787)
(23)
(1,156)
819
245
Direct taxes paid
(583)
(613)
(758)
(943)
(1,154)
(1,205)
Others
(329)
(380)
(1,303)
(22)
(32)
-
Cash Flow from Operations
2,360
1,890
1,835
1,889
4,276
4,166
(Inc.)/Dec. in fixed assets
(503)
(600)
(1,016)
(1,108)
(987)
(1,100)
(Inc.)/Dec. in investments
1,443
628
(465)
935
(189)
(267)
Others
(847)
(760)
-
-
Cash Flow from Investing
93
(733)
(1,481)
(173)
(1,177)
(1,367)
Issue of equity
-
-
-
-
Inc./(Dec.) in loans
-
-
-
-
-
-
Dividend paid (Incl. Tax)
(2,097)
(899)
(740)
(1,396)
(1,766)
(1,906)
Others
(361)
(158)
-
-
Cash Flow from Financing
(2,458)
(1,056)
(740)
(1,396)
(1,766)
(1,906)
Inc./(Dec.) in cash
(6)
101
(386)
321
1,333
892
Opening Cash balances
39
34
181
118
159
1,346
Closing Cash balances
34
135
117
159
1,346
2,128
October 23, 2015
10
Hero MotoCorp | 2QFY2016 Result Update
Key ratios
Y/E March
FY2012
FY2013
FY2014
FY2015E
FY2016E
FY2017E
Valuation Ratio (x)
P/E (on FDEPS)
22.0
24.7
24.8
20.6
17.3
16.1
P/CEPS
15.1
16.0
16.3
17.0
15.0
13.3
P/BV
12.2
10.4
9.3
8.0
6.7
5.7
Dividend yield (%)
1.7
2.3
2.5
2.9
3.5
3.7
EV/Sales
2.0
2.0
1.9
1.8
1.7
1.5
EV/EBITDA
13.3
14.8
13.6
13.8
11.3
10.1
EV / Total Assets
8.8
8.9
8.6
7.5
6.1
5.1
Per Share Data (`)
EPS (Basic)
119.1
106.1
105.6
127.2
151.1
163.2
EPS (fully diluted)
119.1
106.1
105.6
127.2
151.1
163.2
Cash EPS
174.0
163.2
161.1
154.3
174.7
196.3
DPS
45.0
60.0
65.5
76.3
90.7
97.9
Book Value
214.8
250.7
280.4
327.6
390.3
458.0
Dupont Analysis
EBIT margin
10.7
10.7
11.4
12.7
14.6
14.2
Tax retention ratio
83.0
0.8
0.7
0.7
0.7
0.7
Asset turnover (x)
4.7
4.5
4.6
4.3
4.4
4.5
ROIC (Post-tax)
41.4
40.2
38.9
39.8
46.9
46.4
Cost of Debt (Post Tax)
-
-
-
-
Leverage (x)
(0.9)
(0.8)
(0.8)
(0.5)
(0.6)
(0.6)
Operating ROE
-
-
-
-
Returns (%)
ROCE (Pre-tax)
49.2
46.4
51.7
53.2
53.6
48.8
Angel ROIC (Pre-tax)
51.2
48.0
52.8
54.6
64.8
63.6
ROE
65.6
42.3
37.7
38.8
38.7
35.6
Turnover ratios (x)
Asset Turnover (Gross Block)
4.0
3.6
3.7
3.4
3.0
2.9
Inventory / Sales (days)
9
13
13
15
14
14
Receivables (days)
3
10
13
18
17
17
Payables (days)
40
42
42
42
38
38
WC cycle (ex-cash) (days)
(61)
(19)
(15)
(8)
(7)
(7)
Solvency ratios (x)
Net debt to equity
(0.9)
(0.8)
(0.8)
(0.5)
(0.6)
(0.6)
Net debt to EBITDA
(1.1)
(1.2)
(1.2)
(0.9)
(1.1)
(1.2)
Int. Coverage (EBIT / Int.)
118.4
213.4
243.6
315.1
591.0
373.0
October 23, 2015
11
Hero MotoCorp | 2QFY2016 Result Update
Research Team Tel: 022 - 39357800
DISCLAIMER
Angel Broking Private Limited (hereinafter referred to as “Angel”) is a registered Member of National Stock Exchange of India Limited,
Bombay Stock Exchange Limited and Metropolitan Stock Exchange of India Limited. It is also registered as a Depository Participant with
CDSL and Portfolio Manager with SEBI. It also has registration with AMFI as a Mutual Fund Distributor. Angel has received in-principal
approval from SEBI for registering as a Research Entity in terms of SEBI (Research Analyst) Regulations, 2014. Angel or its associates
has not been debarred/ suspended by SEBI or any other regulatory authority for accessing /dealing in securities Market. Angel or its
associates including its relatives/analyst do not hold any financial interest/beneficial ownership of more than 1% in the company
covered by Analyst. Angel or its associates/analyst has not received any compensation / managed or co-managed public offering of
securities of the company covered by Analyst during the past twelve months. Angel/analyst has not served as an officer, director or
employee of company covered by Analyst and has not been engaged in market making activity of the company covered by Analyst.
This document is solely for the personal information of the recipient, and must not be singularly used as the basis of any investment
decision. Nothing in this document should be construed as investment or financial advice. Each recipient of this document should
make such investigations as they deem necessary to arrive at an independent evaluation of an investment in the securities of the
companies referred to in this document (including the merits and risks involved), and should consult their own advisors to determine
the merits and risks of such an investment.
Reports based on technical and derivative analysis center on studying charts of a stock's price movement, outstanding positions and
trading volume, as opposed to focusing on a company's fundamentals and, as such, may not match with a report on a company's
fundamentals.
The information in this document has been printed on the basis of publicly available information, internal data and other reliable
sources believed to be true, but we do not represent that it is accurate or complete and it should not be relied on as such, as this
document is for general guidance only. Angel Broking Pvt. Limited or any of its affiliates/ group companies shall not be in any way
responsible for any loss or damage that may arise to any person from any inadvertent error in the information contained in this report.
Angel Broking Pvt. Limited has not independently verified all the information contained within this document. Accordingly, we cannot
testify, nor make any representation or warranty, express or implied, to the accuracy, contents or data contained within this document.
While Angel Broking Pvt. Limited endeavors to update on a reasonable basis the information discussed in this material, there may be
regulatory, compliance, or other reasons that prevent us from doing so.
This document is being supplied to you solely for your information, and its contents, information or data may not be reproduced,
redistributed or passed on, directly or indirectly.
Neither Angel Broking Pvt. Limited, nor its directors, employees or affiliates shall be liable for any loss or damage that may arise from
or in connection with the use of this information.
Note: Please refer to the important ‘Stock Holding Disclosure' report on the Angel website (Research Section). Also, please refer to the
latest update on respective stocks for the disclosure status in respect of those stocks. Angel Broking Pvt. Limited and its affiliates may
have investment positions in the stocks recommended in this report.
Disclosure of Interest Statement
Hero MotoCorp
1. Analyst ownership of the stock
No
2. Angel and its Group companies ownership of the stock
No
3. Angel and its Group companies' Directors ownership of the stock
No
4. Broking relationship with company covered
No
Note: We have not considered any Exposure below ` 1 lakh for Angel, its Group companies and Directors
Ratings (Based on expected returns
Buy (> 15%)
Accumulate (5% to 15%)
Neutral (-5 to 5%)
over 12 months investment period):
Reduce (-5% to -15%)
Sell (< -15%)
October 23, 2015
12