4QFY2016 Result Update | FMCG
May 11, 2016
Hindustan Unilever
NEUTRAL
CMP
`862
Performance Highlights
Target Price
-
Quarterly Data
Investment Period
-
(` cr)
4QFY16
4QFY15
% yoy
3QFY16
% qoq
Revenue
7,946
7,676
3.5
7,981
(0.4)
EBITDA
1,457
1,318
10.5
1,314
10.9
Stock Info
Margin (%)
18.3
17.2
117bp
16.5
187bp
Sector
FMCG
Reported PAT
1,090
1,018
7.0
971
12.2
Market Cap (` cr)
1,86,629
Source: Company, Angel Research
Net Debt (` cr)
-5,798
Hindustan Unilever (HUL)’s performance for 4QFY2016 was slightly below
Beta
0.6
consensus expectations. For the quarter, the company’s top-line grew by 3.5% yoy
52 Week High / Low
944 / 765
to `7,946cr while the reported PAT grew ~7% yoy to `1,090cr.
Avg. Daily Volume
81,759
Face Value (`)
1
Key highlights: For 4QFY2016, HUL’s top-line rose by 3.5% yoy to `7,946cr on
BSE Sensex
25,773
the back of 4% volume growth. The soaps and detergents division posted a lower
yoy growth due to weak macros. However, in the soaps segment, we saw healthy
Nifty
7,888
volume growth in Dove, Pears, Hamam and Lifebuoy. In the laundry segment,
Reuters Code
HLL.BO
growth was led by the premium sub-segment, with Surf maintaining its strong
Bloomberg Code
HUVR@IN
double-digit growth. The personal products division posted a soft growth of 2.8%
yoy as it was impacted by phasing out of excise duty incentives, one-time credit for
Shareholding Pattern (%)
excise duty refund in base quarter and residual impact from the re-alignment of
Promoters
67.2
channel spend. In the beverages segment, the company reported a growth of 6%
MF / Banks / Indian Fls
4.8
yoy, primarily led by volumes (tea and coffee products reported strong double-
digit growth). Packaged food reported ~11% growth during the quarter.
FII / NRIs / OCBs
14.2
Indian Public / Others
13.8
The company posted a strong operating performance for the quarter with the
operating profit reporting a growth of 10.5% yoy. Further, the operating profit
margin increased by 117bp yoy to 18.3% due to lower material costs. On the
Abs. (%)
3m 1yr
3yr
bottom-line front, the company reported a net profit growth of 7%.
Sensex
8.5
(6.3)
28.3
HUL
4.5
(0.7)
47.4
Outlook and valuation: We expect HUL to post a ~8% and ~8% CAGR in its top-
line and bottom-line respectively, over FY2016-18E. At the current market price,
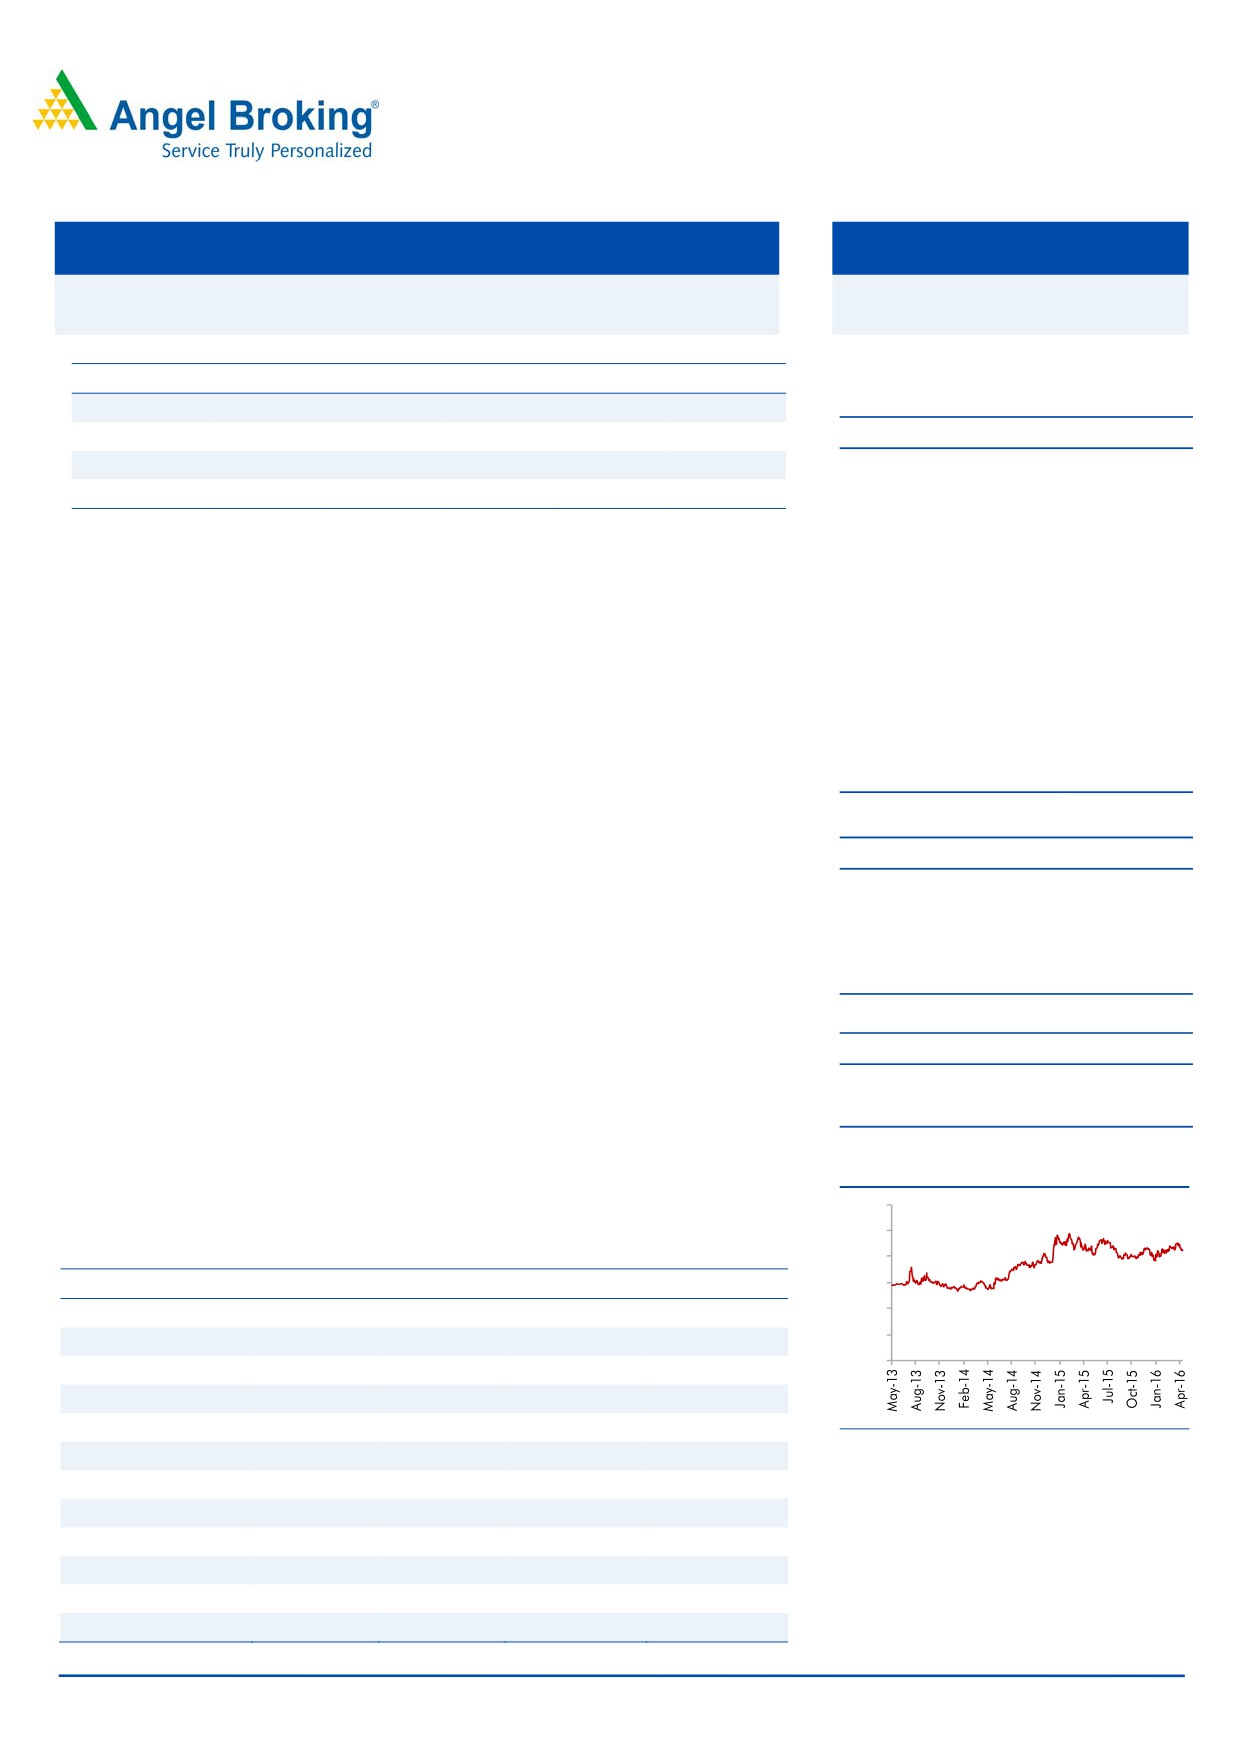
3-year price chart
the stock is trading at 38.9x its FY2018E earnings. We maintain our Neutral view
1200
on the stock.
1000
Key financials (Consolidated)
800
Y/E March (` cr)
FY2015
FY2016
FY2017E
FY2018E
600
400
Net sales
31,972
33,194
35,716
39,002
200
% chg
9.4
3.8
7.6
9.2
0
Net profit
3,893
4,109
4,476
4,800
% chg
3.3
5.6
8.9
7.2
EBITDA margin (%)
16.9
17.8
17.6
17.4
Source: Company, Angel Research
EPS (`)
18.0
19.0
20.7
22.2
P/E (x)
47.9
45.4
41.7
38.9
P/BV (x)
46.4
40.0
34.6
30.3
RoE (%)
108.5
87.4
83.1
78.0
RoCE (%)
125.3
112.8
104.8
99.6
Amarjeet S Maurya
EV/Sales (x)
5.7
5.4
5.0
4.6
022-39357800 Ext: 6831
EV/EBITDA (x)
33.4
30.6
28.6
26.4
Source: Company, Angel Research; Note: CMP as of May 10, 2016
Please refer to important disclosures at the end of this report
1
Hindustan Unilever | 4QFY2016 Result Update
Exhibit 1: Standalone quarterly performance
Y/E March (` cr)
4QFY16
4QFY15
% yoy
3QFY15
% qoq
FY2016
FY2015
% chg
Net Sales
7,946
7,676
3.5
7,981
(0.4)
31,987
30,806
3.8
Consumption of RM
3,769
3,827
(1.5)
3,742
0.7
15,313
15,624
(2.0)
(% of Sales)
47.4
49.9
46.9
47.9
50.7
Staff Costs
446
388
14.8
402
11.1
1,592
1,579
0.8
(% of Sales)
5.6
5.1
5.0
5.0
5.1
Advertising
1,090
1,025
6.3
1,138
(4.2)
4,526
3,872
16.9
(% of Sales)
13.7
13.4
14.3
14.1
12.6
Other Expenses
1,183
1,117
5.9
1,385
(14.6)
4,865
4,536
7.2
(% of Sales)
14.9
14.5
17.4
15.2
14.7
Total Expenditure
6,488
6,357
2.1
6,667
(2.7)
26,296
25,611
2.7
Operating Profit
1,457
1,318
10.5
1,314
10.9
5,691
5,194
9.6
OPM
18.3
17.2
16.5
17.8
16.9
Interest
0.03
-
0
(40.0)
0
17
(98.9)
Depreciation
88
71
24.1
82
6.5
321
287
11.9
Other Income
135
278
(51.5)
177
(23.6)
501
1,297
(61.4)
PBT (excl. Ext Items)
1,504
1,525
(1.4)
1,409
6.8
5,871
6,187
(5.1)
Ext (Income)/Expense
-
-
-
-
-
PBT (incl. Ext Items)
1,504
1,525
(1.4)
1,409
6.8
5,871
6,187
(5.1)
(% of Sales)
18.9
19.9
17.6
18.4
20.1
Provision for Taxation
415
507
437
1,788
1,872
(4.5)
(% of PBT)
27.6
33.3
31.0
30
30
Reported PAT
1,090
1,018
7.0
971
12.2
4,082
4,315
(5.4)
PATM
13.7
13.3
12.2
12.8
14.0
Equity shares (cr)
216
216
216
216
216
FDEPS (`)
5.0
4.7
7.0
4.5
12.2
18.9
19.9
(5.4)
Source: Company, Angel Research
May 11, 2016
2
Hindustan Unilever | 4QFY2016 Result Update
Exhibit 2: Segmental Performance
4QFY2016
4QFY2015
% chg
3QFY2016
% chg 9MFY16 9MFY15
% chg
Income
Soaps & Detergents
3,753
3,674
2.1
3,630
3.4
15,053
14,877
1.2
Personal Products
2,312
2,250
2.8
2,593
(10.8)
9,656
9,006
7.2
Beverages
1,036
976
6.1
984
5.3
3,888
3,631
7.1
Packaged Foods
533
477
11.7
470
13.4
2,117
1,892
11.9
Others
303
295
2.9
295
2.9
1,235
1,313
(6.0)
Total Gross Income
7,937
7,671
7,971
31,949
30,719
PBIT segment -wise bifurcation
Soaps & Detergents
545
488
11.6
509
7.1
2,142
2,034
5.3
Personal Products
682
625
9.2
748
(8.8)
2,755
2,424
13.7
Beverages
199
182
9.5
173
15.0
653
615
6.2
Packaged Foods
30
25
19.8
15
103.7
127
83
52.3
Others
(8)
(8)
(0.5)
(35)
(77.9)
(37)
(15)
140.5
Total PBIT
1,449
1,312
1,410
5,640
5,140
Less: Interest Exp
(0)
(0)
(0)
(17)
Less: Other Unallocable Exp
56
214
(1)
231
1,064
PBT
1,504
1,525
1,409
5,870
6,187
PBIT Margin (%)
Soaps & Detergents
14.5
13.3
14.0
14.2
13.7
Personal Products
29.5
27.8
28.9
28.5
26.9
Beverages
19.2
18.6
17.6
16.8
16.9
Packaged Foods
5.7
5.3
3.2
6.0
4.4
Others
-2.6
(2.7)
(12.0)
(3.0)
(1.2)
Source: Company, Angel Research
Overall top-line growth flattish
For 4QFY2016, HUL’s top-line rose by 3.5% yoy to `7,946cr on the back of 4%
volume growth. The soaps and detergents division posted a lower yoy growth due
to weak macros. However, in the soaps segment, we saw healthy volume growth in
Dove, Pears, Hamam and Lifebuoy. In the laundry segment, growth was led by the
premium sub-segment, with Surf maintaining its strong double-digit growth. The
personal products division posted a soft growth of 2.8% yoy as it was impacted by
phasing out of excise duty incentives, one-time credit for excise duty refund in base
quarter and residual impact from the re-alignment of channel spend. In the
beverages segment, the company reported a growth of 6% yoy, primarily led by
volumes (tea and coffee products reported strong double-digit growth). Packaged
food reported ~11% growth during the quarter.
May 11, 2016
3
Hindustan Unilever | 4QFY2016 Result Update
Exhibit 3: Top-line growth trend
10
8,200
8,000
8
7,800
7,600
6
7,400
4
7,200
7,000
2
6,800
-
6,600
(2)
6,400
6,200
(4)
Net Sales
QoQ growth (%)
Source: Company, Angel Research
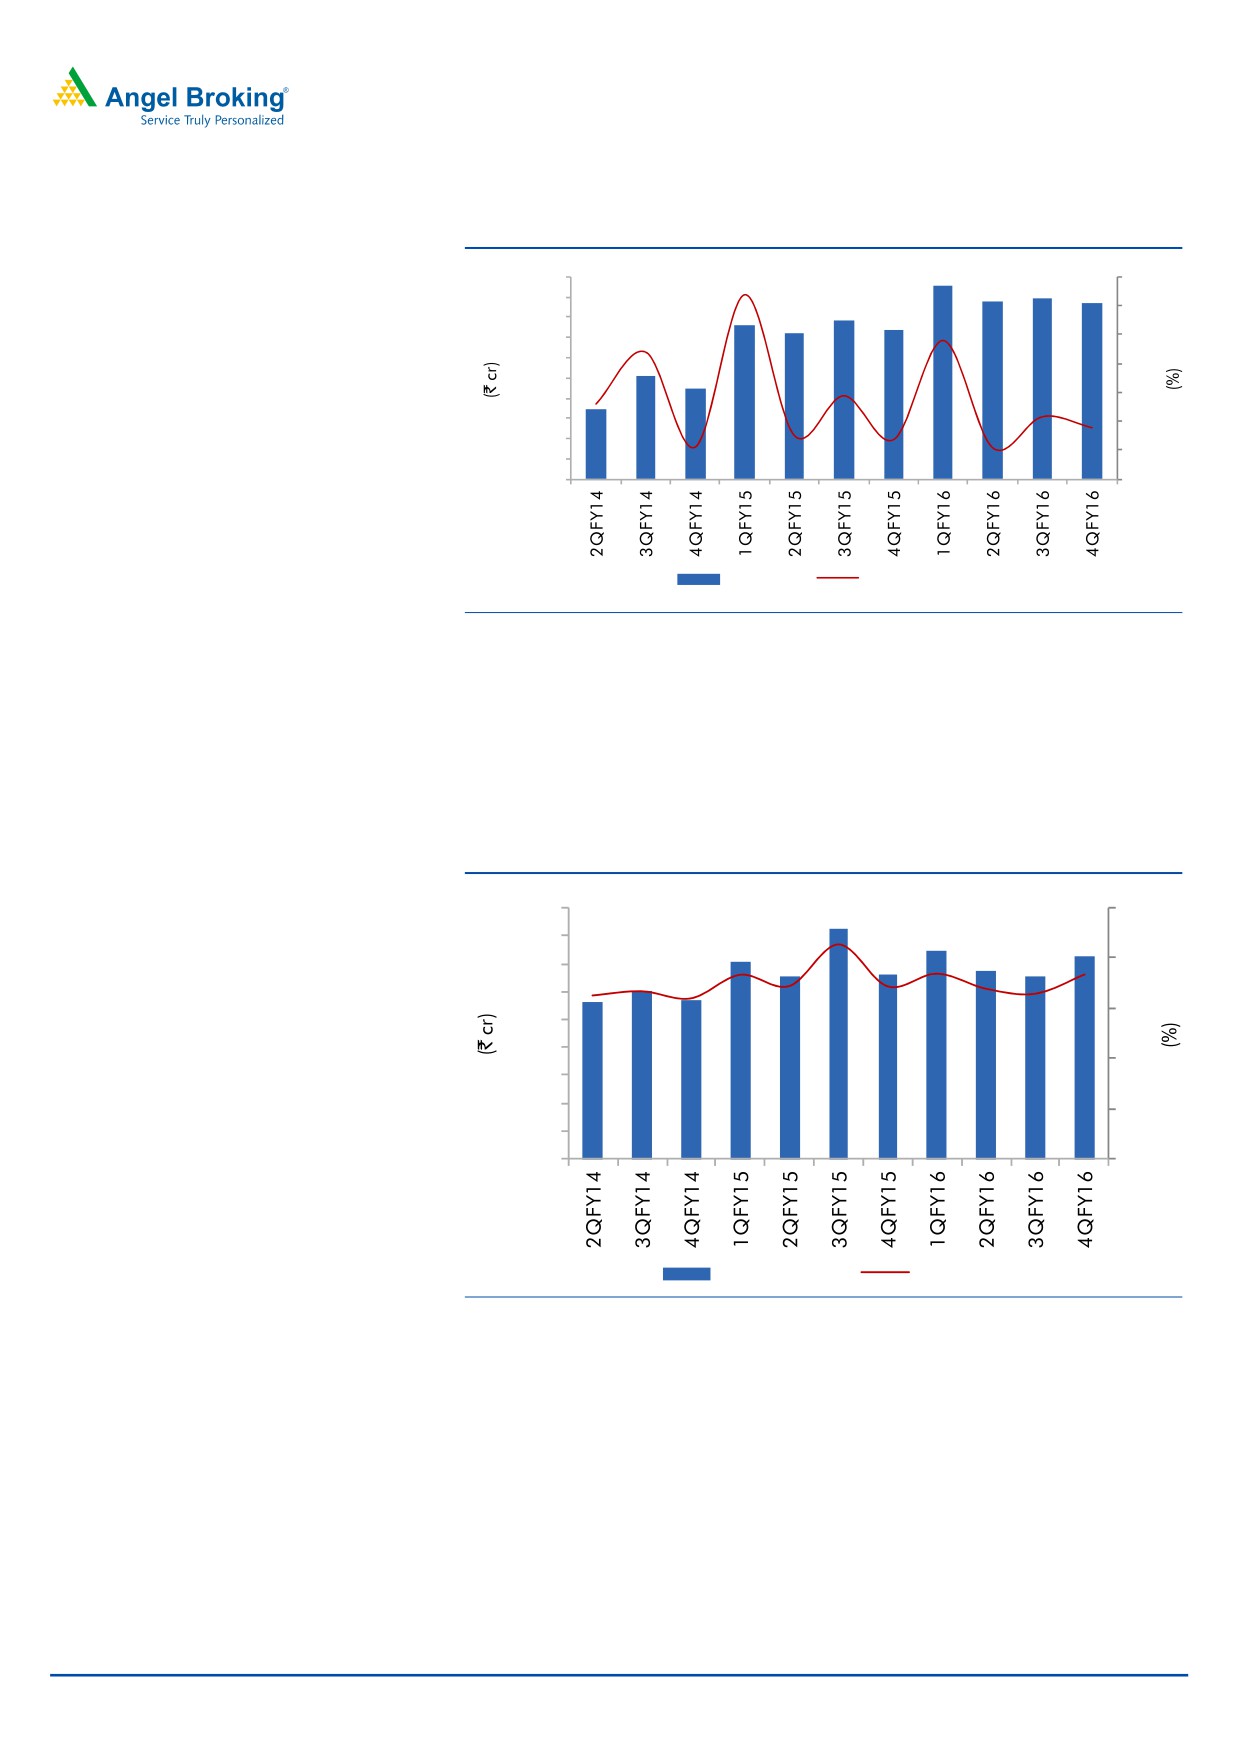
Operating margin improved due to lower raw material cost
The company reported a 10.5% yoy growth in its operating profit for the quarter
while the operating profit margin improved by 117bp yoy to 18.3% due to lower
material cost.
Exhibit 4: Operating profit and margin trend
1,800
25
1,600
1,400
20
1,200
15
1,000
800
10
600
400
5
200
0
0
Operating Profit
Margin (%)
Source: Company, Angel Research
May 11, 2016
4
Hindustan Unilever | 4QFY2016 Result Update
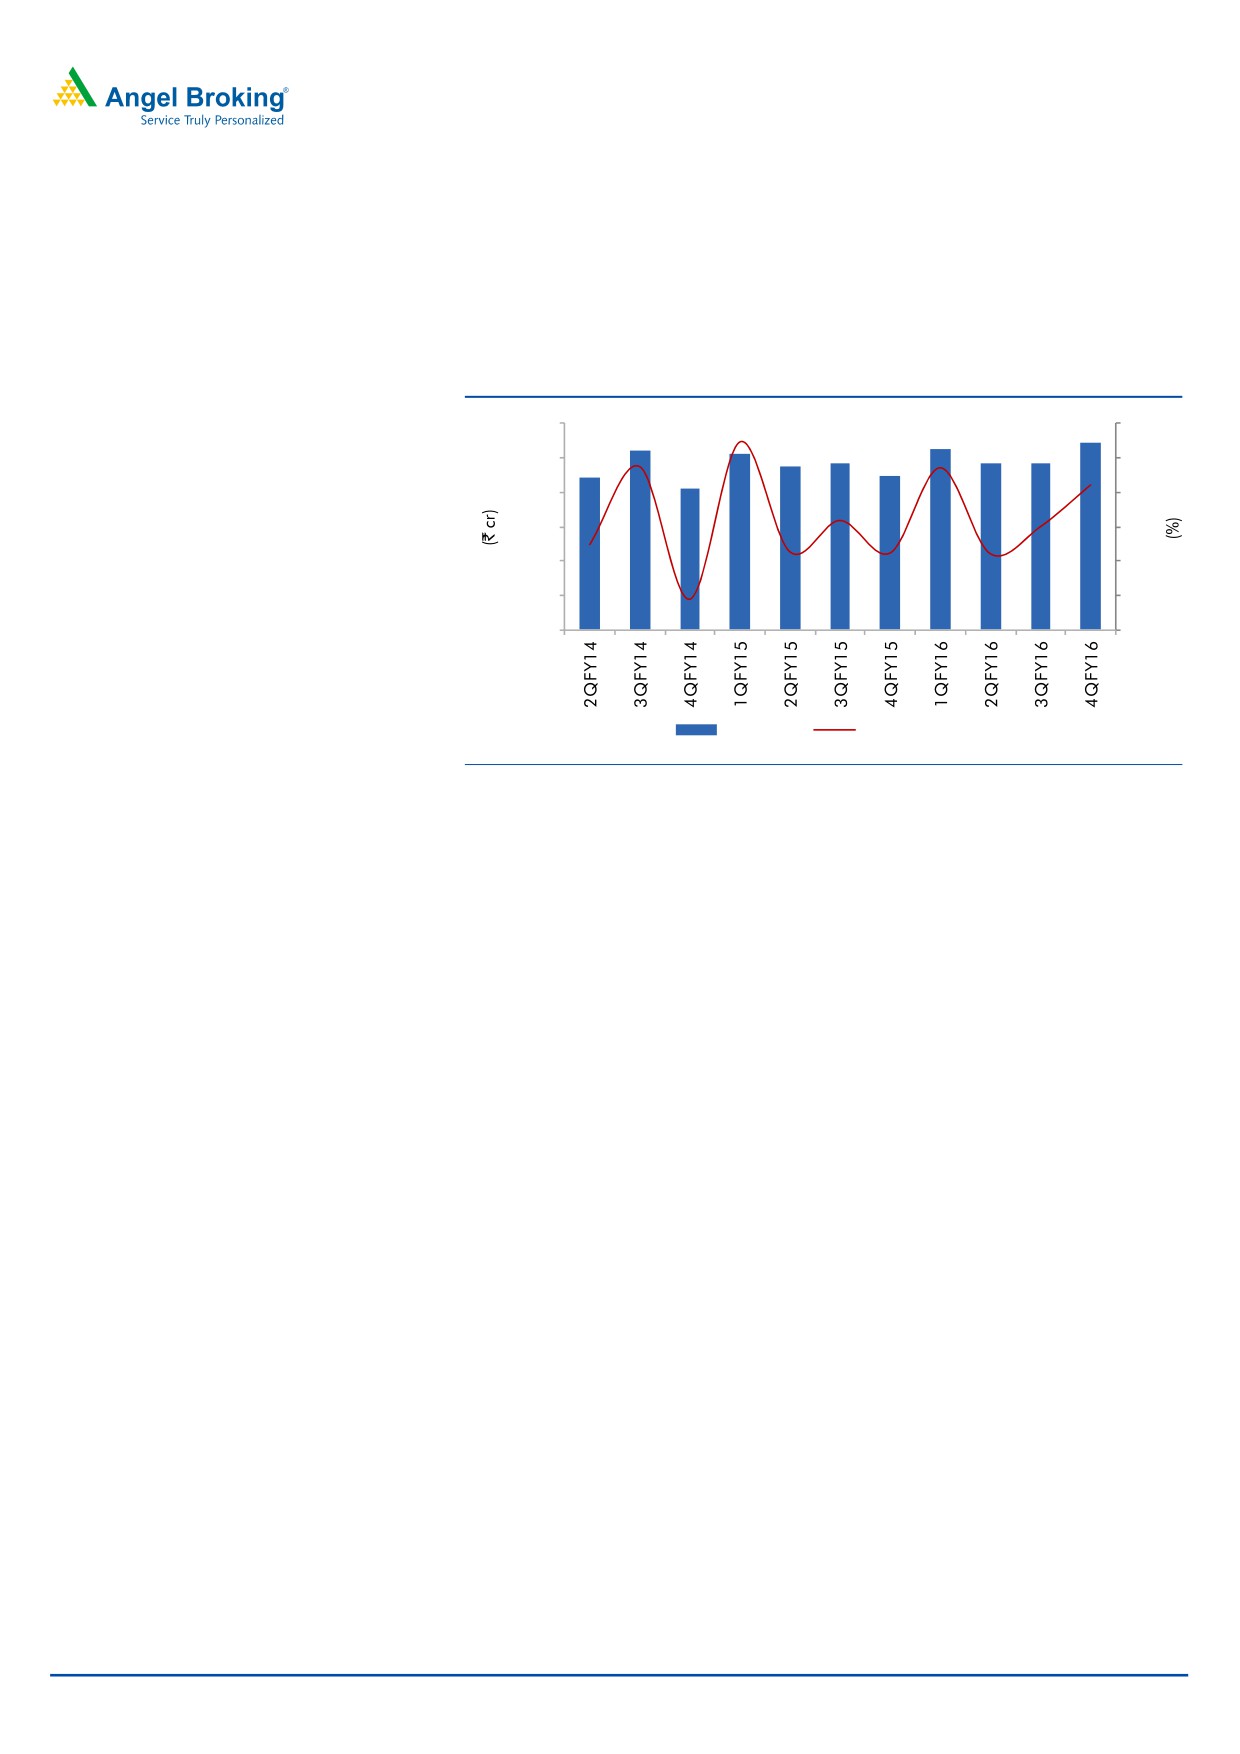
Reported PAT grew ~7% yoy
On the bottom-line front, the company reported a modest net profit growth of
7% yoy on back of volume growth of 4% and aided by an overall improvement in
the operating margin.
Exhibit 5: Net Profit and growth trend
1,200
30
1,000
20
800
10
600
-
400
(10)
200
(20)
0
(30)
Net Profit
QOQ growth (%)
Source: Company, Angel Research
May 11, 2016
5
Hindustan Unilever | 4QFY2016 Result Update
Investment rationale
Largest FMCG player with leadership in several categories
HUL has presence across various product categories and has brands in both mass
and premium segments in most of these categories. The company’s products are
available at multiple price points and it is a leader in many of the categories in
which it has presence.
Outlook and valuation
We expect HUL to post a ~8% and ~8% CAGR in its top-line and bottom-line
respectively, over FY2016-18E. At the current market price, the stock is trading at
38.9x FY2018E earnings. We maintain our Neutral view on the stock.
Company background
HUL, a 52% subsidiary of Unilever, is one of India's largest consumer goods
companies. HUL is present across four main product categories - 1) Soaps and
Detergents (50% of revenue); 2) Personal Products (mainly shampoos, skin care
and toothpaste; 30% of revenue); 3) Beverages (mainly tea and coffee; 12% of
revenue); 4) Packaged Foods and Ice cream (6% of revenue); and 5) Others
(mainly consisting of water purifiers). The company, with its iconic brands such as
Lux, Lifebuoy, Surf Excel, Rin, Wheel, Fair & Lovely, Pond's, Vaseline, Lakmé, Dove,
Clinic Plus, Sunsilk, Pepsodent, Close Up, Axe, Brooke Bond, Bru, Knorr, Kissan and
Walls, has a vast presence in rural as well as urban Indian markets, with one of the
largest distribution networks spanning over 6.3mn retail outlets.
May 11, 2016
6
Hindustan Unilever | 4QFY2016 Result Update
Consolidated Profit & Loss Statement
Y/E March (` cr)
FY2013
FY2014
FY2015
FY2016
FY2017E
FY2018E
Total operating income
27,004
29,234
31,972
33,194
35,716
39,002
% chg
15.2
8.3
9.4
3.8
7.6
9.2
Total Expenditure
22,799
24,488
26,558
27,283
29,430
32,216
Raw Materials
14,087
14,870
16,176
15,866
17,394
18,838
Selling & Administrative Exp
3,290
3,675
3,944
4,595
4,536
5,031
Personnel Expenses
1,413
1,573
1,724
1,742
2,072
2,340
Others Expenses
4,009
4,371
4,715
5,079
5,429
6,006
EBITDA
4,205
4,746
5,414
5,911
6,286
6,786
% chg
20.7
12.8
14.1
9.2
6.3
8.0
(% of Net Sales)
15.6
16.2
16.9
17.8
17.6
17.4
Depreciation& Amortisation
251
296
322
357
377
407
EBIT
3,954
4,450
5,091
5,554
5,909
6,379
% chg
21.7
12.5
14.4
9.1
6.4
8.0
(% of Net Sales)
14.6
15.2
15.9
16.7
16.5
16.4
Interest & other Charges
26
41
18
5
5
5
Other Income
1,138
806
1,246
397
600
600
(% of PBT)
22.5
15.4
19.7
6.7
9.2
8.6
Share in profit of Associates
-
-
-
-
-
-
PBT (reported)
5,066
5,215
6,320
5,947
6,505
6,975
Tax
1,227
1,259
1,944
1,852
2,016
2,162
(% of PBT)
24.2
24.1
30.8
31.2
31.0
31.0
PAT (reported)
3,839
3,956
4,376
4,094
4,488
4,813
Less: Minority interest (MI)
10
10
12
12
12
13
PAT after MI (reported)
3,829
3,946
4,363
4,082
4,476
4,800
Prior Period & Extra. Exp./(Inc.)
459
179
470
(27)
-
-
ADJ. PAT
3,370
3,767
3,893
4,109
4,476
4,800
% chg
24.7
11.8
3.3
5.6
8.9
7.2
(% of Net Sales)
12.5
12.9
12.2
12.4
12.5
12.3
Basic & diluted EPS (`)
15.6
17.4
18.0
19.0
20.7
22.2
Adjusted EPS EPS (`)
15.6
17.4
18.0
19.0
20.7
22.2
% chg
24.7
11.8
3.3
5.6
8.9
7.2
May 11, 2016
7
Hindustan Unilever | 4QFY2016 Result Update
Consolidated Balance Sheet
Y/E March (` cr)
FY2013
FY2014
FY2015
FY2016E FY2017E FY2018E
SOURCES OF FUNDS
Equity Share Capital
216
216
216
216
216
216
Reserves& Surplus
2,649
3,321
3,805
4,452
5,169
5,936
Shareholders Funds
2,865
3,537
4,022
4,669
5,385
6,153
Minority Interest
21
22
25
25
25
25
Total Loans
25
46
43
255
255
255
Deferred Tax Liability
218
241
278
278
278
278
Total Liabilities
3,128
3,846
4,367
5,226
5,942
6,710
APPLICATION OF FUNDS
Gross Block
4,418
5,079
5,412
5,712
6,062
6,462
Less: Acc. Depreciation
1,986
2,333
2,591
2,948
3,325
3,732
Net Block
2,431
2,746
2,821
2,764
2,737
2,730
Capital Work-in-Progress
222
373
516
516
516
516
Investments
2,252
2,838
3,025
3,025
3,025
3,025
Current Assets
6,977
7,617
7,869
8,689
10,019
11,620
Inventories
2,706
2,940
2,849
2,910
3,131
3,419
Sundry Debtors
997
1,017
1,011
1,091
1,174
1,282
Cash
1,901
2,516
2,689
3,028
3,749
4,383
Loans & Advances
655
598
731
996
1,250
1,560
Other Assets
718
547
588
664
714
975
Current liabilities
9,181
10,149
10,341
10,245
10,832
11,658
Net Current Assets
(2,204)
(2,531)
(2,472)
(1,556)
(813)
(38)
Deferred Tax Asset
426
421
477
477
477
477
Mis. Exp. not written off
-
-
-
-
-
-
Total Assets
3,128
3,846
4,367
5,226
5,942
6,710
May 11, 2016
8
Hindustan Unilever | 4QFY2016 Result Update
Consolidated Cashflow Statement
Y/E March (` cr)
FY2013
FY2014
FY2015
FY2016E FY2017E FY2018E
Profit before tax
4,460
4,980
5,640
5,947
6,505
6,975
Depreciation
251
296
322
357
377
407
Change in Working Capital
429
429
405
(342)
(603)
(57)
Interest / Dividend (Net)
(140)
(290)
(258)
(225)
5
5
Direct taxes paid
(1,074)
(1,384)
(2,030)
(1,852)
(2,016)
(2,162)
Others
(323)
(212)
(957)
(22)
538
(96)
Cash Flow from Operations
3,605
3,818
3,124
3,863
4,805
5,071
(Inc.)/ Dec. in Fixed Assets
(7)
111
493
(300)
(350)
(400)
(Inc.)/ Dec. in Investments
70
(586)
(187)
-
-
-
Cash Flow from Investing
63
(475)
306
(300)
(350)
(400)
Issue of Equity
7
2
2
-
-
-
Inc./(Dec.) in loans
25
(15)
(3)
212
-
-
Dividend Paid (Incl. Tax)
(4,000)
(2,811)
(3,245)
(3,452)
(3,760)
(4,032)
Interest / Dividend (Net)
212
98
(9)
15
26
(5)
Cash Flow from Financing
(3,764)
(2,728)
(3,256)
(3,224)
(3,734)
(4,037)
Inc./(Dec.) in Cash
(96)
615
173
338
721
634
Opening Cash balances
1,996
1,901
2,516
2,689
3,028
3,749
Closing Cash balances
1,901
2,516
2,689
3,028
3,749
4,383
May 11, 2016
9
Hindustan Unilever | 4QFY2016 Result Update
Key Ratios
Y/E March
FY2013
FY2014
FY2015 FY2016E FY2017E FY2018E
Valuation Ratio (x)
P/E (on FDEPS)
55.4
49.5
47.9
45.4
41.7
38.9
P/CEPS
45.6
43.9
39.7
41.9
38.3
35.7
P/BV
65.1
52.7
46.4
40.0
34.6
30.3
Dividend yield (%)
2.1
1.5
1.7
1.9
2.0
2.2
EV/Sales
6.8
6.2
5.7
5.4
5.0
4.6
EV/EBITDA
43.4
38.2
33.4
30.6
28.6
26.4
EV / Total Assets
14.8
12.9
12.3
11.7
10.7
9.8
Per Share Data (`)
EPS (Basic)
15.6
17.4
18.0
19.0
20.7
22.2
EPS (fully diluted)
15.6
17.4
18.0
19.0
20.7
22.2
Cash EPS
18.9
19.6
21.7
20.6
22.5
24.1
DPS
18.5
13.0
15.0
16.0
17.4
18.6
Book Value
13.2
16.3
18.6
21.6
24.9
28.4
Returns (%)
ROCE
136.8
124.2
125.3
112.8
104.8
99.6
ROE
133.7
111.5
108.5
87.4
83.1
78.0
Turnover ratios (x)
Asset Turnover (Gross Block)
6.1
5.8
5.9
5.8
5.9
6.0
Inventory / Sales (days)
37
37
33
32
32
32
Receivables (days)
13
13
12
12
12
12
Payables (days)
58
62
58
58
57
57
WC cycle (ex-cash) (days)
(8)
(12)
(14)
(14)
(13)
(13)
May 11, 2016
10
Hindustan Unilever | 4QFY2016 Result Update
Research Team Tel: 022 - 39357800
DISCLAIMER
Angel Broking Private Limited (hereinafter referred to as “Angel”) is a registered Member of National Stock Exchange of India Limited,
Bombay Stock Exchange Limited and Metropolitian Stock Exchange of India Limited. It is also registered as a Depository Participant
with CDSL and Portfolio Manager with SEBI. It also has registration with AMFI as a Mutual Fund Distributor. Angel Broking Private
Limited is a registered entity with SEBI for Research Analyst in terms of SEBI (Research Analyst) Regulations, 2014 vide registration
number INH000000164. Angel or its associates has not been debarred/ suspended by SEBI or any other regulatory authority for
accessing /dealing in securities Market. Angel or its associates including its relatives/analyst do not hold any financial
interest/beneficial ownership of more than 1% in the company covered by Analyst. Angel or its associates/analyst has not received any
compensation / managed or co-managed public offering of securities of the company covered by Analyst during the past twelve
months. Angel/analyst has not served as an officer, director or employee of company covered by Analyst and has not been engaged in
market making activity of the company covered by Analyst.
This document is solely for the personal information of the recipient, and must not be singularly used as the basis of any investment
decision. Nothing in this document should be construed as investment or financial advice. Each recipient of this document should
make such investigations as they deem necessary to arrive at an independent evaluation of an investment in the securities of the
companies referred to in this document (including the merits and risks involved), and should consult their own advisors to determine
the merits and risks of such an investment.
Reports based on technical and derivative analysis center on studying charts of a stock's price movement, outstanding positions and
trading volume, as opposed to focusing on a company's fundamentals and, as such, may not match with a report on a company's
fundamentals.
The information in this document has been printed on the basis of publicly available information, internal data and other reliable
sources believed to be true, but we do not represent that it is accurate or complete and it should not be relied on as such, as this
document is for general guidance only. Angel Broking Pvt. Limited or any of its affiliates/ group companies shall not be in any way
responsible for any loss or damage that may arise to any person from any inadvertent error in the information contained in this report.
Angel Broking Pvt. Limited has not independently verified all the information contained within this document. Accordingly, we cannot
testify, nor make any representation or warranty, express or implied, to the accuracy, contents or data contained within this document.
While Angel Broking Pvt. Limited endeavors to update on a reasonable basis the information discussed in this material, there may be
regulatory, compliance, or other reasons that prevent us from doing so.
This document is being supplied to you solely for your information, and its contents, information or data may not be reproduced,
redistributed or passed on, directly or indirectly.
Neither Angel Broking Pvt. Limited, nor its directors, employees or affiliates shall be liable for any loss or damage that may arise from
or in connection with the use of this information.
Note: Please refer to the important ‘Stock Holding Disclosure' report on the Angel website (Research Section). Also, please refer to the
latest update on respective stocks for the disclosure status in respect of those stocks. Angel Broking Pvt. Limited and its affiliates may
have investment positions in the stocks recommended in this report.
Disclosure of Interest Statement
Hindustan Unilever
1. Analyst ownership of the stock
No
2. Angel and its Group companies ownership of the stock
No
3. Angel and its Group companies' Directors ownership of the stock
No
4. Broking relationship with company covered
No
Note: We have not considered any Exposure below ` 1 lakh for Angel, its Group companies and Directors
Ratings (Based on expected returns
Buy (> 15%)
Accumulate (5% to 15%)
Neutral (-5 to 5%)
over 12 months investment period):
Reduce (-5% to -15%)
Sell (< -15%)
May 11, 2016
11