3QFY2017 Result Update | Banking
January 31, 2017
HDFC Bank
ACCUMULATE
CMP
`1,285
Performance Highlights
Target Price
`1,375
Particulars (` cr) 3QFY17
2QFY17
% chg (qoq)
3QFY16
% chg (yoy)
Investment Period
12 Months
NII
8,309
7,994
3.9
7,069
17.6
Pre-prov. profit
6,609
6,025
9.7
5,736
15.2
Stock Info
PAT
3,865
3,455
11.9
3,357
15.1
Source: Company, Angel Research
Sector
Banks
HDFC Banks’ results for the quarter were broadly in line with expectations.
Market Cap (` cr)
328,327
While PAT growth of 15% YoY looks lower when compared to the historical
Beta
0.8
trend of HDFC Bank, given the slow down due to demonetisation the results
52 Week High / Low
1318/929
by HDFC can be considered decent enough.
Avg. Daily Volume
136,732
Advances growth moderated further, but in line with expectations: Domestic loan
books grew by 17.5% YoY, with retail loans growing by 17.9% YoY. However
Face Value (`)
2
repayment of overseas loans to the tune of $ 2 Bn linked to FCNR deposit
BSE Sensex
27,850
impacted the overall loan growth which was 13.4% YoY. There is visible sign of
moderation in the loan growth, as the growth rate has moderated from 20%+ for
Nifty
8,633
several quarters. We believe for HDFC Bank now the medium term loan growth
Reuters Code
HDBK.BO
would be 17-18% YoY.
Bloomberg Code
HDFCB@IN
Deposit growth remained strong, backed by high CASA growth: During the
quarter the bank saw redemption of $3 Bn worth of FCNR linked deposits and
despite this the overall deposit grew by 21.1% YoY,7.3% QoQ. Backed by
Shareholding Pattern (%)
demonetization the CASA growth were strong up 37.4% YoY,20.4% QoQ and
CASA ratio surged to 45.4% vs 40.4% QoQ.
Promoters
21.3
CASA growth to help in lower cost of funds and stable NIM going ahead:
MF / Banks / Indian Fls
18.5
During the quarter NIM further contracted by 10 bps QoQ to 4.1%, after a
20 bps drop in 2QFY17. However we feel lower cost funds backed by high
FII / NRIs / OCBs
50.7
CASA ratio should help in stable NIM here onwards. Despite the recent drop
Indian Public / Others
9.5
HDFC Bank continues to have one of the best NIM in the industry.
Continues to have one of the best asset quality: What is worth noting is that
this quarter again HDFC Bank has been able to maintain a stable set of
Abs.(%)
3m 1yr 3yr
asset quality with GNPAs at 1.05% vs 1.02% QoQ and NNPAs at 0.32% vs
Sensex
(0.3)
12.0
35.9
0.30% QoQ and we don’t see this worsening in the near term. Credit cost for
the bank continues to be under control and with improving macro scenario
HDFCB
2.5
22.5
103.2
and lower interest rates it is likely to remain stable in the medium term.
Outlook and valuation: While HDFC Bank’s growth has moderated from its
historical levels, it still remains much higher than the industry rate and asset
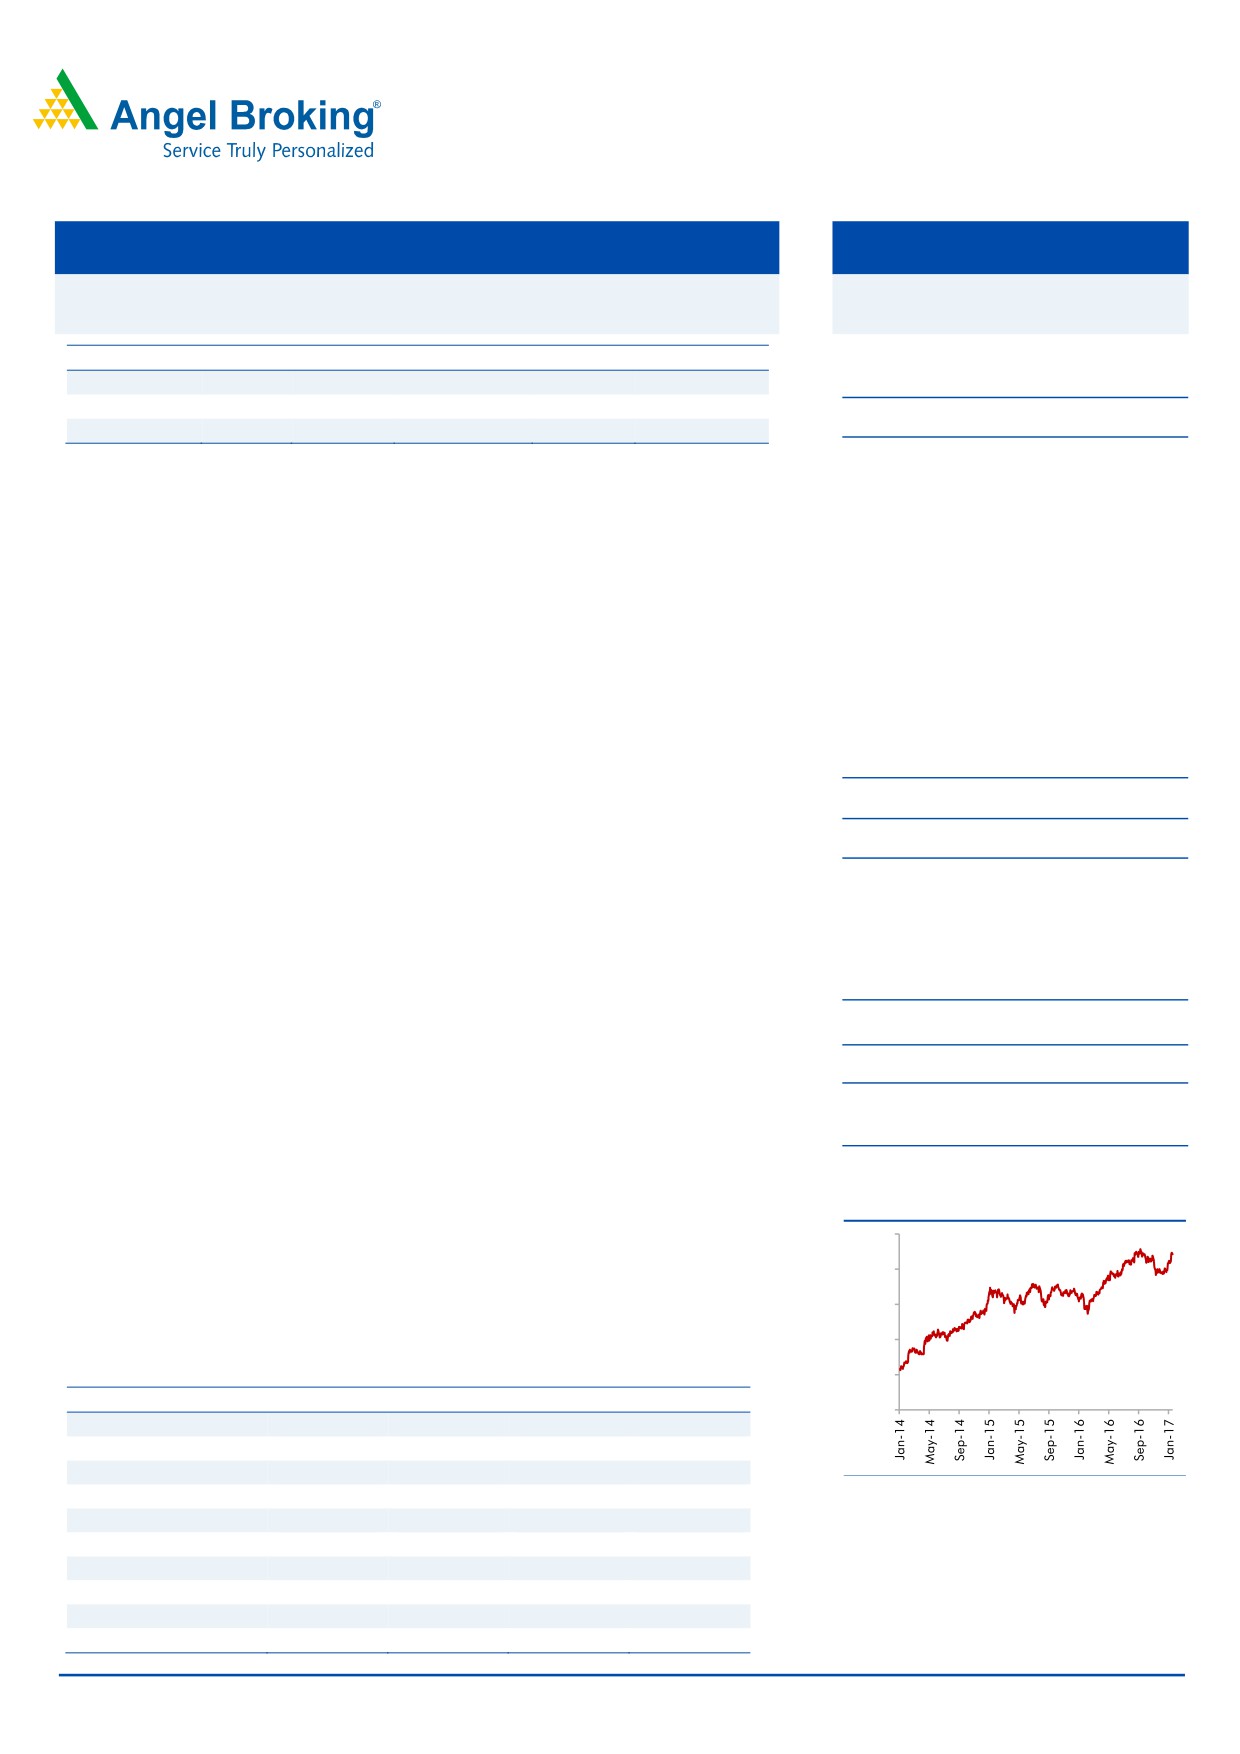
3-year price chart
quality has been the best in class. While in the near term the stock might range
1,400
bound, well capitalized balance sheet and superior return ratios should result in
1,200
investors sticking to the stock in the long run. At the current market price, the
1,000
bank is trading at 3.2x FY2017E ABV. We Maintain ACCUMULATE rating, on the
stock, with a target price of `1,375.
800
Key financials (standalone)
600
Y/E March (` cr)
FY2015
FY2016
FY2017E
FY2018E
400
NII
22,329
27,592
33,290
40,010
% chg
20.8
23.6
20.7
20.2
Net profit
10,150
12,296
14,584
16,915
% chg
19.7
21.2
18.6
16.0
Source: Company, Angel Research
NIM (%)
4.4
4.5
4.6
4.8
EPS (`)
40.5
48.6
57.1
66.2
P/E (x)
31.4
26.1
22.3
19.2
P/ABV (x)
5.2
4.5
3.9
3.2
Siddharth Purohit
RoA (%)
1.9
1.9
1.9
1.8
022 - 3935 7800 Ext: 6872
RoE (%)
19.2
18.3
18.4
18.1
Source: Company, Angel Research; Note: CMP as of January 30, 2017
Please refer to important disclosures at the end of this report
1
HDFC Bank | 3QFY2017 Result Update
Exhibit 1: 3QFY2017 performance (standalone)
Particulars (` cr)
3QFY17
2QFY17
% chg (qoq)
3QFY16
% chg (yoy) 9MFY2017 9MFY2016
% chg
Interest earned
17,606
17,070
3.1
15,411
14.2
51,191
44,225
15.8
- on Advances / Bills
13,176
12,901
2.1
11,483
14.7
38,548
32,879
17.2
- on investments
4,049
3,818
6.1
3,651
10.9
11,676
10,330
13.0
- on balance with RBI & others
187
140
33.8
60
214.0
367
313
17.3
- on others
194
211
(8.1)
217
(10.6)
600
703
-14.6
Interest Expended
9,297
9,076
2.4
8,343
11.4
27,107
24,087
12.5
Net Interest Income
8,309
7,994
3.9
7,069
17.6
24,084
20,138
19.6
Other income
3,143
2,901
8.3
2,872
9.4
8,850
7,886
12.2
Other income excl. treasury
2,207
2,104
4.9
2,005
10.1
6,289
5,587
12.6
- Fee & commission income
399
284
40.6
277
43.7
907
945
-4.1
- Treasury income
297
295
0.7
328
(9.4)
959
616
55.6
- Forex & derivative income
240
219
9.8
262
(8.4)
696
738
-5.7
Operating income
11,452
10,895
5.1
9,941
15.2
32,934
28,024
17.5
Operating expenses
4,843
4,870
(0.6)
4,205
15.2
14,481
12,395
16.8
- Employee expenses
1,689
1,657
1.9
1,431
18.0
4,931
4,204
17.3
- Other Opex
3,154
3,213
(1.8)
2,774
13.7
9,550
8,191
16.6
Pre-provision Profit
6,609
6,025
9.7
5,736
15.2
18,453
15,629
18.1
Provisions & Contingencies
716
749
(4.4)
654
9.5
2,332
2063
13.0
PBT
5,893
5,276
11.7
5,082
16.0
16,121
13,565
18.8
Provision for Tax
2,028
1,820
11.4
1,725
17.6
5,562
4,643
19.8
PAT
3,865
3,455
11.9
3,357
15.1
10,559
8,922
18.3
Effective Tax Rate (%)
33
33
34
34.5
34.2
Source: Company, Angel Research
January 31, 2017
2
HDFC Bank | 3QFY2017 Result Update
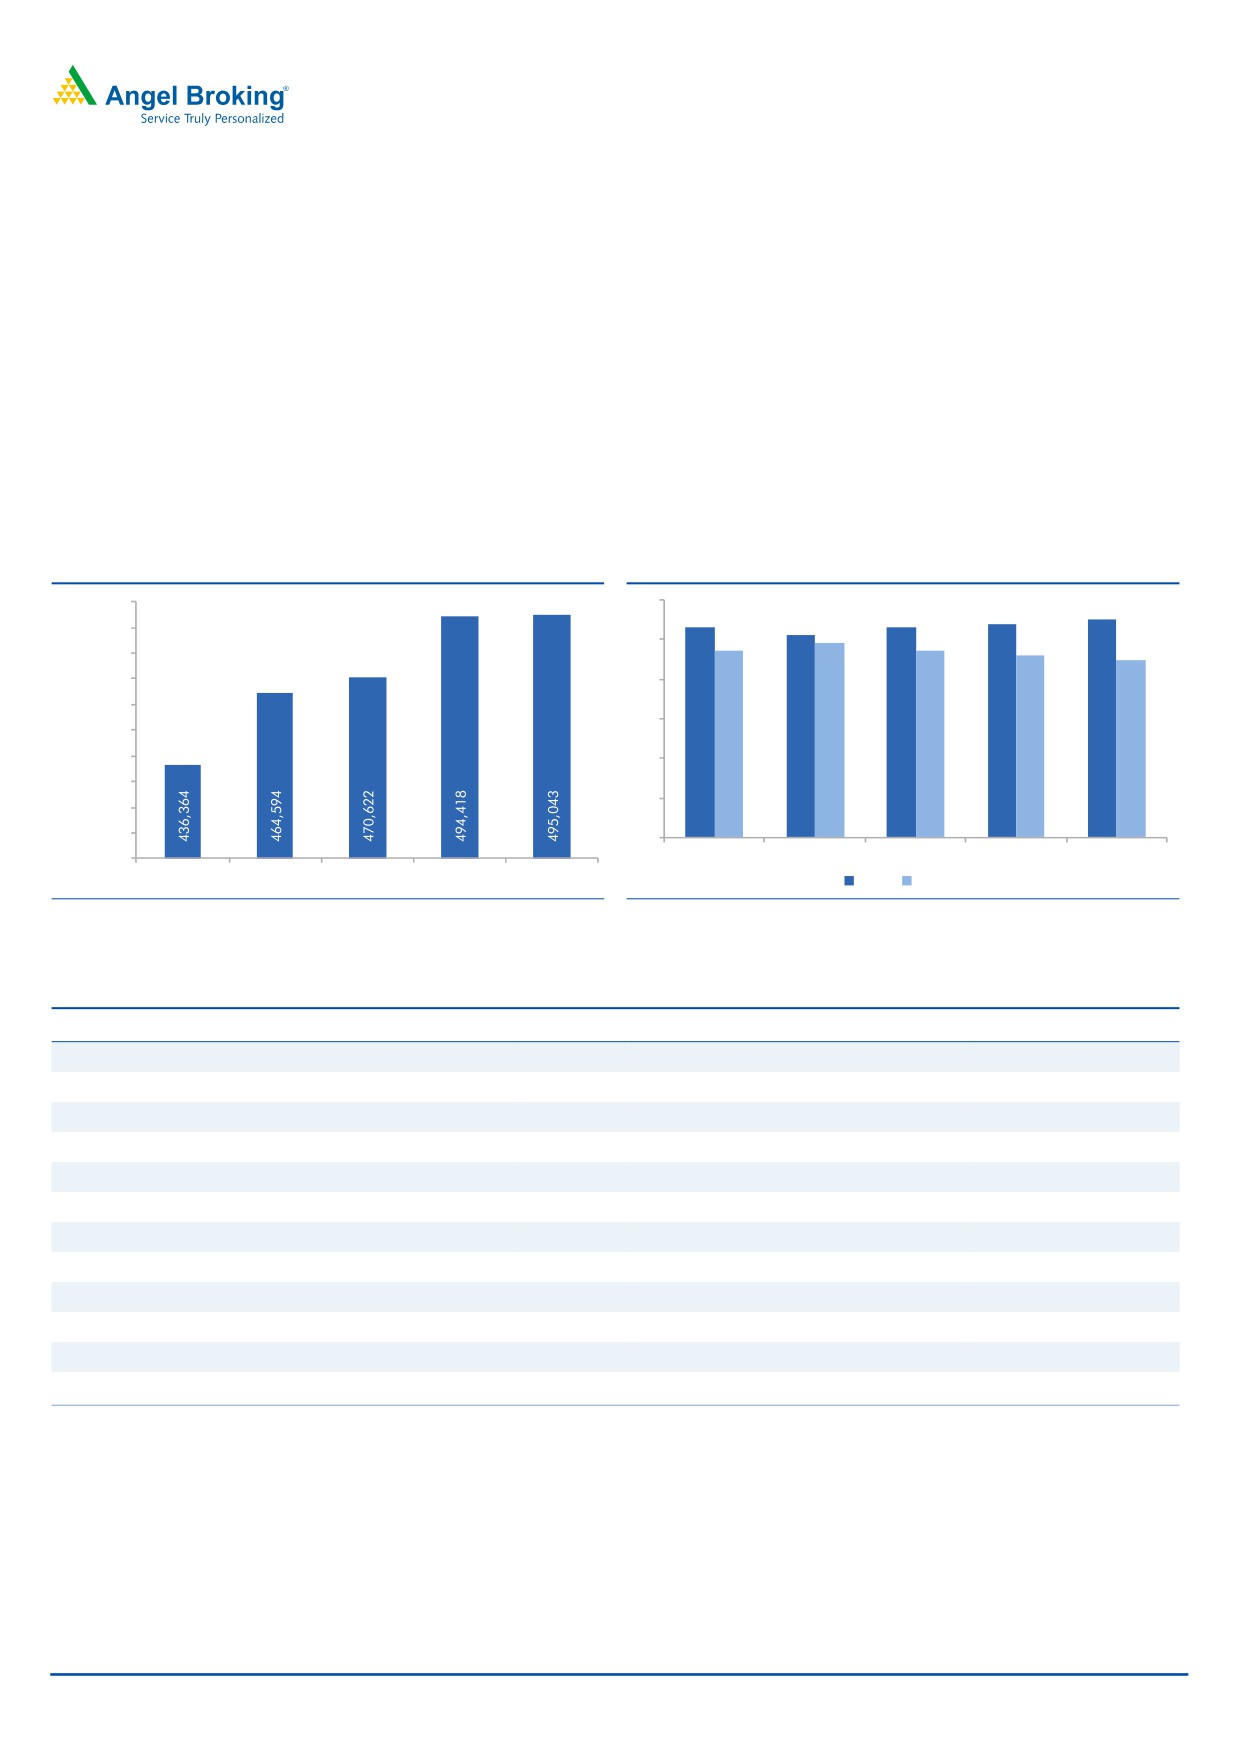
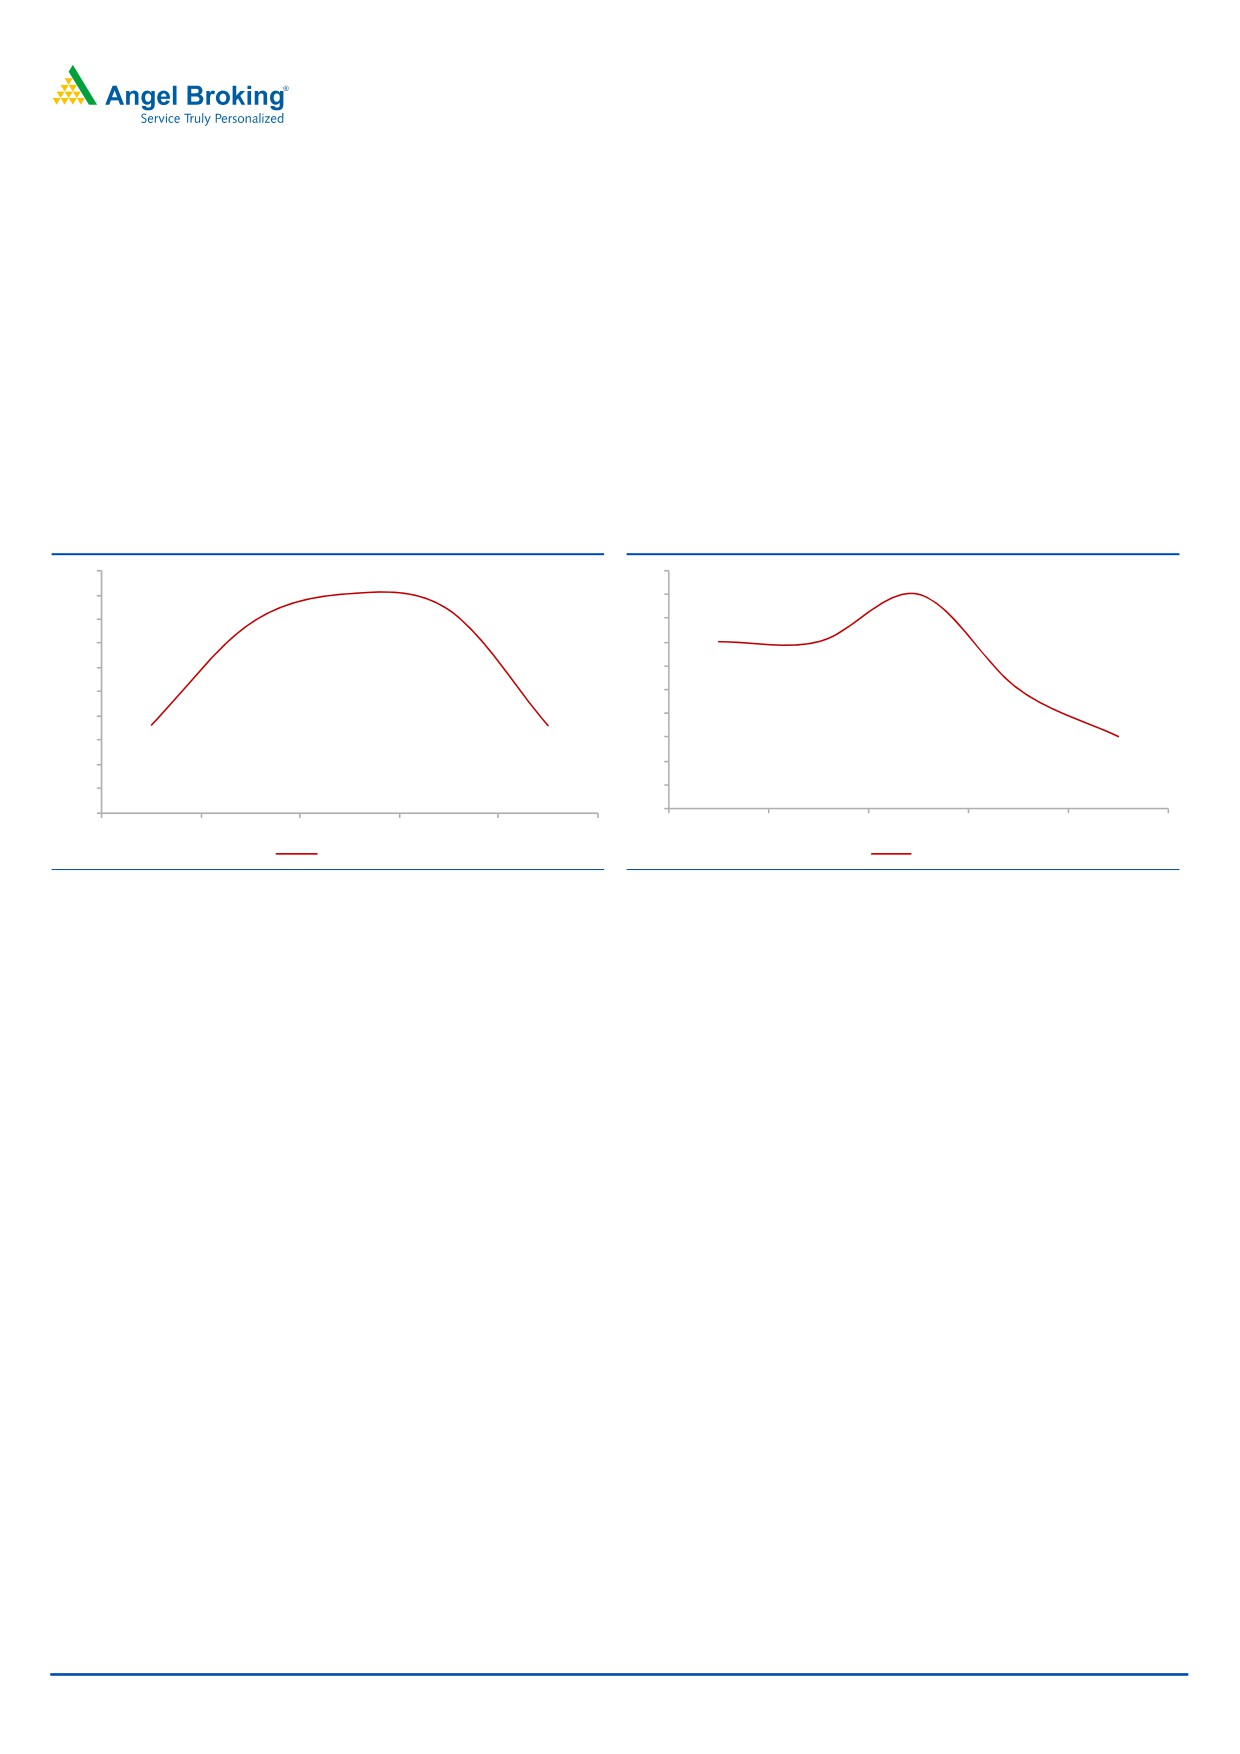
Advances growth moderated further, but in line with expectations: Domestic loan
books grew by 17.5% YoY, with retail loans growing by 17.9% YoY. However
repayment of overseas loans to the tune of $ 2 Bn linked to FCNR deposit
impacted the overall loan growth which was 13.4% YoY. There is visible sign of
moderation in the loan growth, as the growth rate has moderated from 20%+ for
several quarters. However, the lower interest rates across products will now help in
incremental demand picking up in a gradual way. Though credit growth has
moderated for HDFC Bank from its historical highs, it still is best placed to capture
the upcoming demand in the retail space. The bank continues to be a formidable
player in the personal loans segment, further home loans and credit cards
segment also grew quite strong during the quarter.
Exhibit 2: Advances growth moderated (` cr)
Exhibit 3: Retail continues to drive the growth (%)
500,000
60
55
53
53
54
51
490,000
49
47
47
46
45
50
480,000
470,000
40
460,000
30
450,000
440,000
20
430,000
10
420,000
410,000
0
400,000
Q3FY16
Q4FY16
Q1FY17
Q2FY17
Q3FY17
Q3FY16
Q4FY16
Q1FY17
Q2FY17
Q3FY17
Retail
Wholesale
Source: Company, Angel Research
Source: Company, Angel Research
Exhibit 4: Break Up Of Domestic Retail Bank
(` Cr)
Q3FY16
Q4FY16
Q1FY17
Q2FY17
Q3FY17
% YoY
% QoQ
Auto
56,321
57,281
59,561
64,429
65,545
16.4%
1.7%
Personal Loans
35,494
37,704
41,059
45,024
46,826
31.9%
4.0%
Home Loans
28,435
31,860
33,605
33,574
35,423
24.6%
5.5%
Business Banking
59,603
61,089
60,444
65,794
63,582
6.7%
-3.4%
Kisan Gold Card
20,095
22,934
22,403
24,881
23,888
18.9%
-4.0%
Credit Cards
19,689
20,520
21,255
21,336
23,673
20.2%
11.0%
CV/CE
29,768
30,935
31,461
33,561
34,526
16.0%
2.9%
Others
13,344
14,644
15,151
16,276
16,190
21.3%
-0.5%
Two Wheelers
6,107
6,383
6,614
7,118
7,107
16.4%
-0.2%
Gold Loans
4,400
4,586
4,876
5,093
4,818
9.5%
-5.4%
Loan Against Securities
1,656
1,897
1,886
2,052
2,249
35.8%
9.6%
Total
274,912
289,833
298,315
319,138
323,827
17.8%
1.5%
Source: Company, Angel Research
January 31, 2017
3
HDFC Bank | 3QFY2017 Result Update
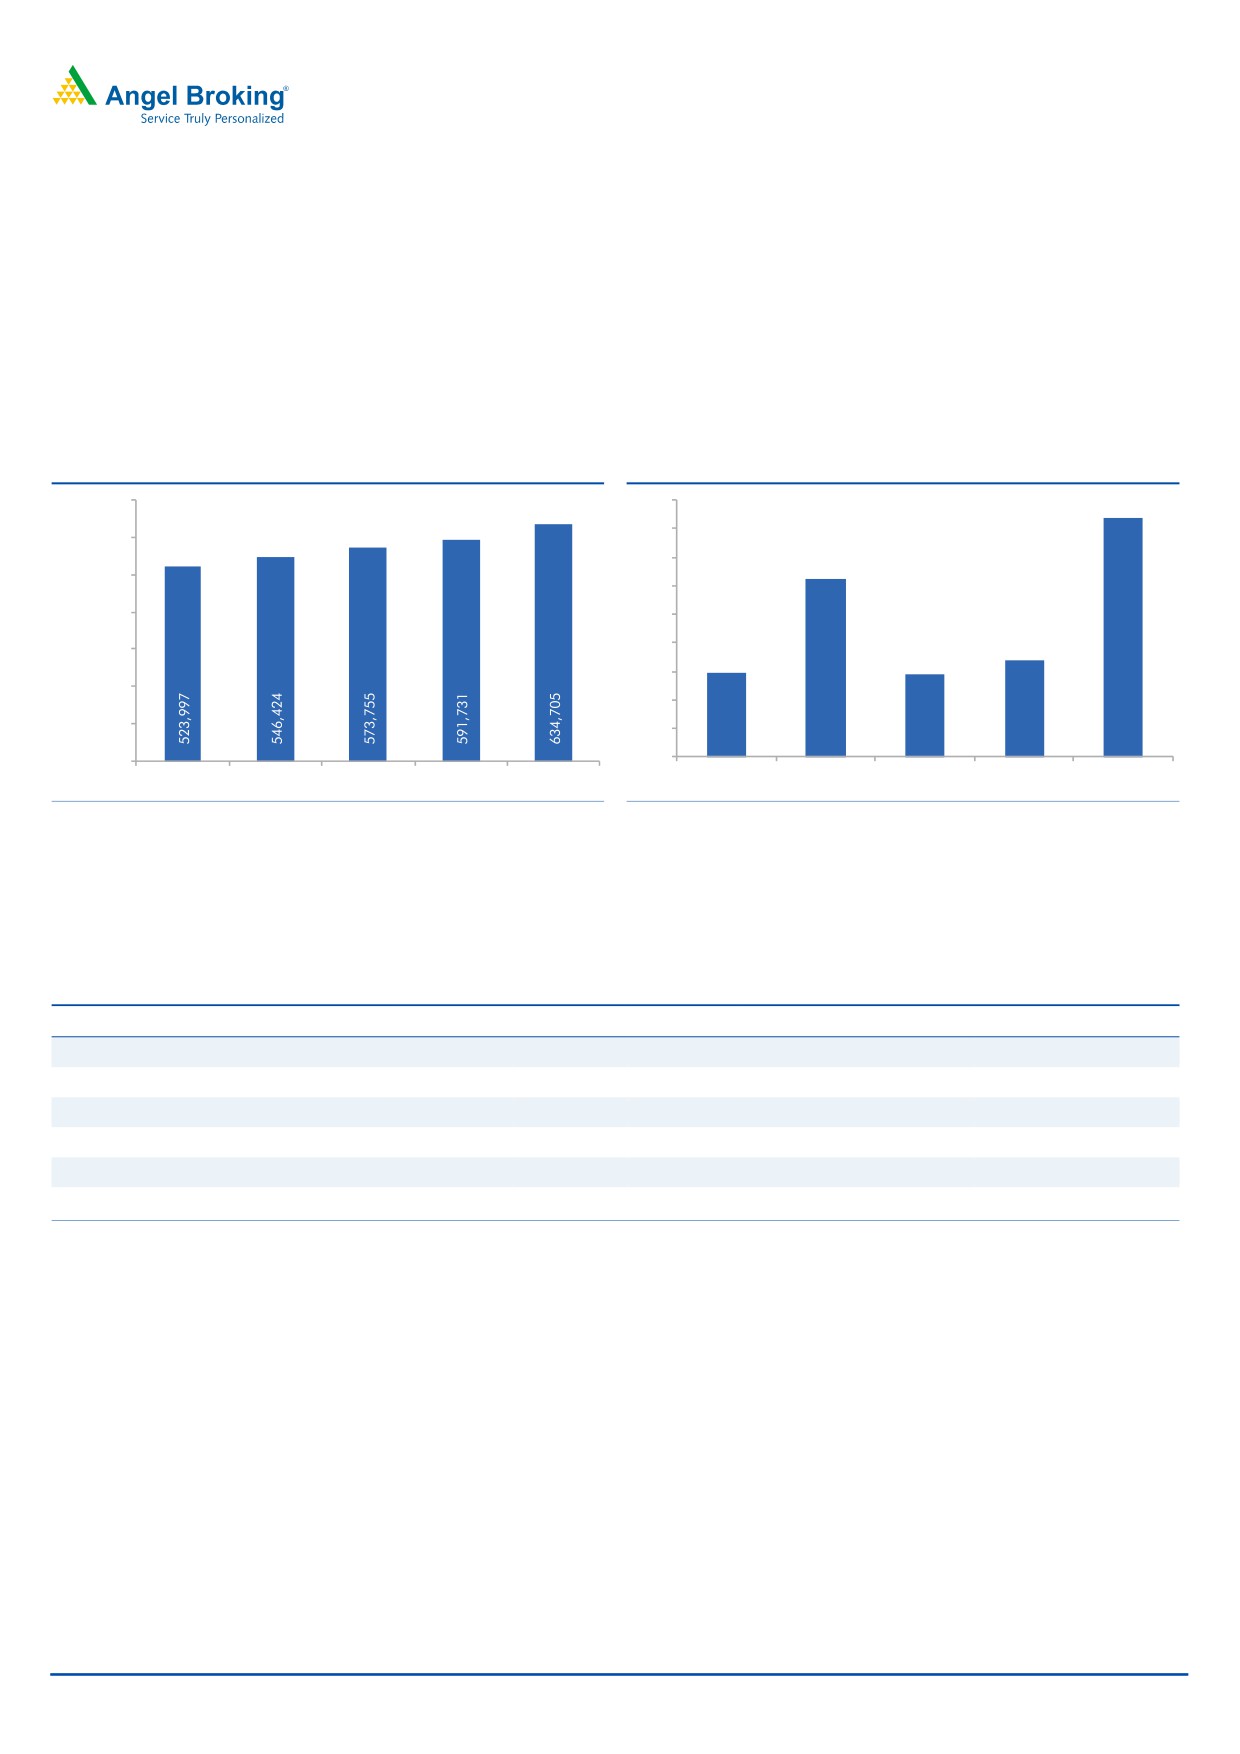
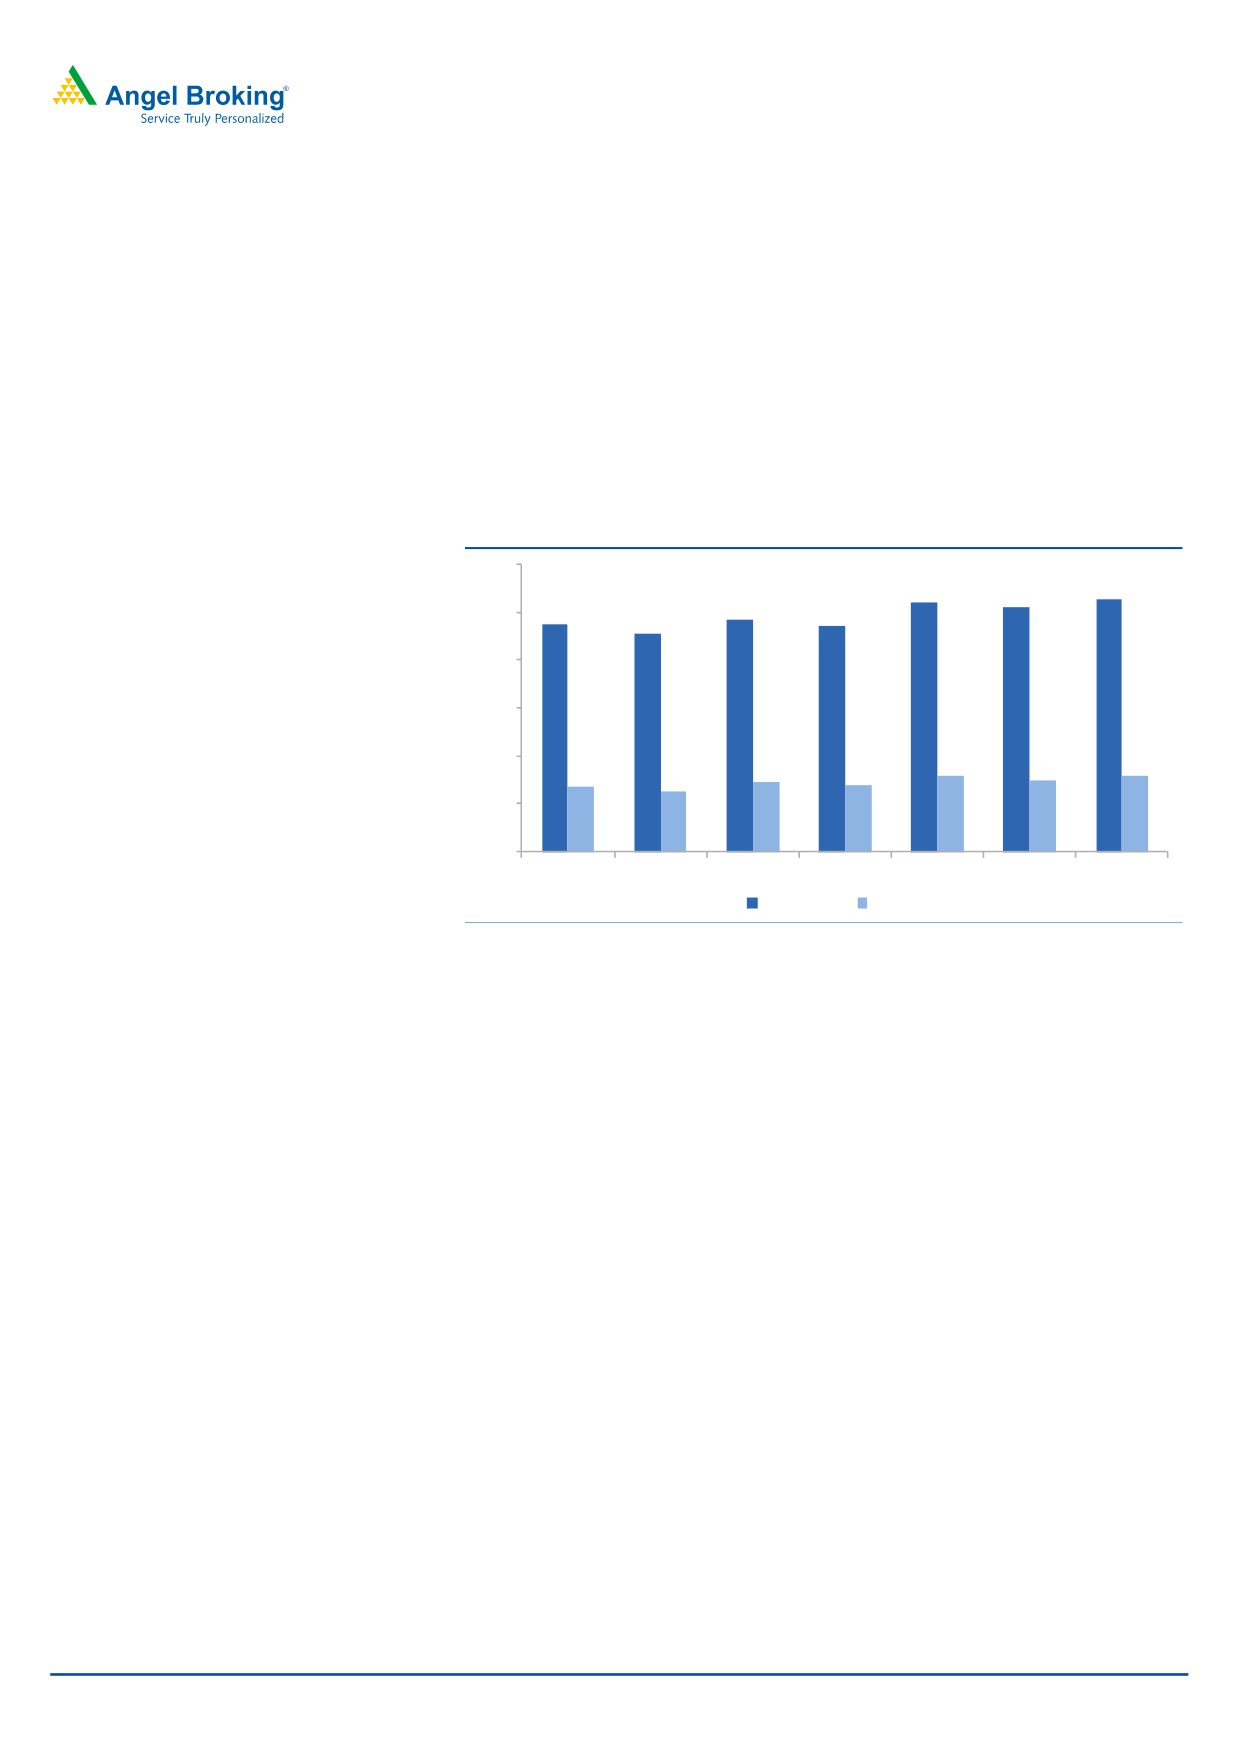
Deposit growth remained strong, backed by high CASA growth: During the quarter
the bank saw redemption of $3 Bn worth of FCNR linked deposits and despite this
the overall deposit grew by 21.1% YoY,7.3% QoQ. Without considering the
redemption the growth in deposit would have been over 25% YoY Backed by
demonetization the CASA growth were strong up 37.4% YoY,20.4% QoQ and
CASA ratio surged to 45.4% vs 40.4% QoQ. While in the coming quarters there
could be some outflow of deposits from CASA to the term deposits, despite this the
CASA ratio of the bank would still be one of the highest in the industry.
Exhibit 5: Deposit growth trend (` cr)
Exhibit 6: CASA ratio jumped sharply QoQ (%)
700,000
46.0
45.4
45.0
600,000
44.0
43.2
500,000
43.0
400,000
42.0
41.0
40.4
300,000
40.0
39.9
40.0
200,000
39.0
100,000
38.0
-
37.0
Q3FY16
Q4FY16
Q1FY17
Q2FY17
Q3FY17
Q3FY16
Q4FY16
Q1FY17
Q2FY17
Q3FY17
Source: Company, Angel Research, Note: *adjusting for FCNR (B) deposits
Source: Company, Angel Research
Other income for the bank saw moderation during the quarter growing by only
9.4% YoY. The core fee income also moderated, growing by only 9.4% YoY, which
can be attributed to the relatively lower growth in the loan book.
Exhibit 7: Other Income
(` Cr)
Q3FY16
Q4FY16
Q1FY17
Q2FY17
Q3FY17
% YoY
% QoQ
Fees Income
2,005
2,172
1,978
2,104
2,207
10.1%
4.9%
Forex
277
283
315
295
297
7.1%
0.7%
Profit on sale of investments
328
116
277
284
399
21.6%
40.6%
NPA Recovery
262
295
237
219
240
(8.4%)
9.8%
Other Income
2,872
2,866
2,807
2,901
3,143
9.4%
8.3%
Fee Income as % of Other Income
70%
76%
70%
73%
70%
Source: Company, Angel Research
January 31, 2017
4
HDFC Bank | 3QFY2017 Result Update
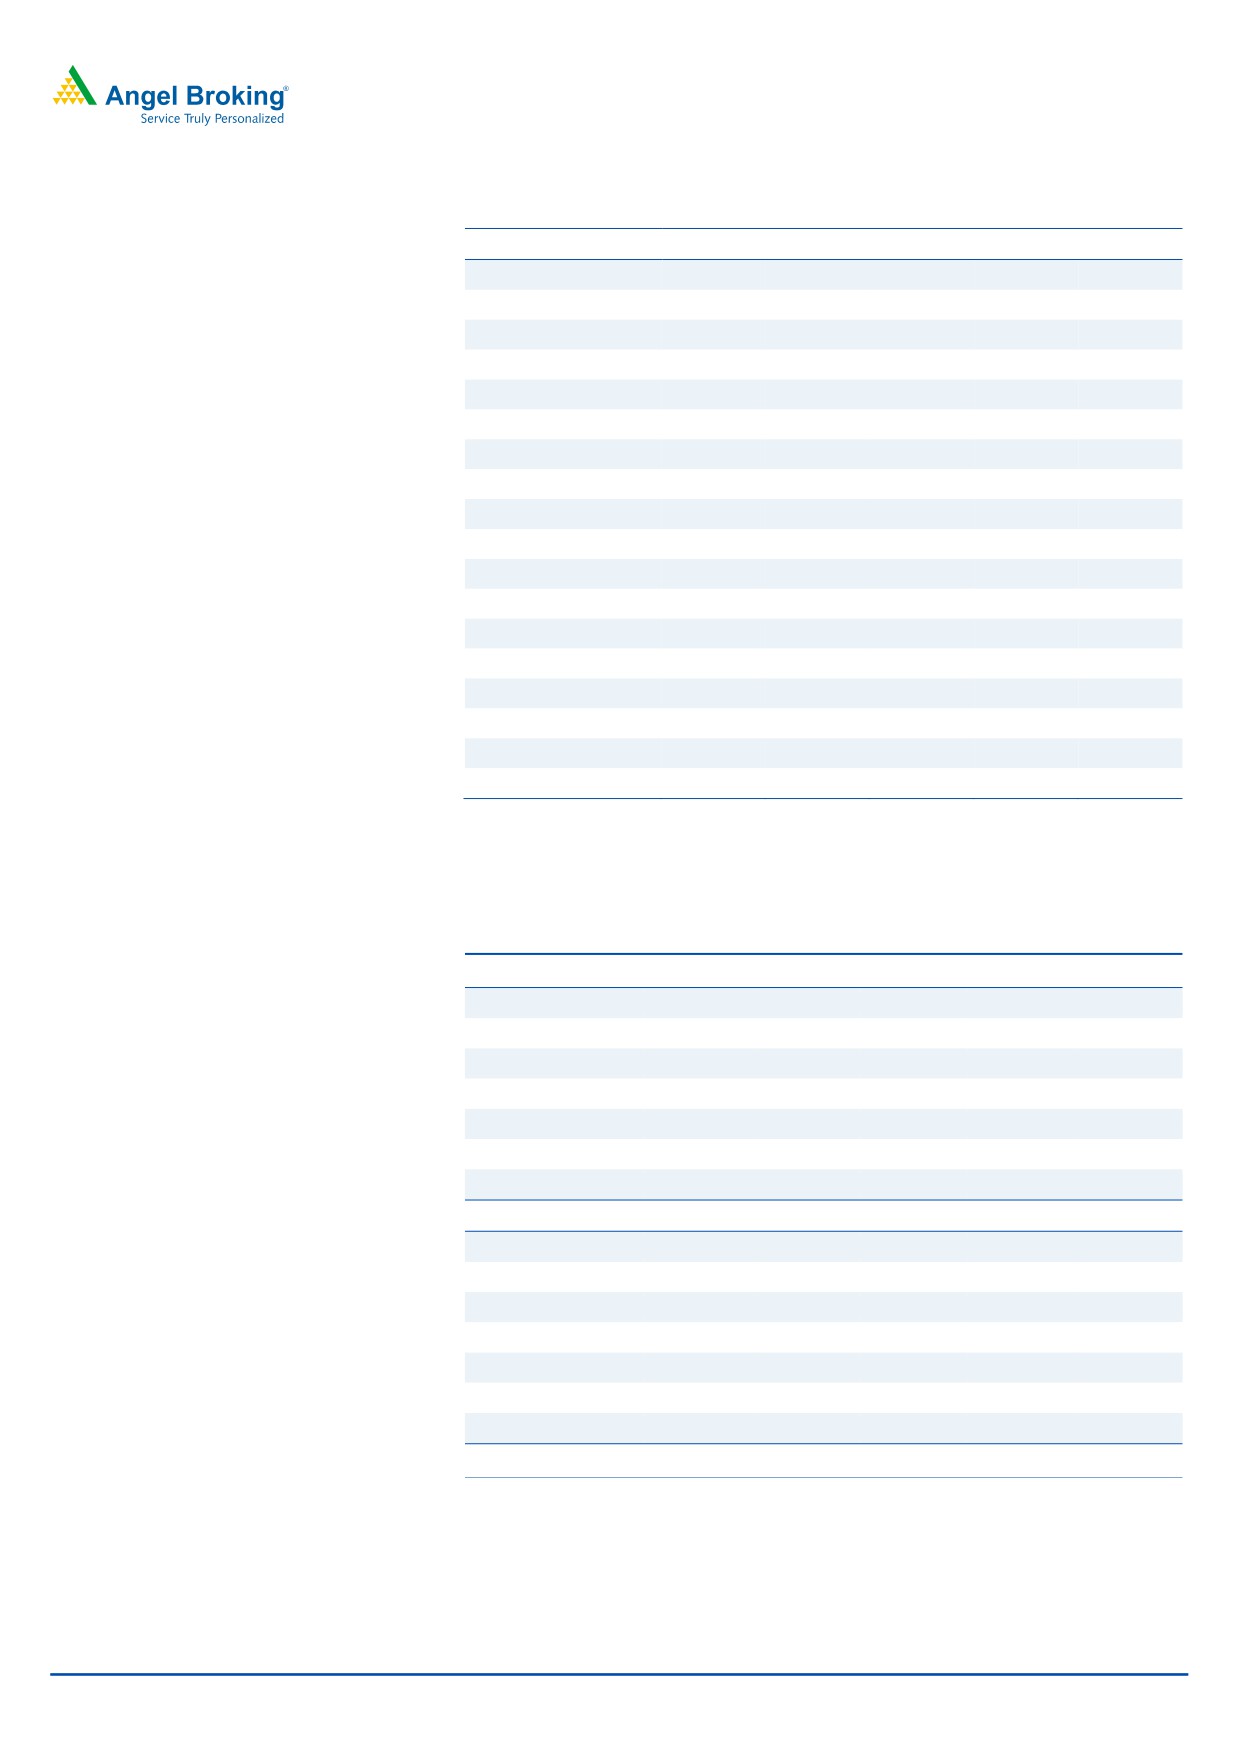
CASA growth and stable cost/ income ratio to help in lower cost of funds and
stable NIM going ahead: During the quarter NIM further contracted by 10 bps
QoQ to 4.1%, after a 20 bps drop in 2QFY17. However we feel lower cost funds
backed by high CASA ratio should help in stable NIM here onwards. Despite the
recent drop HDFC Bank continues to have one of the best NIM in the industry.
Banks across the board have reduced the lending rates and have so far gone for
reduction in term deposit rates. However, with surplus deposits in their hand now
there is a possibility of cut in rates offered on the saving bank accounts as well.
HDFC having a very high CASA ratio could benefit out of this, which should help it
protect its NIM going ahead.
Exhibit 8: Cost/ Income remains under control
Exhibit 9: NIM likely to stabilise going ahead
45.5
45.0
4.5
4.40
44.7
45.0
4.4
44.4
44.5
4.4
4.30
4.30
44.0
4.3
43.5
4.3
4.20
43.0
4.2
42.3
42.3
42.5
4.2
4.10
42.0
4.1
41.5
4.1
41.0
4.0
40.5
4.0
Q3FY16
Q4FY16
Q1FY17
Q2FY17
Q3FY17
Q3FY16
Q4FY16
Q1FY17
Q2FY17
Q3FY17
Cost / Income %
NIM %
Source: Company, Angel Research
Source: Company, Angel Research
January 31, 2017
5
HDFC Bank | 3QFY2017 Result Update
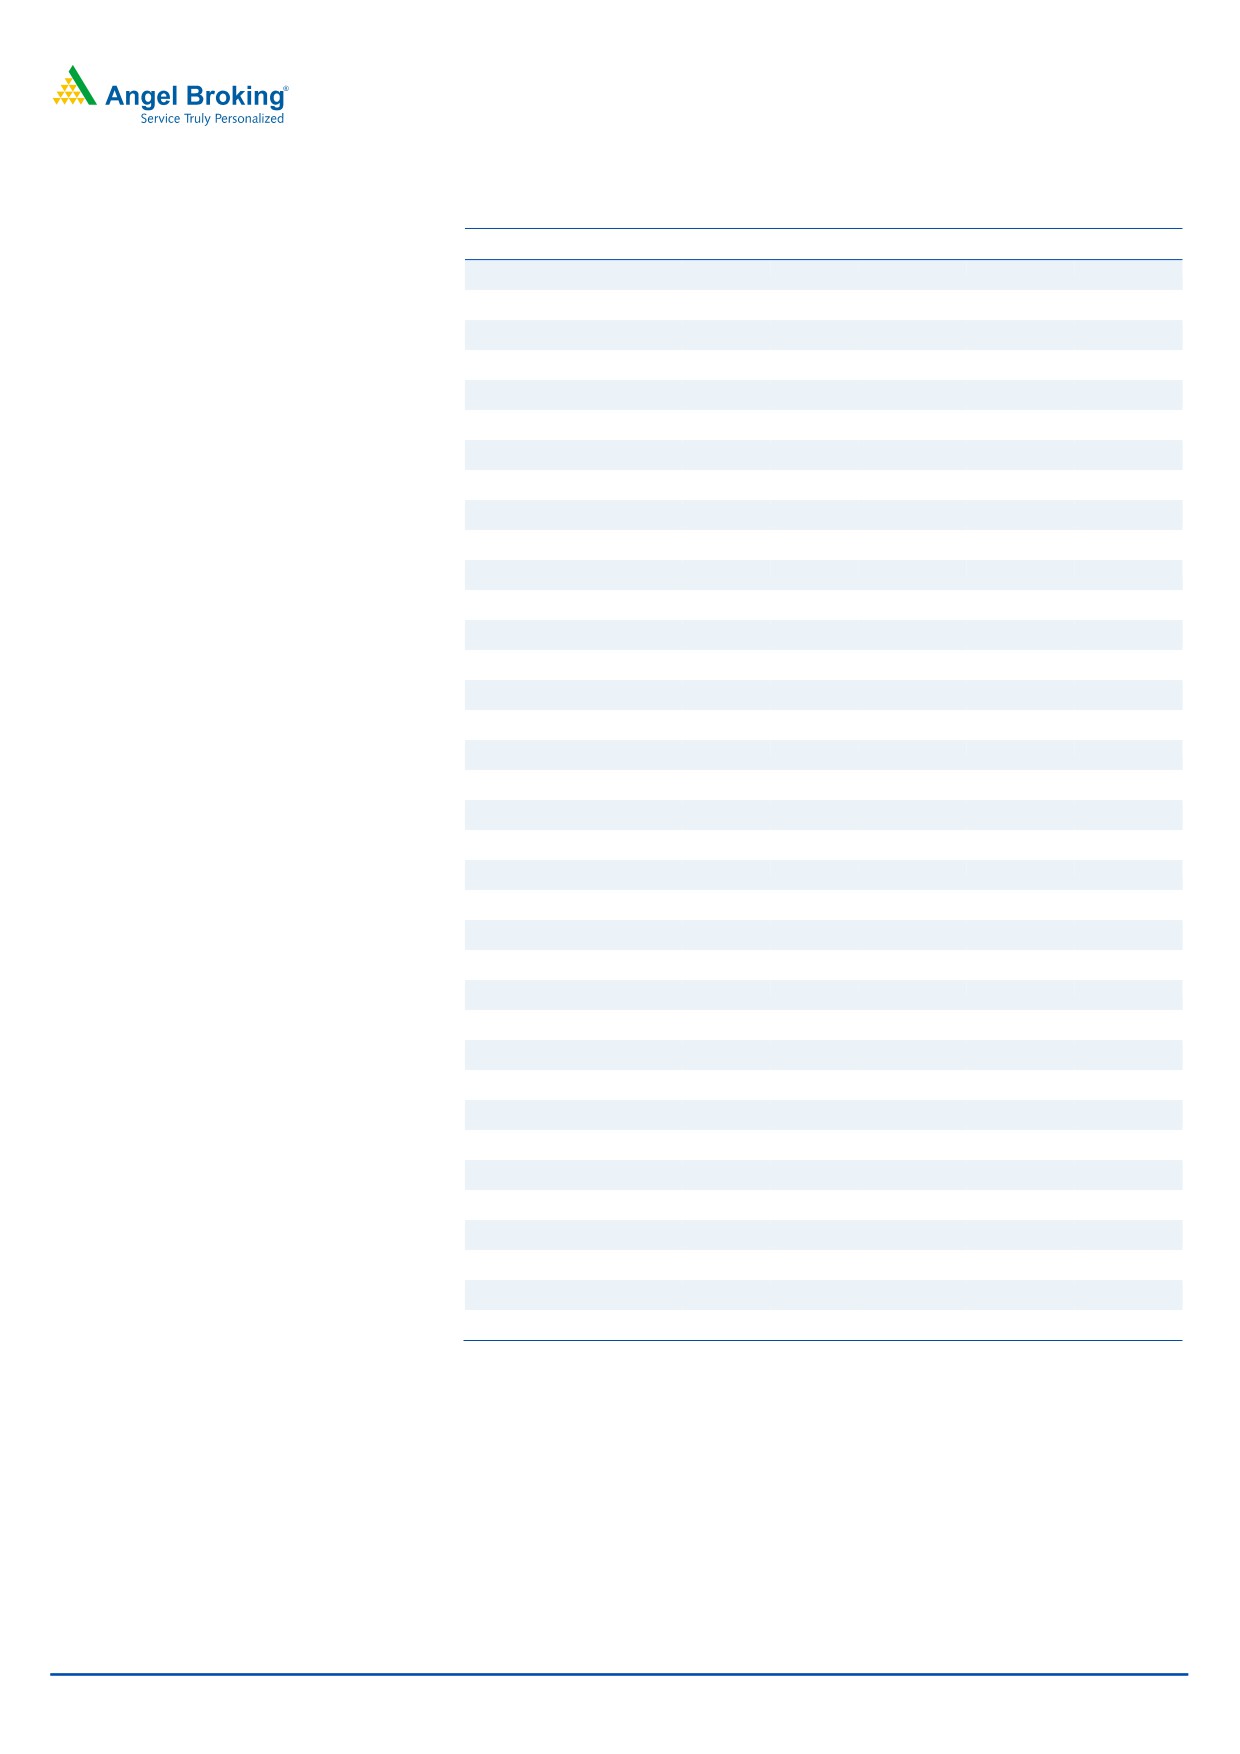
HDFC bank continues to have one of the best asset quality: What is worth
noting is that this quarter again HDFC Bank has been able to maintain a stable set
of asset quality with GNPAs at 1.05% vs 1.02% QoQ and NNPAs at 0.32% vs
0.30% QoQ and we don’t see this worsening in the near term. Credit cost for the
bank continues to be under control and with improving macro scenario and lower
interest rates it is likely to remain stable in the medium term. HDFC Bank’s
slippages has remained under control in the range of
150 bps-160 bps
annualized, the bank has also been able to contain its credit cost in the range of
50-60 bps and hence we believe in the near term there is no real threat to its asset
quality.
Exhibit 10: GNPAs & NNPAs trend
1.20
1.04
1.05
1.02
0.95
0.97
0.94
1.00
0.91
0.80
0.60
0.40
0.32
0.32
0.29
0.28
0.30
0.27
0.25
0.20
0.00
Q1FY16
Q2FY16
Q3FY16
Q4FY16
Q1FY17
Q2FY17
Q3FY17
GNPAs (%) NNPAs (%)
Source: Company, Angel Research
Outlook & Valuation
While HDFC Bank’s growth has moderated from its historical levels, it still remains
much higher than the industry rate and asset quality has been the best in class.
While in the near term the stock might range bound, well capitalized balance sheet
and superior return ratios should result in investors sticking to the stock in the long
run. At the current market price, the bank is trading at 3.2x FY2017E ABV. We
Maintain ACCUMULATE rating, on the stock, with a target price of `1,375.
Company Background
HDFC Bank is the second-largest private sector bank in India with a pan-India
network of over 4,555 branches and nearly 12,087 ATMs. HDFC has been a
leader in the retail lending space in India and has consistently outpaced the
industry growth rate. Huge and increasing branch network has enabled the bank
in gaining a strong market share in the retail loans in India. This has also ensured
a higher share of low cost deposits (CASA) for the bank.
January 31, 2017
6
HDFC Bank | 3QFY2017 Result Update
Income statement
Y/E March (` cr)
FY14
FY15
FY16E
FY17E
FY18E
Net Interest Income
18,483
22,329
27,592
33,290
40,010
- YoY Growth (%)
16.9
20.8
23.6
20.7
20.2
Other Income
7,920
8,996
10,752
11,939
13,621
- YoY Growth (%)
15.6
13.6
19.5
11.0
14.1
Operating Income
26,402
31,326
38,343
45,228
53,630
- YoY Growth (%)
16.5
18.6
22.4
18.0
18.6
Operating Expenses
12,042
13,988
16,980
19,943
23,692
- YoY Growth (%)
7.2
16.2
21.4
17.5
18.8
Pre - Provision Profit
14,360
17,338
21,364
25,285
29,938
- YoY Growth (%)
25.7
20.7
23.2
18.4
18.4
Prov. & Cont.
1,588
2,076
2,726
3,163
3,143
- YoY Growth (%)
(5.3)
30.7
31.3
16.1
(0.6)
Profit Before Tax
12,772
15,262
18,638
22,122
26,795
- YoY Growth (%)
31.0
19.5
22.1
18.7
21.1
Prov. for Taxation
4,294
5,113
6,342
7,538
9,880
- as a % of PBT
33.6
33.5
34.0
34.1
36.9
PAT
8,478
10,150
12,296
14,584
16,915
- YoY Growth (%)
26.0
19.7
21.2
18.6
16.0
Balance Sheet
Y/E March (` cr)
FY14
FY15
FY16E
FY17E
FY18E
Share Capital
480
501
506
511
511
Reserves & Surplus
42,999
61,508
72,172
85,088
1,01,111
Net Worth
43,479
62,009
72,678
85,599
1,01,622
Deposits
3,67,337
4,50,796
5,46,424
6,60,093
7,53,795
- Growth (%)
24.0
22.7
21.2
20.8
14.2
Borrowings
39,439
45,214
53,018
66,009
75,379
Other Liab & Prov.
41,344
32,484
36,725
44,226
50,504
Total Liabilities
4,91,600
5,90,503
7,08,846
8,55,927
9,81,300
Cash balances
25,346
27,510
30,058
36,305
41,459
Bank balances
14,238
8,821
8,861
10,561
12,061
Investments
1,20,951
1,51,642
1,63,886
1,98,028
2,26,138
Advances
3,03,000
3,65,495
4,64,594
5,27,221
6,28,692
- Growth (%)
26.4
20.6
27.1
13.5
19.2
Fixed Assets
2,940
3,122
3,343
4,093
4,674
Other Assets
25,125
33,913
38,104
79,719
68,276
Total Assets
4,91,600
5,90,503
7,08,846
8,55,927
9,81,300
January 31, 2017
7
HDFC Bank | 3QFY2017 Result Update
Ratio Analysis (standalone)
Y/E March
FY14
FY15
FY16E
FY17E
FY18E
Profitability Ratios (%)
NIMs
4.4
4.4
4.5
4.6
4.8
Cost to Income Ratio
45.6
44.7
44.3
44.1
44.2
RoA
1.9
1.9
1.9
1.9
1.8
RoE
21.3
19.2
18.3
18.4
18.1
B/S ratios (%)
CASA Ratio
45.0
44.0
43.2
45.0
45.0
Credit/Deposit Ratio
82.5
81.1
85.0
79.9
83.4
CAR
16.1
16.8
15.5
15.3
15.9
- Tier I
0.0
13.7
13.2
13.4
14.2
Asset Quality (%)
Gross NPAs
1.0
0.9
0.9
1.0
1.0
Net NPAs
0.3
0.2
0.3
0.3
0.3
Slippages
1.9
1.6
1.6
1.5
1.5
Loan Loss Prov./Avg. Assets
0.5
0.6
0.6
0.6
0.5
Provision Coverage
75
74
70
74
74
Per Share Data (`)
EPS
35.3
40.5
48.6
57.1
66.2
ABVPS
181
247
287
335
398
DPS
5.7
8.0
9.5
11.5
13.5
Valuation Ratios
PER (x)
35.9
31.4
26.1
22.3
19.2
P/ABVPS (x)
7.1
5.2
4.5
3.9
3.2
Dividend Yield
0.4
0.6
0.7
0.9
1.1
DuPont Analysis (%)
NII
4.1
4.1
4.2
4.3
4.4
Non Interest Income
1.8
1.7
1.7
1.5
1.5
Total Revenues
5.9
5.8
5.9
5.8
5.8
Operating Cost
2.7
2.6
2.6
2.5
2.6
PPP
3.2
3.2
3.3
3.2
3.3
Total Provisions
0.4
0.4
0.4
0.4
0.3
PreTax Profit
2.9
2.8
2.9
2.8
2.9
Tax
1.0
0.9
1.0
1.0
1.1
ROA
1.9
1.9
1.9
1.9
1.8
Leverage
11.2
10.3
9.6
9.9
9.8
RoE (%)
21.3
19.2
18.3
18.4
18.1
January 31, 2017
8
HDFC Bank | 3QFY2017 Result Update
Research Team Tel: 022 - 39357800
DISCLAIMER
Angel Broking Private Limited (hereinafter referred to as “Angel”) is a registered Member of National Stock Exchange of India Limited,
Bombay Stock Exchange Limited and Metropolitan Stock Exchange Limited. It is also registered as a Depository Participant with CDSL
and Portfolio Manager with SEBI. It also has registration with AMFI as a Mutual Fund Distributor. Angel Broking Private Limited is a
registered entity with SEBI for Research Analyst in terms of SEBI (Research Analyst) Regulations, 2014 vide registration number
INH000000164. Angel or its associates has not been debarred/ suspended by SEBI or any other regulatory authority for accessing
/dealing in securities Market. Angel or its associates/analyst has not received any compensation / managed or co-managed public
offering of securities of the company covered by Analyst during the past twelve months.
This document is solely for the personal information of the recipient, and must not be singularly used as the basis of any investment
decision. Nothing in this document should be construed as investment or financial advice. Each recipient of this document should
make such investigations as they deem necessary to arrive at an independent evaluation of an investment in the securities of the
companies referred to in this document (including the merits and risks involved), and should consult their own advisors to determine
the merits and risks of such an investment.
Reports based on technical and derivative analysis center on studying charts of a stock's price movement, outstanding positions and
trading volume, as opposed to focusing on a company's fundamentals and, as such, may not match with a report on a company's
fundamentals. Investors are advised to refer the Fundamental and Technical Research Reports available on our website to evaluate the
contrary view, if any.
The information in this document has been printed on the basis of publicly available information, internal data and other reliable
sources believed to be true, but we do not represent that it is accurate or complete and it should not be relied on as such, as this
document is for general guidance only. Angel Broking Pvt. Limited or any of its affiliates/ group companies shall not be in any way
responsible for any loss or damage that may arise to any person from any inadvertent error in the information contained in this report.
Angel Broking Pvt. Limited has not independently verified all the information contained within this document. Accordingly, we cannot
testify, nor make any representation or warranty, express or implied, to the accuracy, contents or data contained within this document.
While Angel Broking Pvt. Limited endeavors to update on a reasonable basis the information discussed in this material, there may be
regulatory, compliance, or other reasons that prevent us from doing so.
This document is being supplied to you solely for your information, and its contents, information or data may not be reproduced,
redistributed or passed on, directly or indirectly.
Neither Angel Broking Pvt. Limited, nor its directors, employees or affiliates shall be liable for any loss or damage that may arise from
or in connection with the use of this information.
Disclosure of Interest Statement
HDFC Bank
1. Financial interest of research analyst or Angel or his Associate or his relative
No
2. Ownership of 1% or more of the stock by research analyst or Angel or associates or relatives
No
3. Served as an officer, director or employee of the company covered under Research
No
4. Broking relationship with company covered under Research
No
Ratings (Based on expected returns
Buy (> 15%)
Accumulate (5% to 15%)
Neutral (-5 to 5%)
over 12 months investment period):
Reduce (-5% to -15%)
Sell (< -15)
January 31, 2017
9