2QFY2016 Result Update | Infra
October 31, 2015
Gujarat Pipavav Port (GPPL)
NEUTRAL
CMP
`161
Performance Highlights
Target Price
-
Particulars (` cr)
2QFY16 1QFY16
% chg (qoq) 2QFY15
% chg (yoy)
Investment Period
-
Net Sales
140
173
(18.8)
157
(10.6)
EBITDA
68
87
(22.0)
83
(18.3)
Stock Info
Sector
Infrastructure
Adj. PAT
61
80
(24.1)
92
(33.9)
Source: Company, Angel Research
Market Cap (` cr)
7,846
Net debt (` cr)
(245)
Gujarat Pipavav Port Ltd (GPPL) reported a poor set of numbers for 2QFY2016,
Beta
0.8
with its top-line declining by 10.6% yoy/18.8% qoq to `140cr. The top-line de-
52 Week High / Low
262/156
growth on yoy basis was owing to (1) 24% decrease in Container volumes (to
Avg. Daily Volume
151,925
145,000 TEUs), and (2) 39% decrease in Bulk business (to 628,000MT).
Face Value (`)
10
EBITDA for the quarter stood at `68cr, down 18.3% yoy/22.0% qoq. Reported
BSE Sensex
26,657
EBITDA margins came in at 48.2% as against 52.8% in corresponding year ago
Nifty
8,066
quarter and 50.2% in the sequential quarter. Fall in EBITDA margin was due to
Reuters Code
GPPL.BO
revenue de-growth coupled with yoy increase in employee expenses.
Bloomberg Code
GPPV@IN
PAT for the quarter amounted to `53cr, down 42.4% yoy and 33.9% qoq. On
adjusting for reversal of asset impairment provision and deferred tax charges, the
Shareholding Pattern (%)
Promoters
43.0
Adj. PAT stood at `61cr. Adj. PAT margins came in at 43.4% (vs 58.7% in the
MF / Banks / Indian Fls
11.0
corresponding year-ago quarter and 46.5% in the previous quarter).
FII / NRIs / OCBs
38.7
Outlook and Valuation: At the current market price of `161, GPPL is trading at
Indian Public / Others
7.4
FY2016E and FY2017E P/E multiple of 25.2x and 27.4x, respectively. We have
valued the Ports business using free cash flow to equity holders (FCFE) to arrive at
Abs. (%)
3m 1yr 3yr
FY2017E based business value of `154. We have assigned 10x P/E multiple to our
Sensex
(31.7)
(2.8)
238.3
FY2017E earnings estimate of Pipavav Rail Corporation Ltd (PRCL) to arrive at
GPPL
(5.2)
(4.3)
44.0
business value of `7 (adj. for 38.8% stake). On using the sum-of-the-parts (SOTP)
based valuation methodology we arrive at a FY2017E based price target of `162.
Given the limited upside potential in the stock from the current levels, we maintain our
3-year price chart
300
Neutral rating on the stock.
250
Key Financials
200
150
Y/E March (` cr)
FY13
FY15*
FY16E
FY17E
100
Net Sales
474
792
629
684
50
% chg
67.2
(20.6)
8.8
0
Net Profit
192
389
309
284
% chg
102.6
(20.6)
(8.2)
Source: Company, Angel Research
EBITDA (%)
44.9
53.8
51.0
52.2
EPS (`)
4
8
6
6
P/E (x)
40.5
20.0
25.2
27.4
P/BV (x)
4.2
3.9
3.3
3.0
RoE (%)
14.7
24.3
15.9
12.7
RoCE (%)
13.3
26.4
17.0
16.9
EV/Sales (x)
16.6
9.5
12.0
10.8
Yellapu Santosh
EV/EBITDA (x)
36.9
17.7
23.5
20.7
022 - 3935 7800 Ext: 6811
Source: Company, Angel Research; Note: CMP as of October 30, 2015; *GPPL switched from Dec
to Mar year ending
Please refer to important disclosures at the end of this report
1
GPPL | 2QFY2016 Result Update
Exhibit 1: 2QFY2016 Performance
Particulars (` cr)
2QFY16
1QFY16
% chg (qoq) 2QFY15
% chg (yoy) 1HFY16 1HFY15
% chg
Net Sales
140
173
(18.8)
157
(10.6)
313
313
0.1
Total Expenditure
73
86
(15.5)
74
(2.1)
159
144
10.5
Operating Expenses
33
41
(19.6)
38
(15.2)
73
71
2.4
Employee benefits Expense
14
13
6.5
11
21.5
27
25
9.3
Other Expenses
26
33
(19.2)
24
7.7
59
48
23.4
EBITDA
68
87
(22.0)
83
(18.3)
155
169
(8.7)
EBIDTA %
48.2
50.2
52.8
49.3
54.1
Depreciation
23
24
(5.4)
16
38.9
47
33
39.7
EBIT
45
63
(28.4)
67
(32.4)
108
136
(20.7)
Interest and Financial Charges
0
0
66.8
9
(99.5)
0
17
(99.6)
Other Income
16
18
(10.1)
35
(54.6)
33
52
(35.2)
PBT before Exceptional Items
61
80
(24.4)
92
(34.1)
141
170
(17.0)
Exceptional Items
(60)
0
0
(60)
0
PBT after Exceptional Items
121
80
50.7
92
31.4
202
170
18.6
Tax
68
0
0
68
0
% of PBT
56
nmf*
nmf*
34
nmf*
PAT
53
80
(33.9)
92
(42.4)
134
170
(21.5)
Adj. PAT
61
80
(24.1)
92
(33.9)
141
170
(17.1)
PAT %
37.8
46.5
58.7
42.6
54.3
Adj. PAT %
43.4
46.5
58.7
45.0
54.3
Dil. EPS (after excep. Items)
1.10
1.66
(33.7)
1.91
(42.4)
2.76
3.52
(21.6)
Adj. Dil. EPS (after excep. Items)
1.26
1.66
(24.1)
1.91
(34.0)
2.92
3.52
(17.0)
Source: Company, Angel Research; Note: nmf*- Not meaningful; ** GPPL switched from Dec to Mar year ending
Top-line disappoints
GPPL, for 2QFY2016, reported a 10.6% yoy decline in revenues to `140cr. On a
sequential basis, revenues were down 18.8%.The Reported top-line numbers are
below our expectation of `179.8cr. The top-line de-growth on a yoy basis is on
account of (1) 24% decrease in Container business volumes (to 146,000TEUs),
and (2) 38% decrease in Dry Bulk business (to 628,000MT).
Decline in Container and Dry Bulk revenues is attributable to (1) cyclone weather
at port, witnessed (Force Majeure) (2) re-alignment of services, and (3) impact of
global slowdown.
On the top-line front, the 2 positives were (1) 52% qoq increase in Liquid Farm
Tanks volumes to 163,000MT, and (2) better realizations at both, Container as
well as Dry Bulk business.
Container Terminal volumes of GPPL reported yoy decline for second consecutive
quarter. Volumes de-grew 5% yoy in 1QFY2016, with decline further accentuating
to 24% yoy in 2QFY2016 to ~146,000 TEUs.
October 31, 2015
2
GPPL | 2QFY2016 Result Update
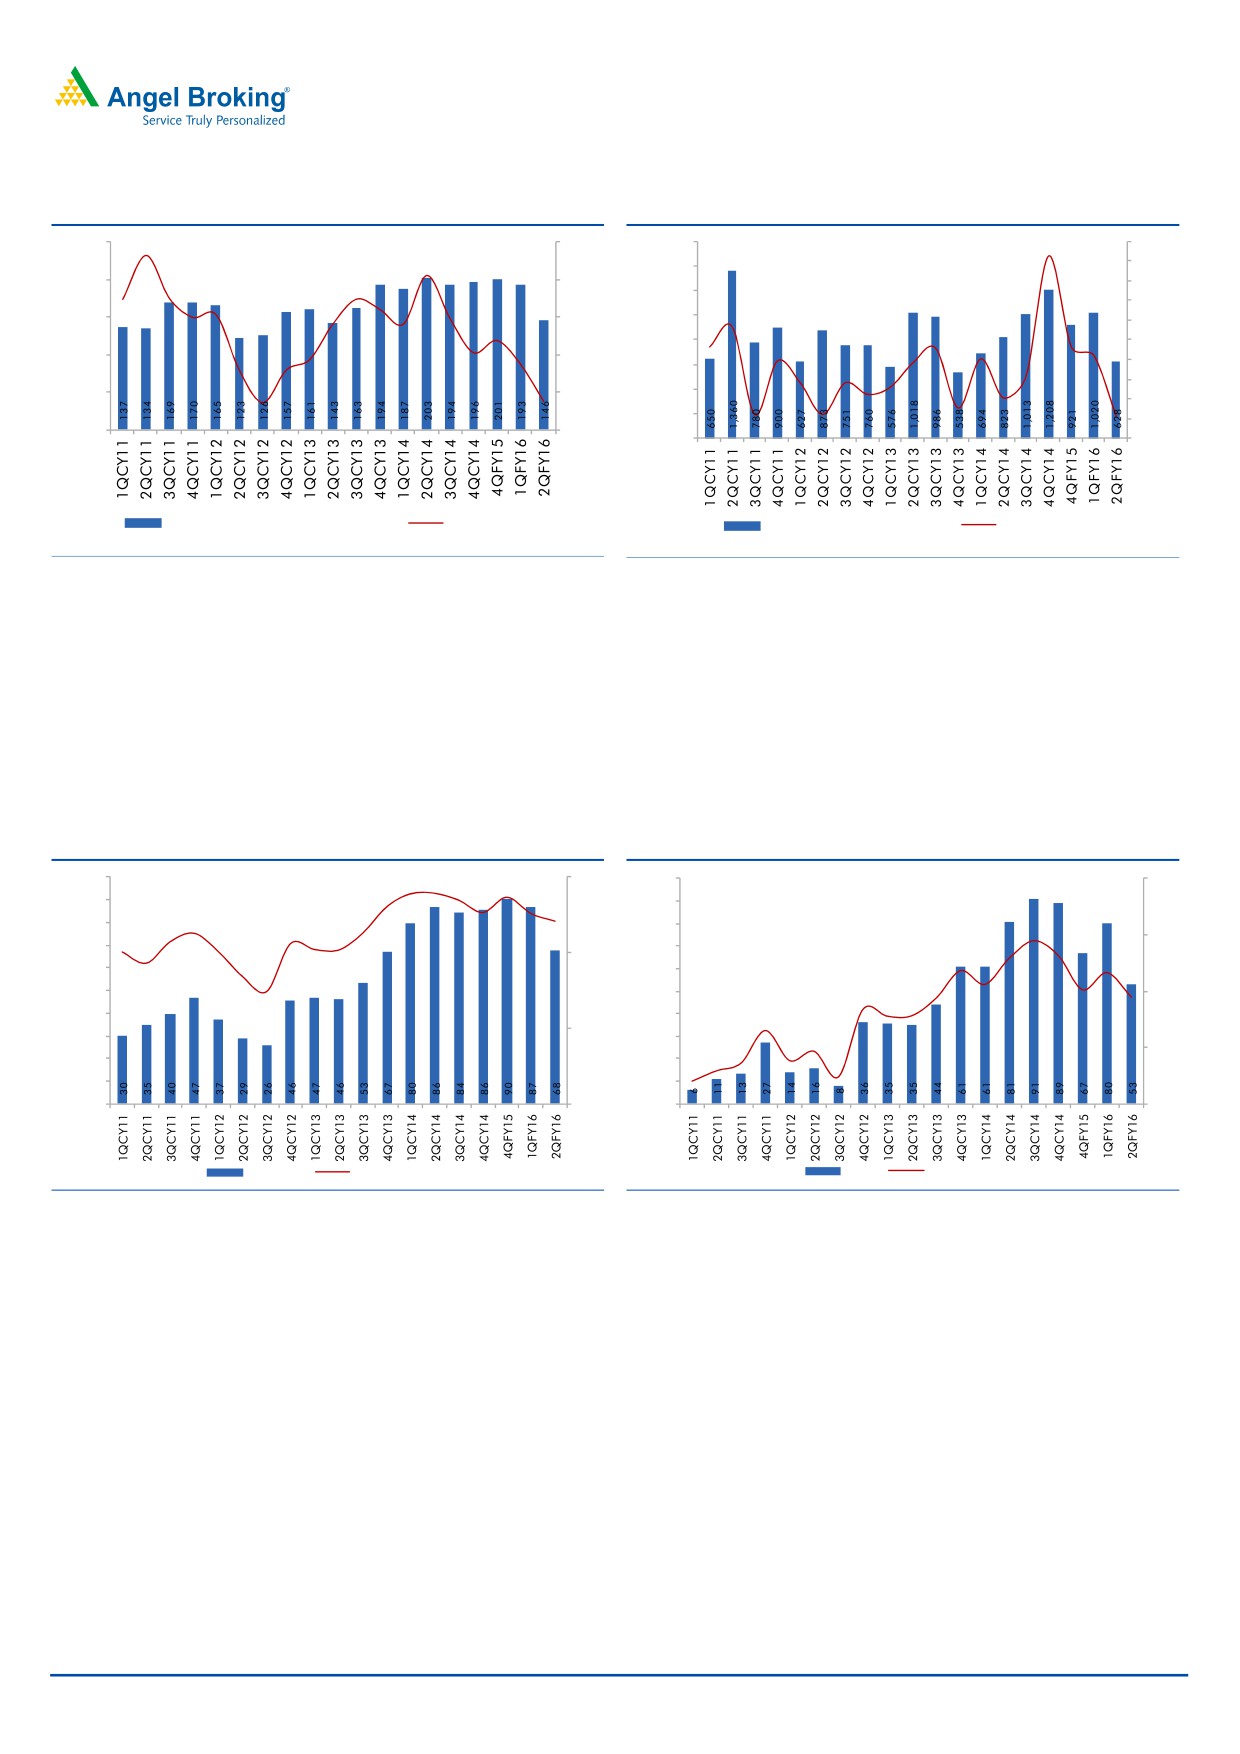
Exhibit 2: Container volumes decline 24% yoy
Exhibit 3: Bulk volumes continue to show traction
250
60
1,600
140
120
1,400
200
40
100
1,200
80
150
20
1,000
60
800
40
100
0
20
600
0
50
(20)
400
(20)
200
(40)
0
(40)
0
(60)
Container Volume (TEUs in '000s)
yoy change (%)
Bulk Volumes (MT in '000s)
yoy change (%)
Source: Company, Angel Research
Source: Company, Angel Research
EBITDA Margin dips below 50% levels
GPPL reported an EBITDA of `68cr, which is below our expectation of `95cr.
Reported EBITDA margin of the company was at 48.2%, down from 50.2% in the
sequential quarter and 53.7% in corresponding quarter a year ago. EBITDA during
the quarter was impacted on account of yoy revenue de-growth, as well as owing
to 21.5% yoy increase in employee costs to `14cr.
Exhibit 4: EBITDA% dips below 50% levels
Exhibit 5: PAT% stood at 37.8%
100
60
100
80
90
90
80
80
60
70
70
40
60
60
50
50
40
40
40
20
30
30
20
20
20
10
10
0
0
0
0
EBITDA
EBITDA Margins (%)
PAT
PAT Margins (%)
Source: Company, Angel Research
Source: Company, Angel Research
GPPL reported a PAT of `53cr, down 42.4% yoy, and 33.9% qoq. On adjusting
for reversal of asset impairment provision (`60.4cr) and deferred tax charge of
`60.0cr (for 1HFY2016), the adj. PAT stands at `61cr, which is below our
expectation of `86.1cr. Adj. PAT margins during the quarter was at 43.4% vs
58.7% in the corresponding quarter year ago. Adj. PAT number, on yoy basis, was
impacted due to (1) repayment of entire debt (leading to just `0.04cr of interest
expenses in 2QFY2016 vs `9cr in the corresponding quarter a year ago quarter),
(2) 38.9% increase in depreciation expenses to `23cr, and (3) 54.6% decrease in
other income to `16cr. The sharp increase in depreciation expense is owing to
change in estimated useful life of assets (resulting in
`6.7cr increase in
depreciation expenses).
October 31, 2015
3
GPPL | 2QFY2016 Result Update
Concall Highlights
GPPL is running as per schedule its ongoing capex (to increase the container
capacity from 1.1mn TEUs to 1.35mn TEUs) and expects to commission
operations by 4QFY2016. Management confirmed that it has already incurred
30-35% of the total proposed capex.
Rail line disruption led to loss of Container volumes by 25,000-30,000 TEUs.
Re-alignment of services by FM3 line (to Mundra Port) contributed to loss of
75,000-80,000 TEUs (annual basis) and discontinuation of services by NMG
contributed to a loss of 20,000-30,000 TEUs (annual basis).
Post the rail line disruption, GPPL re-directed 2 coal and 2 fertilizer ships,
which led to a loss of 0.2-0.25MT of Bulk volumes during the quarter.
Having set-off all of its carry forward losses, the company is now eligible to
start distributing dividends from FY2016 onwards. Management highlighted
towards ongoing discussions at the board room level.
Revision of our Estimates
On incorporating adjustments for (1) decline in Container business volumes, which
could further result in EBITDA margin decline, and (2) deferred tax charge, we are
reducing our PAT estimates for FY2016E and FY2017E to `309cr and `284cr,
respectively.
Exhibit 6: Revised estimates
FY2016E
FY2017E
Particulars (` cr)
Old New
% chg.
Old New
% chg.
Net Sales
721
629
(12.8)
784
684
(12.8)
EBITDA
383
321
(16.2)
420
357
(15.0)
EBITDA Margins (%)
53.1
51.0
53.6
52.2
Rep. PAT
397
309
(22.2)
439
284
(35.3)
Rep. PAT Margins (%)
55.0
49.1
56.1
41.4
Source: Company, Angel Research
October 31, 2015
4
GPPL | 2QFY2016 Result Update
Investment Arguments
Stable Container volumes and ramp-up in Bulk business to lead
to strong revenues for FY2016-17E:
Ramp-up of operations from Hanjin, Maersk, and NMG helped GPPL report
18.7% CAGR in Container volumes during CY2010-14 to 780,000 TEUs. Also, in
the last few quarters, GPPL has maintained an average quarterly Container volume
run-rate of 180,000+ TEUs with the exception of 2QFY2016 (where it reported
~146,000 TEUs). Again, with the exception of 2QFY2016, the Container business
in the last 5 quarters has been running at over 90% utilization levels (at yard level).
Sensing that the port would soon hit peak utilization, GPPL embarked upon an
expansion plan. This expansion plan (yard level capacity would increase from
850,000 TEUs to 1,350,000 TEUs) is likely to get completed by 4QFY2016.
Notably, in the backdrop of global slump in the pricing environment, many
shipping lines are exploring alternatives. This when coupled with loss of business
from FM3 and NMG in 2QFY2016, indicates that GPPL may find it challenging to
further scale operations from here-on. Accordingly, we now expect GPPL to report
~742,000 and ~760,000 TEUs for FY2016E and FY2017E, respectively.
Similarly, despite the recent traction in Bulk volumes business, we are now building
lower volumes for FY2016-17E.
Given the loss of business and slump in the global pricing environment, we expect
delays in further ramp-up in operations from here-on. Accordingly, we have
revised down our estimates for FY2016-17E.
Ramp-up in Liquid Farms business:
Sensing business opportunity, GPPL tied-up with Aegis Logistics, IMC, and Gulf
Petrochem to construct and set-up Liquid Tank Farms. We expect GPPL to continue
reporting strong growth in profitability, well aided by ramp-up in business in Liquid
Tank Farms, which also happens to be a high margins business. EBITDA margin in
Liquid Tank Farms is in the range of 65-70%.
Outlook and Valuation
We expect GPPL to report soft earnings during FY2016-2017E, on the back of (1)
weak container volume growth outlook, and (2) delays in further ramp-up in the
Bulk business.
At the current market price of `166, GPPL is trading at FY2016E and FY2017E P/E
multiple of 25.2x and 27.4x, respectively. At current valuations, the stock price is
capturing all the possible positives.
We have valued the Ports business (on revised numbers) using free cash flow to
equity holders (FCFE) to arrive at FY2017 based business value of `154. Given
that the company is debt free, has negative working capital, strong market
positioning, and better revenue visibility, we have assumed cost of equity of 11%
for discounting the FCFE. We have assigned 10x P/E multiple to our FY2017E
earnings of Pipavav Rail Corporation Ltd (PRCL) to arrive at a business value of `7
(adjusted for
38.8% stake). On using the sum-of-the-parts based valuation
methodology, we arrive at FY2017E based price target of `162. Given the limited
upside potential in the stock from the current levels, we maintain our Neutral
rating on the stock.
October 31, 2015
5
GPPL | 2QFY2016 Result Update
Exhibit 7: SoTP Valuation Summary
Valuation
Particulars
Valuation (`cr)
Stake (%)
Per Share (`) Valuation Basis
(adj. for stake; ` cr)
Pipavav Port
7,468
100
7,468
154
FCFE valuation, 11% Cost of Equity
Pipavav Rail Corp.
903
39
350
7
10x FY17E P/E
Total Value of GPPL
12,021
7,818
162
Source: Angel Research
Company Background
Gujarat Pipavav Port Ltd (GPPL) is India's first BOT Port project awarded to SKIL
Infrastructure led JV (Gujarat Maritime Board being the other partner in the JV) in
1992. In 2005, a APM Terminals (part of AP Moller Maersk) led consortium bought
the entire stake in GPPL from SKIL. APM Terminals, through APM Terminals
Mauritius Ltd, holds 43.01% stake in GPPL.
Details of the Concession Agreement
Gujarat Pipavav Port Ltd. (GPPL) signed a 30 years’ concession agreement with a
JV led by Gujarat Maritime Board (GMB; SKIL being the other partner) to build,
construct, operate and maintain Pipavav Port, at Amreli district in Gujarat in Aug-
1992. In 1998, GMB divested its entire stake in GPPL to SKIL. Later in 2005, SKIL
divested its entire stake to APM Terminals led investors.
GPPL is looked upon as one of the most efficient port operators by shipping liners.
Located near the entrance of the Gulf of Khambhat, this port enjoys a location
advantage as the 2 islands act as natural breakwater. This location advantage
helps it in being identified as part of the main maritime trade route, which is
helpful in import and export to USA, Middle East, China and other European
markets.
October 31, 2015
6
GPPL | 2QFY2016 Result Update
Income Statement
Y/E March (` cr)
CY13
FY15*
FY16E
FY17E
Net Sales
474
792
629
684
% Chg
67.2
(20.6)
8.8
Total Expenditure
261
366
308
327
Operating Expenses
132
185
148
157
Employee benefits Expense
42
62
52
57
Other Expenses
87
119
109
112
EBITDA
213
426
321
357
% Chg
100.6
(24.8)
11.4
EBIDTA %
44.9
53.8
51.0
52.2
Depreciation
61
83
97
112
EBIT
152
343
224
245
% Chg
126.0
(34.7)
9.5
Interest and Financial Charges
37
26
0
0
Other Income
61
116
107
133
PBT
175
433
331
378
Tax
0
0
83
95
% of PBT
0.0
0.0
25.0
25.0
PAT before Exceptional item
175
433
248
284
Exceptional item
(16)
45
(60)
0
PAT
192
389
309
284
% Chg
102.6
(20.6)
(8.2)
PAT %
40.5
49.1
49.1
41.4
Diluted EPS
4
8
6
6
% Chg
102.6
(20.6)
(8.2)
Note: * GPPL switched from Dec to Mar year ending
October 31, 2015
7
GPPL | 2QFY2016 Result Update
Balance Sheet
Y/E March (` cr)
CY13
FY15*
FY16E
FY17E
Sources of Funds
Equity Capital
483
483
483
483
Reserves Total
920
1,307
1,616
1,900
Networth
1,404
1,791
2,099
2,383
Total Debt
282
0
0
0
Other Long-term Liabilities
12
14
13
13
Other Long-term Provisions
24
24
24
24
Total Liabilities
1,721
1,829
2,136
2,420
Application of Funds
Gross Block
1,919
1,983
2,395
2,685
Accumulated Depreciation
561
645
740
852
Net Block
1,358
1,338
1,656
1,833
Capital WIP
106
65
40
14
Investments
83
83
83
83
Current Assets
Inventories
12
14
19
21
Sundry Debtors
34
36
35
36
Cash and Bank Balance
202
245
221
358
Loans, Advances & Deposits
66
202
202
202
Other Current Asset
4
7
4
4
Current Liabilities
145
163
126
135
Net Current Assets
173
340
355
486
Other Assets
1
3
3
3
Total Assets
1,721
1,829
2,136
2,420
Note: * GPPL switched from Dec to Mar year ending
October 31, 2015
8
GPPL | 2QFY2016 Result Update
Cash Flow Statement
Y/E March (` cr)
CY13
FY15P*
FY16E
FY17E
Profit before tax
192
433
331
378
Depreciation
61
83
97
112
Change in Working Capital
47
6
(44)
6
Interest Expenses & Other Adj.
(48)
13
(26)
(41)
Direct taxes paid
(22)
(41)
(83)
(95)
Cash Flow from Operations
230
494
276
361
(Inc)/ Dec in Fixed Assets
(91)
(23)
(370)
(265)
(Inc)/ Dec in Investments & Oth. Adj.
(85)
(40)
26
41
Cash Flow from Investing
(176)
(63)
(345)
(224)
Issue/ (Buy Back) of Equity
0
0
0
0
Inc./ (Dec.) in Loans
(17)
(282)
0
0
Dividend Paid (Incl. Tax)
0
0
0
0
Interest Expenses
(38)
(26)
0
0
Cash Flow from Financing
(54)
(308)
0
0
Inc./(Dec.) in Cash
(0)
124
(69)
137
Opening Cash balances
51
51
175
106
Closing Cash balances
51
175
106
243
Note: * GPPL switched from Dec to Mar year ending
Ratio Analysis
Y/E March
CY13
FY15P*
FY16E
FY17E
Valuation Ratio (x)
P/E (on FDEPS)
40.5
20.0
25.2
27.4
P/CEPS
30.8
16.5
19.2
19.7
Dividend yield (%)
0.0
0.0
0.0
0.0
EV/Sales
16.6
9.5
12.0
10.8
EV/EBITDA
36.9
17.7
23.5
20.7
EV / Total Assets
4.2
3.8
3.3
2.9
Per Share Data (`)
EPS (fully diluted)
4.0
8.1
6.4
5.9
Cash EPS
5.2
9.8
8.4
8.2
DPS
0.0
0.0
0.0
0.0
Book Value
38.7
41.3
48.6
52.9
Returns (%)
RoCE (Pre-tax)
13.3
26.4
17.0
16.9
Angel RoIC (Pre-tax)
12.6
25.7
15.8
15.9
RoE
14.7
24.3
15.9
12.7
Turnover ratios (x)
Asset Turnover (Gross Block) (X)
0.1
0.2
0.1
0.1
Inventory / Sales (days)
9
6
9
11
Receivables (days)
27
15
19
18
Payables (days)
55
58
71
58
Note: * GPPL switched from Dec to Mar year ending
October 31, 2015
9
GPPL | 2QFY2016 Result Update
Research Team Tel: 022 - 39357800
DISCLAIMER
Angel Broking Private Limited (hereinafter referred to as “Angel”) is a registered Member of National Stock Exchange of India Limited,
Bombay Stock Exchange Limited and Metropolitan Stock Exchange of India Limited. It is also registered as a Depository Participant with
CDSL and Portfolio Manager with SEBI. It also has registration with AMFI as a Mutual Fund Distributor. Angel Broking Private Limited is
a registered entity with SEBI for Research Analyst in terms of SEBI (Research Analyst) Regulations, 2014 vide registration number
INH000000164. Angel or its associates has not been debarred/ suspended by SEBI or any other regulatory authority for accessing
/dealing in securities Market. Angel or its associates including its relatives/analyst do not hold any financial interest/beneficial
ownership of more than 1% in the company covered by Analyst. Angel or its associates/analyst has not received any compensation /
managed or co-managed public offering of securities of the company covered by Analyst during the past twelve months. Angel/analyst
has not served as an officer, director or employee of company covered by Analyst and has not been engaged in market making activity
of the company covered by Analyst.
This document is solely for the personal information of the recipient, and must not be singularly used as the basis of any investment
decision. Nothing in this document should be construed as investment or financial advice. Each recipient of this document should
make such investigations as they deem necessary to arrive at an independent evaluation of an investment in the securities of the
companies referred to in this document (including the merits and risks involved), and should consult their own advisors to determine
the merits and risks of such an investment.
Reports based on technical and derivative analysis center on studying charts of a stock's price movement, outstanding positions and
trading volume, as opposed to focusing on a company's fundamentals and, as such, may not match with a report on a company's
fundamentals.
The information in this document has been printed on the basis of publicly available information, internal data and other reliable
sources believed to be true, but we do not represent that it is accurate or complete and it should not be relied on as such, as this
document is for general guidance only. Angel Broking Pvt. Limited or any of its affiliates/ group companies shall not be in any way
responsible for any loss or damage that may arise to any person from any inadvertent error in the information contained in this report.
Angel Broking Pvt. Limited has not independently verified all the information contained within this document. Accordingly, we cannot
testify, nor make any representation or warranty, express or implied, to the accuracy, contents or data contained within this document.
While Angel Broking Pvt. Limited endeavors to update on a reasonable basis the information discussed in this material, there may be
regulatory, compliance, or other reasons that prevent us from doing so.
This document is being supplied to you solely for your information, and its contents, information or data may not be reproduced,
redistributed or passed on, directly or indirectly.
Neither Angel Broking Pvt. Limited, nor its directors, employees or affiliates shall be liable for any loss or damage that may arise from
or in connection with the use of this information.
Note: Please refer to the important ‘Stock Holding Disclosure' report on the Angel website (Research Section). Also, please refer to the
latest update on respective stocks for the disclosure status in respect of those stocks. Angel Broking Pvt. Limited and its affiliates may
have investment positions in the stocks recommended in this report.
Disclosure of Interest Statement
GPPL
1. Analyst ownership of the stock
No
2. Angel and its Group companies ownership of the stock
No
3. Angel and its Group companies' Directors ownership of the stock
No
4. Broking relationship with company covered
No
Note: We have not considered any Exposure below ` 1 lakh for Angel, its Group companies and Directors
Ratings (Based on expected returns
Buy (> 15%)
Accumulate (5% to 15%)
Neutral (-5 to 5%)
over 12 months investment period):
Reduce (-5% to -15%)
Sell (< -15)
October 31, 2015
10