3QFY2016 Result Update | Tyres
November 6, 2015
Goodyear India
ACCUMULATE
CMP
`573
Performance Highlights
Target Price
`622
Y/E December (` cr) 3QFY2016 3QCY2014* % chg (yoy) 2QFY2016
% chg (qoq)
Investment Period
12 Months
Net sales
382
402
(5.0)
432
(11.8)
EBITDA
46
40
14.4
59
(22.6)
Stock Info
EBITDA margin (%)
11.9
9.9
202bp
13.6
(168)bp
Sector
Tyres
Adjusted PAT
29
25
15.2
36
(19.9)
Source: Company, Angel Research; Note: *reporting changed from CY to FY starting Jan 2015
Market Cap (` cr)
1,321
Net Debt
(365)
Note- Goodyear India (GIL) is shifting from calendar year reporting followed until
Beta
0.8
now, to financial year reporting. Hence FY2016 will consist of five quarters.
52 Week High / Low
713 / 502
GIL reported a disappointing set of numbers for 3QFY2016. Its top-line witnessed
Avg. Daily Volume
20,231
a 5.0% yoy decline to `382cr. The raw material cost declined by 495bp yoy to
Face Value (`)
10
63.4% of sales, while employee and other expense increased by 193bp yoy and
BSE Sensex
26,304
100bp yoy to 7.7% and 16.9% of sales respectively. The EBITDA margin
Nifty
7,955
expanded by 202bp yoy to 11.9%. On the back of lower raw material cost, the
Reuters Code
GDYR.BO
net profit for the quarter increased by 15.2% yoy to `29cr.
Bloomberg Code
GDYR IN
Expansion drive to lead to recovery in top-line: GIL has laid out plans to
significantly grow its presence in the passenger car segment in India, over the
Shareholding Pattern (%)
next five years. The company aspires to be one of the top players in the mid to
Promoters
74.0
premium, and SUV segments, for passenger cars. It is also evaluating entry into
MF / Banks / Indian Fls
8.0
newer segments; in order to reach its goal, the company is weighing organic as
FII / NRIs / OCBs
0.8
well as in-organic growth options, to expand in India.
Indian Public / Others
17.2
Strong balance sheet with high RoIC: GIL is a debt free-cash rich company with
RoIC estimated at 75.8% for FY2017. The company’s cash and equivalents are
expected to be at `524cr by FY2017-end, which would amount to ~40% of the
Abs. (%)
3m 1yr 3yr
current market cap. More importantly, GIL is one of the cheapest MNCs available
Sensex
(6.8)
(5.8)
40.2
to invest in, in the similar market cap range.
GOODYEAR
(10.6)
(13.0)
73.4
Outlook and valuation: We expect the company’s top-line to be at `1,888cr and
`1,680cr in FY2016E and FY2017E respectively. Raw material cost is expected to
remain stable over FY2016E-17E resulting in EBITDA margin of 12.1% in
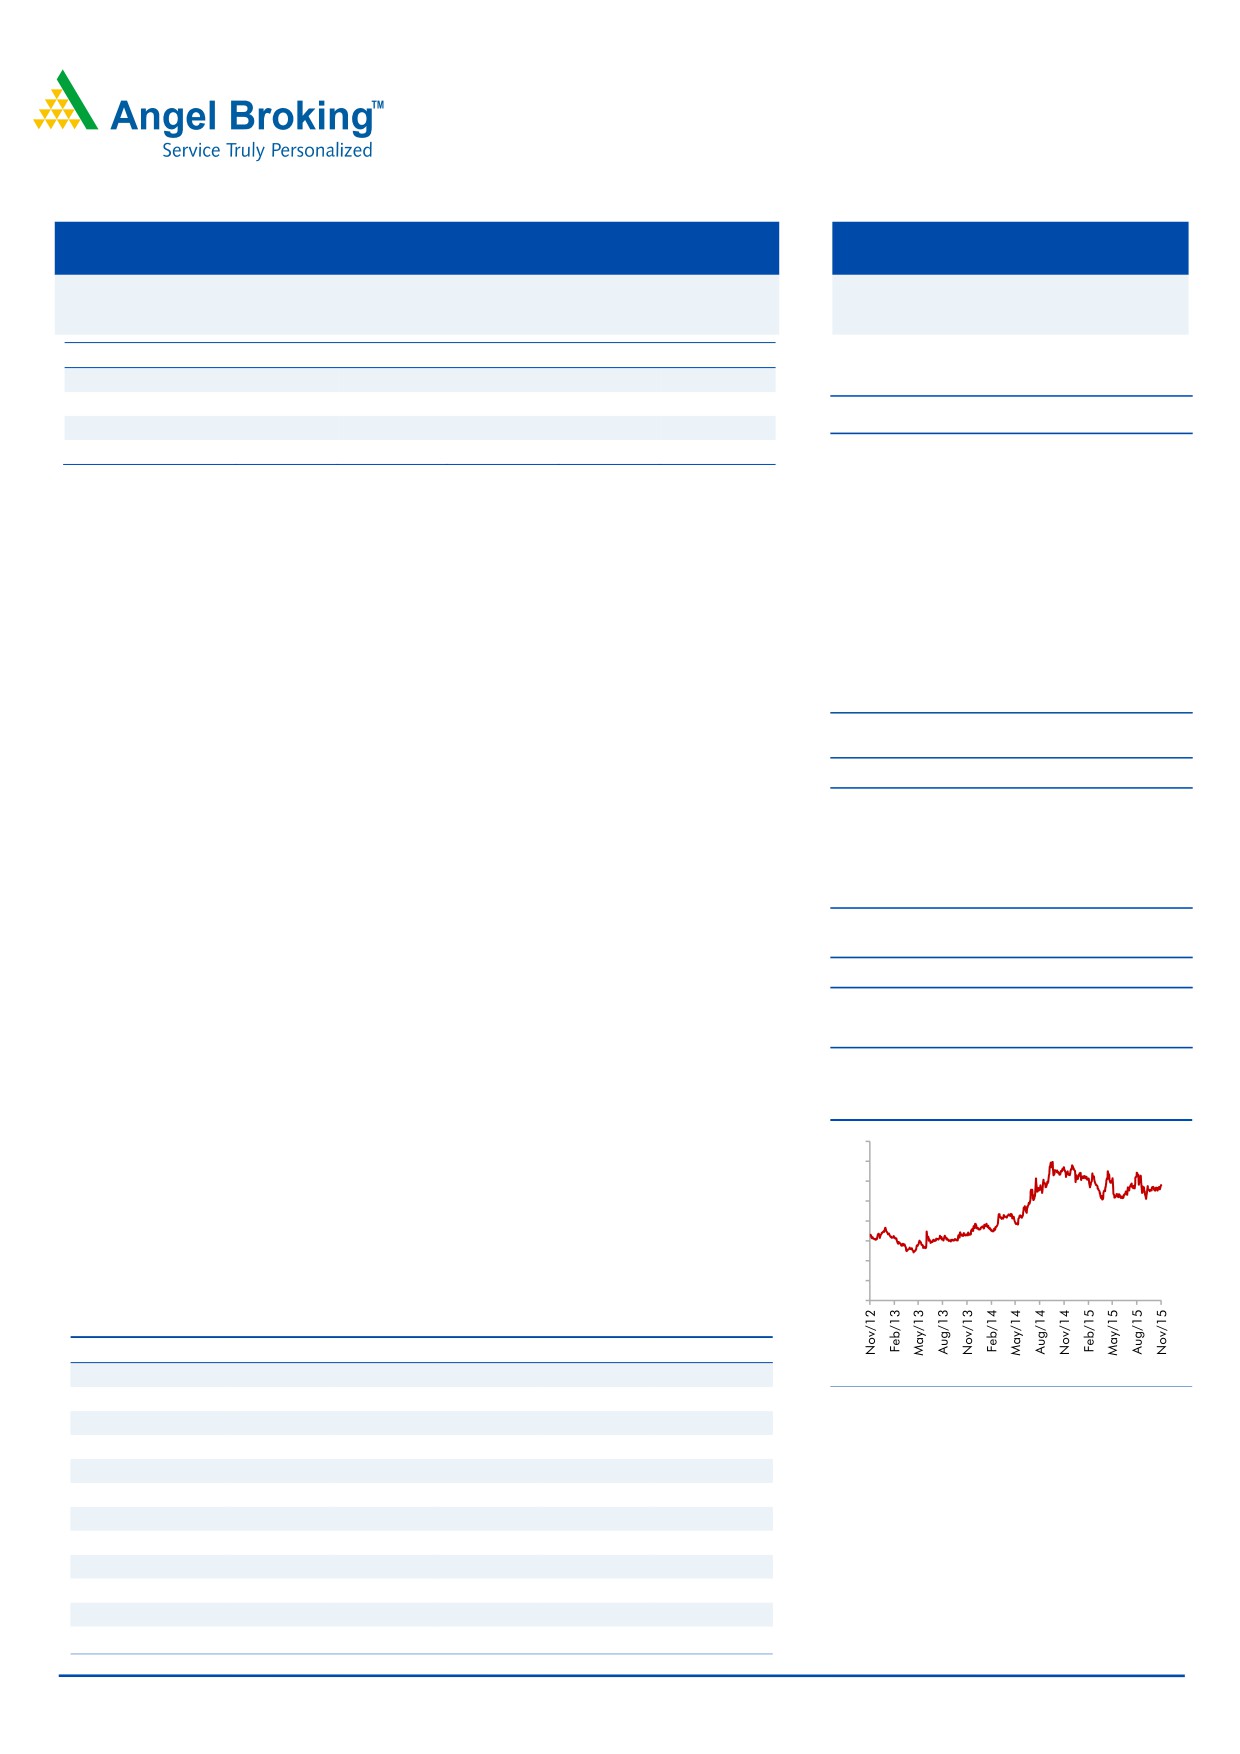
3-year Daily Price Chart
FY2016E and 11.9% in FY2017E. Consequently, we estimate the net profit to be
800
at `130cr in FY2017E. At the current market price, the stock is trading at a PE of
700
10.1x its FY2017E earnings. On a TTM basis, GIL is one of the cheapest MNCs
600
available as it trades at a PE of 14.0x while other MNCs (having market cap of
500
400
`1,000cr-`5,000cr) trade above the 20.0x mark (median of 33.1x). We maintain
300
our Accumulate rating on the stock and assign a target price of `622 based on a
200
target PE of 11x for FY2017E.
100
0
Key Financials
Y/E Dec (` cr)
CY2012
CY2013
CY2014
FY2016E*
FY2017E
Net Sales
1,481
1,569
1,579
1,888
1,680
% chg
(2.1)
5.9
0.7
19.6
(11.0)
Source: Company, Angel Research
Net Profit
57
94
101
144
130
% chg
(13.4)
66.3
7.6
41.8
(9.1)
EBITDA (%)
6.1
8.9
9.7
12.1
11.9
EPS (`)
24.5
40.8
43.9
62.2
56.6
P/E (x)
23.4
14.0
13.0
9.2
10.1
P/BV (x)
3.7
3.1
2.7
2.2
1.8
RoE (%)
16.9
24.2
22.0
25.9
19.7
RoIC (%)
65.1
95.4
94.6
102.1
75.8
Milan Desai
EV/Sales (x)
0.7
0.6
0.6
0.5
0.5
+91- 22- 4000 3600 Ext: 6846
EV/EBITDA (x)
11.9
7.2
6.2
3.9
4.0
Source: Company, Angel Research; Note: *reporting changed from CY to FY starting January 2015; CMP as Nov. 5, 2015
Please refer to important disclosures at the end of this report
1
Goodyear | 3QFY2016 Result Update
Exhibit 1: 2QFY2016 performance
Y/E December (` cr)
3QFY16 3QCY14*
yoy chg (%)
2QFY16
qoq chg (%) 9MFY2016 9MCY2014
% chg
Net Sales
382
402
(5.0)
432
(11.8)
1089
1222
(10.9)
Net raw material
242
275
(11.9)
278
(13.0)
692
855
(19.1)
(% of Sales)
63.4
68.4
(495)bp
64.3
(92)bp
63.5
70.0
(644)bp
Staff Costs
30
23
26.7
28
6.4
82
68
20.3
(% of Sales)
7.7
5.8
193bp
6.4
132bp
7.5
5.6
195bp
Other Expenses
64
64
1.0
68
(4.5)
184
175
5.5
(% of Sales)
16.9
15.9
100bp
15.6
128bp
16.9
14.3
263bp
Total Expenditure
336
362
(7.1)
374
(10.0)
958
1098
(12.7)
EBITDA
46
40
14.4
59
(22.6)
131
124
5.5
EBITDA margin (%)
11.9
9.9
202bp
13.6
(168)bp
12.0
10.2
186bp
Interest
1
1
(12.7)
1
4.5
2
3
(28.6)
Depreciation
8
7
5.0
8
(4.1)
25
21
18.1
Other Income
7
7
10.3
6
26.7
20
24
(18.6)
PBT
44
38
16.0
56
(20.5)
124
125
12.6
(% of Sales)
11.6
9.5
12.9
11.4
10.2
Tax
15
13
17.6
20
(21.7)
43
43
1.6
(% of PBT)
34.6
34.1
35.1
34.8
34.1
Reported PAT
29
25
15.2
36
(19.9)
81
82
(1.6)
PATM
7.6
6.3
8.4
7.4
6.7
Equity capital (cr)
23
23
23
23
23
EPS (`)
12.6
10.9
15.2
15.7
(19.9)
35.1
35.6
(1.6)
Source: Company, Angel Research; *reporting changed from CY to FY starting January 2015
Exhibit 2: Actual vs. Angel estimates (2QFY2016)
Actual (` cr)
Estimate (` cr)
Var (%)
Total Income
382
412
(7.3)
EBIDTA
46
56
(18.4)
EBIDTA margin (%)
11.9
13.6
(163)bp
Adjusted PAT
29
37
(21.5)
Source: Company, Angel Research
Revenue and margin below expectations
For 3QFY2016, GIL reported numbers that were mostly below our estimates. The
top-line witnessed a decline of 5.0% yoy to `382cr which is below our estimate of
`412cr. The subdued top-line is owing to poor tractor sales coupled with declining
realizations on account of pass through of lower raw material prices. Tractor
volumes for M&M and Escorts, have declined in 1HFY2016 by 20.7% and 19.9%
yoy respectively. As per our estimates, the overall tractor industry witnessed a
volume decline of ~20.3% for the same period. The raw material cost declined by
495bp yoy to 63.4% of sales while employee and other expense increased by
193bp yoy and 100bp yoy to 7.7% and 16.9% of sales respectively. The EBITDA
margin expanded by 202bp yoy to 11.9%. On the back of lower raw material cost,
the net profit for the quarter increased by 15.2% yoy to `29cr.
November 6, 2015
2
Goodyear | 3QFY2016 Result Update
Investment rationale
Focus to be among the leading players in passenger car segment
GIL is targeting towards becoming one of the top players in the passenger car tyre
segment in the next five years. The company is focusing on increasing its presence
in both the OEM and the aftermarket segments. It will be launching new products
and widening its product portfolio in the mid to premium and SUV segments of
passenger vehicles. To reach its goal, the company is weighing both organic as
well as in-organic growth options to expand in the segment. The Management has
indicated that apart from farm and passenger car tyres, it is looking at entering
into newer segments and ramping up newer launches to grow in India.
Continuous innovation to aid growth
GIL is a 74% subsidiary (indirect) of Goodyear Tire & Rubber Company (USA). GIL
benefits from the advanced technology and support from its American parent
which helps it in launching technologically superior products for the Indian
markets. In the past year, it launched Run-on-Flat tyres, which have a capability of
covering a distance of up to 80km after a puncture. Recently, the company has
launched Assurance TripleMax tyre with HYDROGRIP technology, which has the
ability to reduce braking distance by more than 2 meters on wet roads compared
to other tyres. The company had been drawing mixed reviews for its products in
the past. However, the reviews have now turned more favorable with various
measures adopted by the company to further improve the quality of its product
portfolio. Introduction of innovative products and technologies has enabled GIL to
shore up consumer confidence and initiatives like “Worry Free Service Program”
are likely to work in favor of the company going forward.
Strong balance sheet with high RoIC; valuations remain
attractive!
GIL is a debt free-cash rich company with RoIC estimated at 75.8% for FY2017.
The company’s cash and equivalents are expected to be at
`524cr by
FY2017-end, which would amount to ~40% of the current market cap.
As far as valuations are concerned, GIL is among the cheapest MNCs available
with market cap in the range of `1,000cr-`5,000cr. On TTM basis, GIL trades at a
P/E of 14.0x vis-à-vis median TTM PE of ~33.1x for other MNCs. Thus, GIL is
available at an attractive valuation considering the fact that all other MNCs are
trading above the 20.0x mark.
November 6, 2015
3
Goodyear | 3QFY2016 Result Update
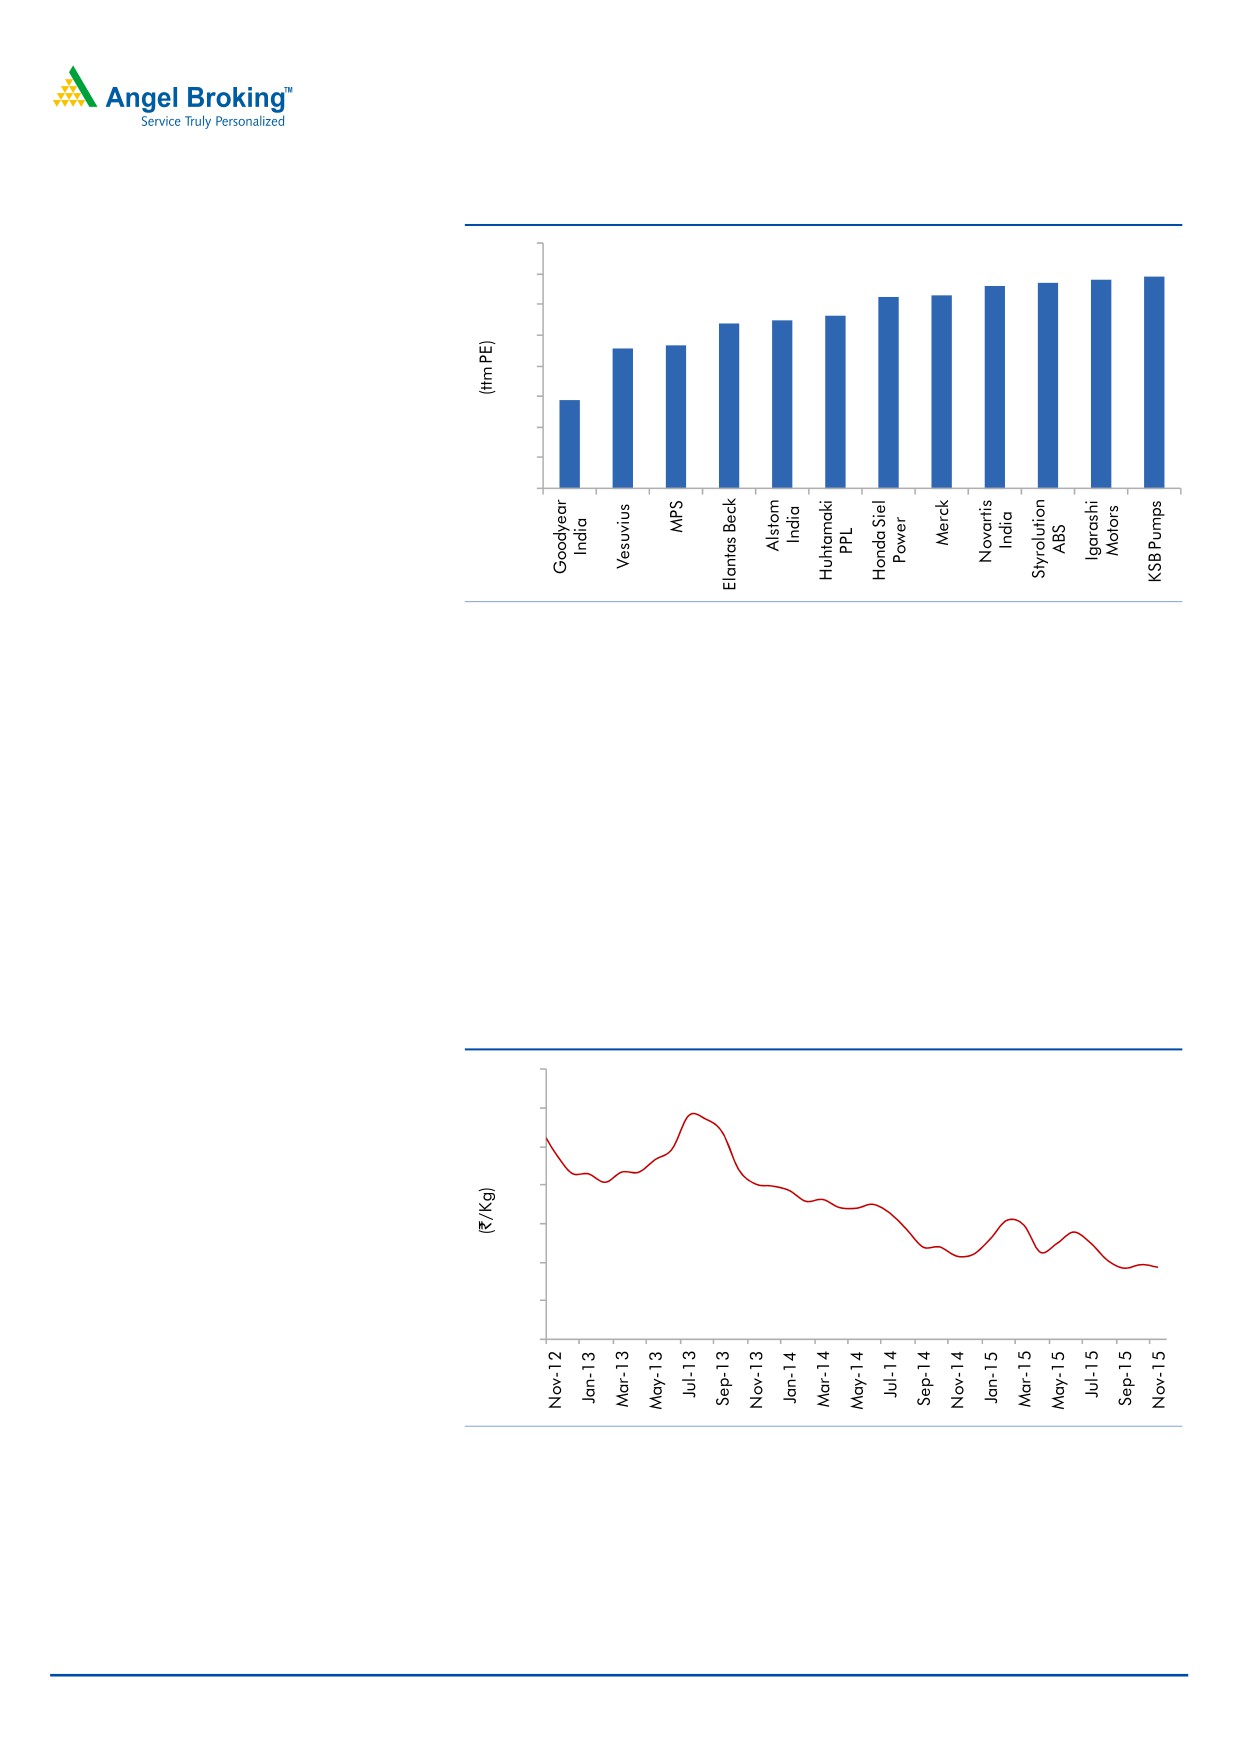
Exhibit 3: On TTM PE basis, GIL is cheapest amongst MNCs
40
34
35
33
34
35
31
32
28
28
30
27
23
23
25
20
14
15
10
5
0
Source: Company, Angel Research
Stable rubber prices to keep margins at current levels
Natural Rubber (NR) has been trading at lower levels in the recent past leading to
tyre companies reporting all-time-high margins. NR prices are unlikely to increase
significantly, tracing high global inventory levels and slowdown in demand from
China. Moreover, price of SBR (synthetic rubber) is expected to remain under
pressure tracing weakness in butadiene prices.
Despite Thai government’s efforts to shore up NR prices by curtailing supplies, NR
continues to show no signs of gaining strength and is likely to remain range
bound, at around current levels. NR currently trades at `112/kg in the domestic
market; we expect it to likely trade at the levels of ~`130/kg in the near future.
Exhibit 4: Domestic Monthly Average Prices
215
195
175
155
135
115
113
95
75
Source: Rubber Board, Angel Research
November 6, 2015
4
Goodyear | 3QFY2016 Result Update
Tractor demand outlook muted in the near term, long term
prospects remain intact
GIL is a market leader in the tractor tyre industry, with a market share of ~22% in
the front tyre segment and ~34% in the rear tyre segment. After a strong
performance in the first two quarters of calendar year 2014, tractor sales declined
on a month on month basis in the latter half of the year. The trend seems to be
continuing with tractor sales being dismal in 2015, mainly due to unseasonal
rains; further, only a moderate increase in minimum support prices (MSPs) this
year has hurt the rural economy, and in turn, tractor sales numbers.
Industry reports suggest that the tractor industry is expected to post a CAGR of 6-
7% over the next five years due to an anticipated increase in MSPs, easy availability
of financing, government initiatives to improve irrigation (aimed at reducing
dependence on erratic monsoon) and need for higher level of tractor penetration.
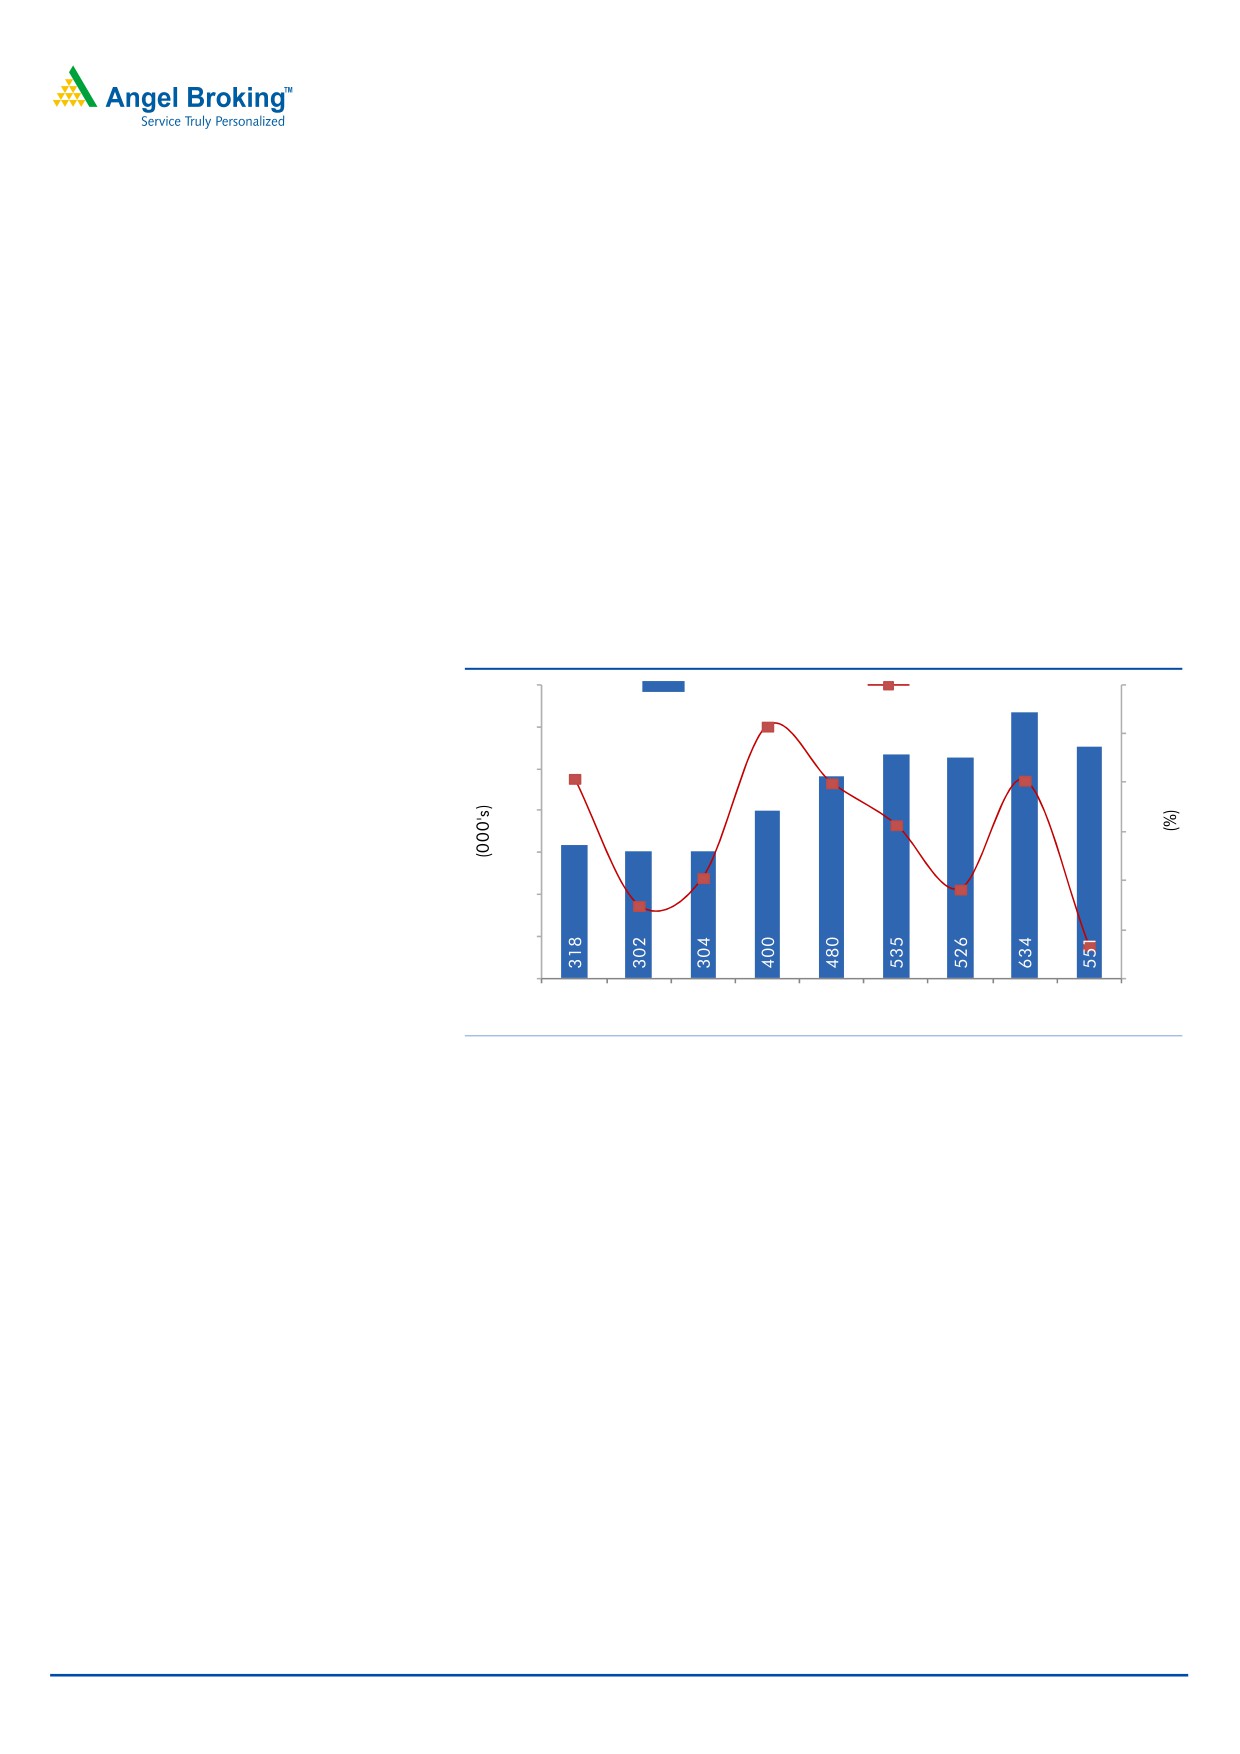
Exhibit 5: Domestic Tractor sales trend
700
Tractor volume (LHS)
yoy growth (RHS)
40
600
31.6
30
500
20.0
20.9
20.5
20
400
11.5
10
300
0.7
0
(5.0)
(1.7)
200
(10)
100
(13
.1)
0
(20)
CY06
CY07
CY08
CY09
CY10
CY11
CY12
CY13
CY14E
Source: TMA, Industry Reports, Angel Research
November 6, 2015
5
Goodyear | 3QFY2016 Result Update
Financials
Revenue growth to recover in CY2016
Although the near term outlook remains subdued owing to poor tractor sales, we
expect stable improvement in the company’s performance over FY2016E-17E
citing recovery in tractor sales, Management’s drive to expands its presence in the
passenger vehicle segment and entry into newer segments. We expect GIL’s
revenue to be at `1,888cr and `1,680cr in FY2016E and FY2017E, respectively.
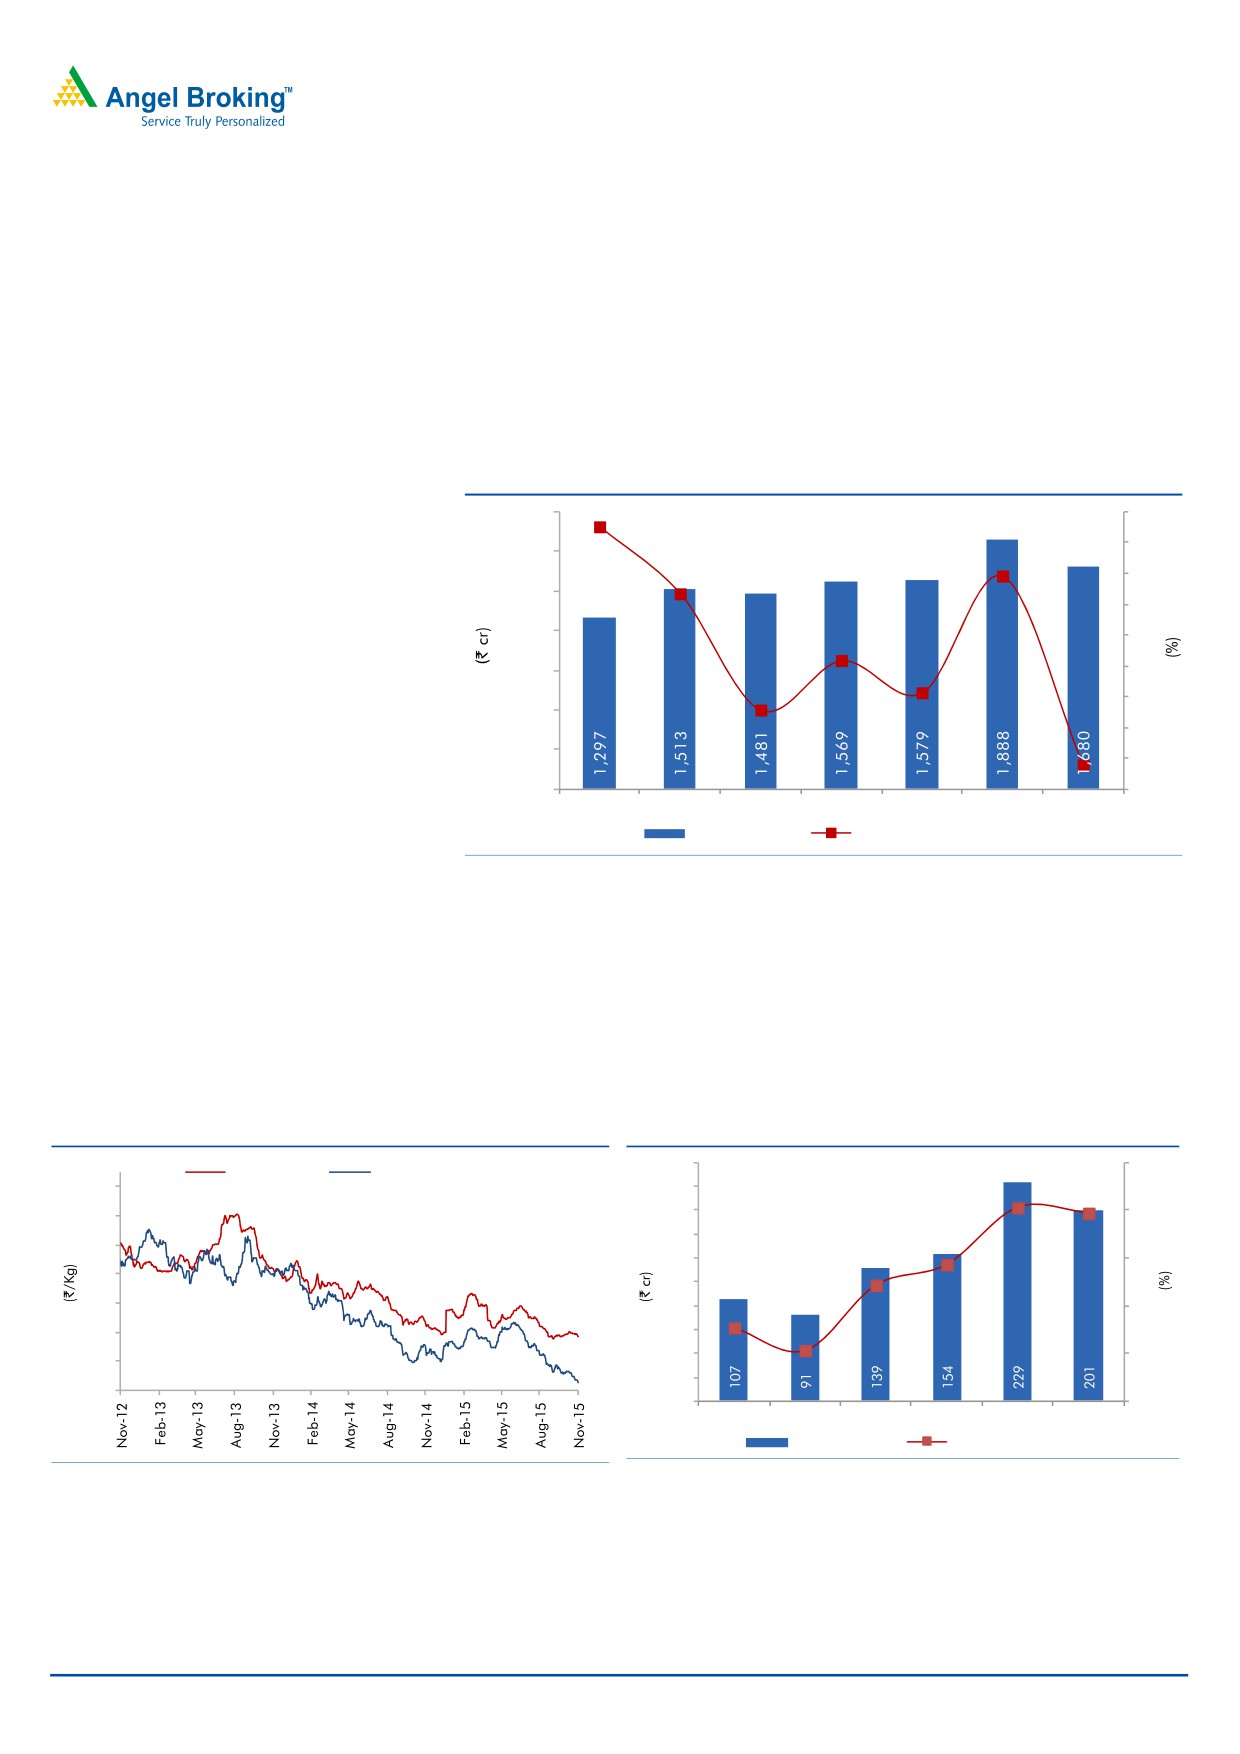
Exhibit 6: Top-line to recover
2,100
30
27.6
25
1,800
19.6
20
16.7
1,500
15
1,200
10
5.9
5
0.7
900
0
(2.1)
600
(5)
300
(11
.0)
(10)
0
(15)
CY2010
CY2011
CY2012
CY2013
CY2014 FY2016E* FY2017E
Revenue (LHS)
Revenue yoy growth (RHS)
Source: Company, Angel Research; *reporting changed from CY to FY starting January 2015
Improvement in margins
Domestic rubber prices have seen a declining trend since November 2011 from
the high of ~`200/kg to current levels of ~`112/kg while international prices are
trading close at ~`81/kg. We expect rubber prices to remain at an average level
of ~`130/kg in FY2016-17E, thus leading the EBITDA margin to be at 11.9%
Exhibit 7: Rubber price trend
Exhibit 8: Improvement in EBITDA margin...
250
14
Domestic Price
International Price
215
225
12.1
11.9
200
12
195
175
175
150
10
9.7
155
125
8.9
135
100
8
115
112
75
7.1
50
6.1
6
95
25
81
75
0
4
CY2011
CY2012
CY2013
CY2014
FY2016E* FY2017E
EBITDA (LHS)
EBITDA margin (RHS)
Source: Rubber Board, Angel Research
Source: Company, Angel Research; *reporting changed from CY to FY
starting January 2015
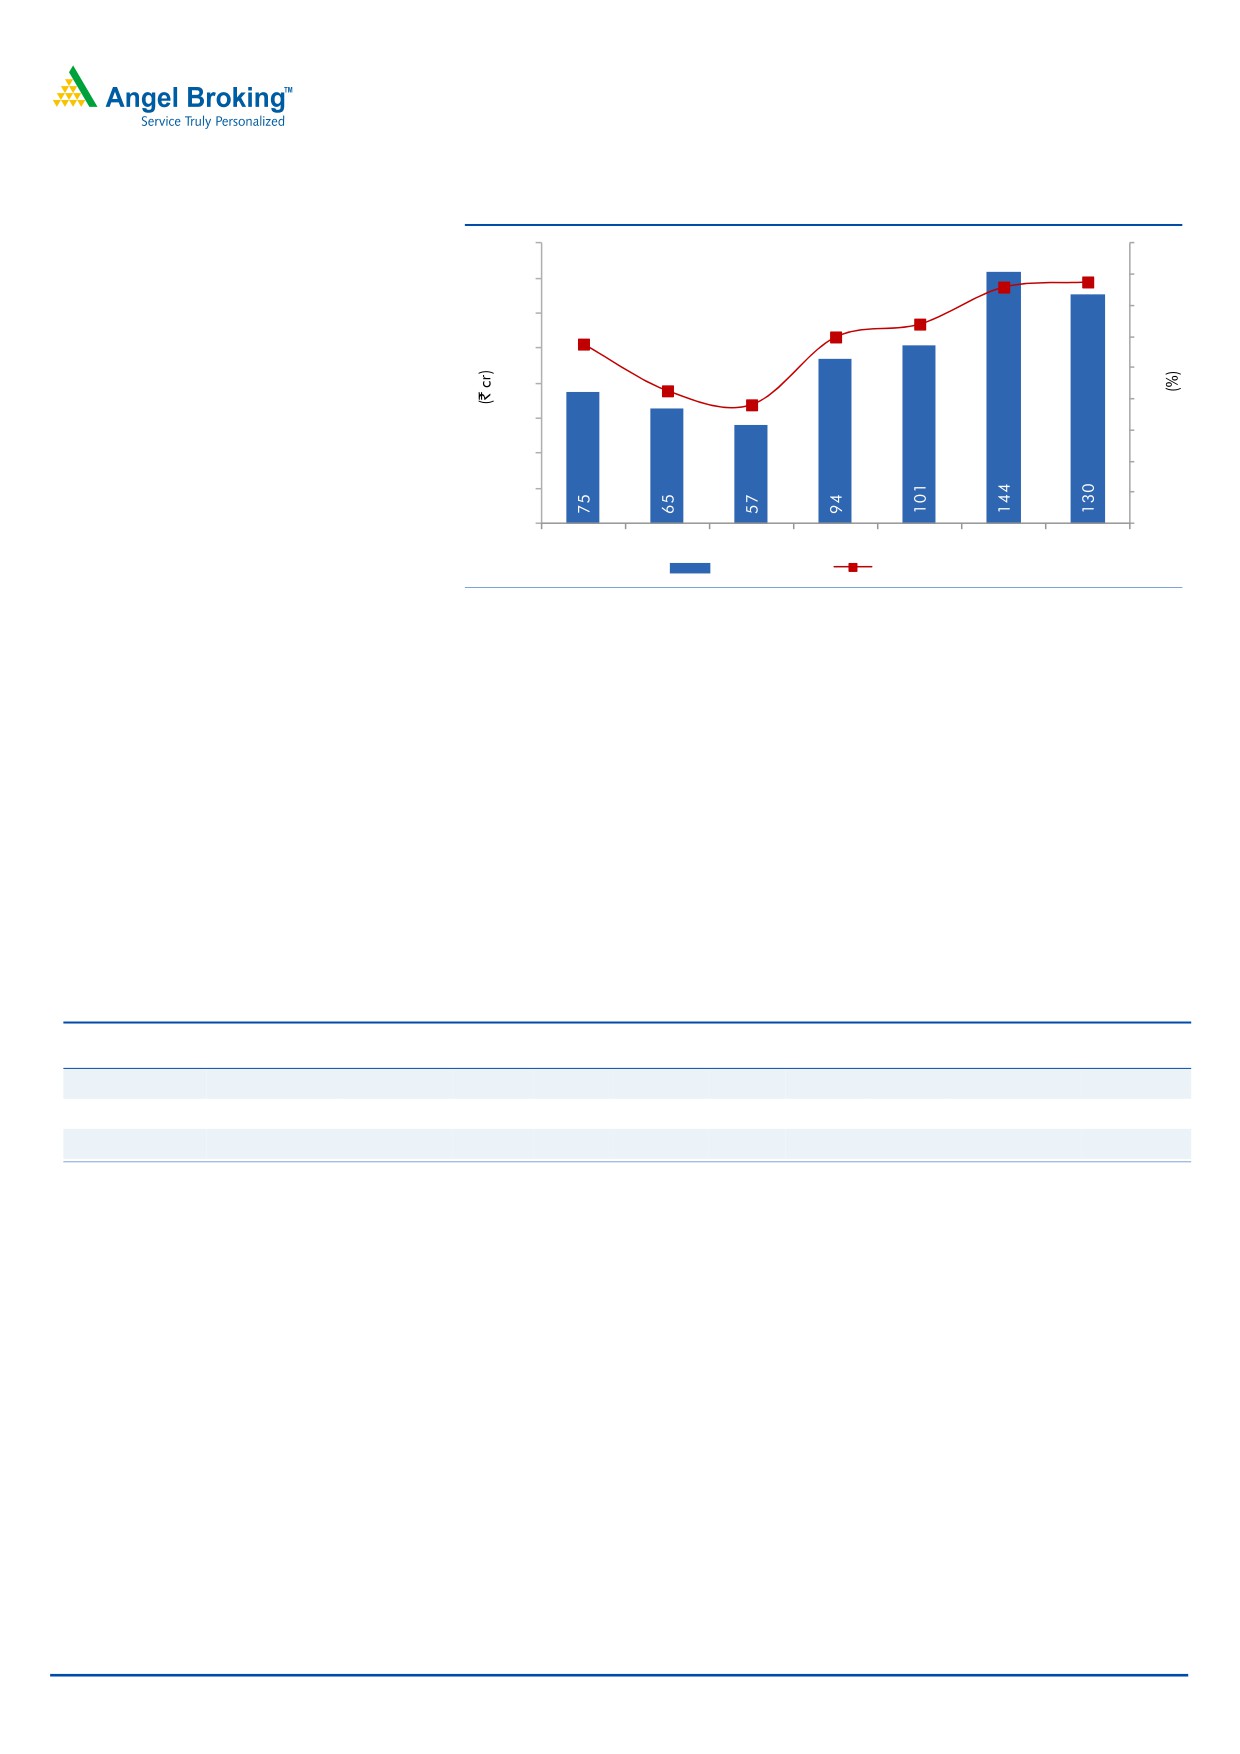
Led by recovery in volumes, coupled with raw material prices remaining at lower
levels, the net profit is expected to be at `144cr and at `130cr in FY2016E and
FY2017E, respectively.
November 6, 2015
6
Goodyear | 3QFY2016 Result Update
Exhibit 9: Net profit trend
160
9
7.8
7.6
140
8
6.4
7
120
6.0
5.8
6
100
4.3
5
80
3.8
4
60
3
40
2
20
1
0
0
CY2010
CY2011
CY2012
CY2013
CY2014
FY2016E* FY2017E
PAT (LHS)
PAT margin (RHS)
Source: Company, Angel Research; *reporting changed from CY to FY starting January 2015
Outlook and valuation
We have estimated the top-line to be at `1,888cr and `1,680cr in FY2016E (15
months) and FY2017E, respectively, while the net profit is expected to be at `144cr
and `130cr for the same period. At the current market price, GIL trades at a PE of
10.1x its FY2017E earnings (14.0x on TTM basis). GIL is among the cheapest
stocks available in the MNC space (with market cap in the range of `1,000cr-
`1,500cr). All other MNCs, falling in a similar market cap range, are trading
above the 20.0x mark on TTM basis with median PE being 33.1x. We maintain our
Accumulate recommendation on the stock and assign a target price of `622 based
on a target PE of 11x for FY2017E.
Exhibit 10: Relative valuation
Sales
OPM
PAT
EPS
ROE
P/E
P/BV
EV/EBITDA
EV/Sales
Year end
(` cr)
(%)
(` cr)
(`)
(%)
(x)
(x)
(x)
(x)
Apollo
FY2017E
12,689
16.0
968
19.0
14.1
8.4
1.1
5.0
0.8
MRF
FY2017E
14,488
21.1
1,611
3,797.9
21.2
10.1
1.9
4.8
1.0
Goodyear
FY2017E
1,680
11.9
130
56.6
19.7
10.1
1.8
4.0
0.5
Source: Angel Research
GIL is fairly priced vis-à-vis its peers in the tyre industry in terms of PE and PBV
multiples considering its high ROE; but it is trading at a relatively lower valuation
of 0.5x EV/Sales multiple based on FY2017E earnings.
November 6, 2015
7
Goodyear | 3QFY2016 Result Update
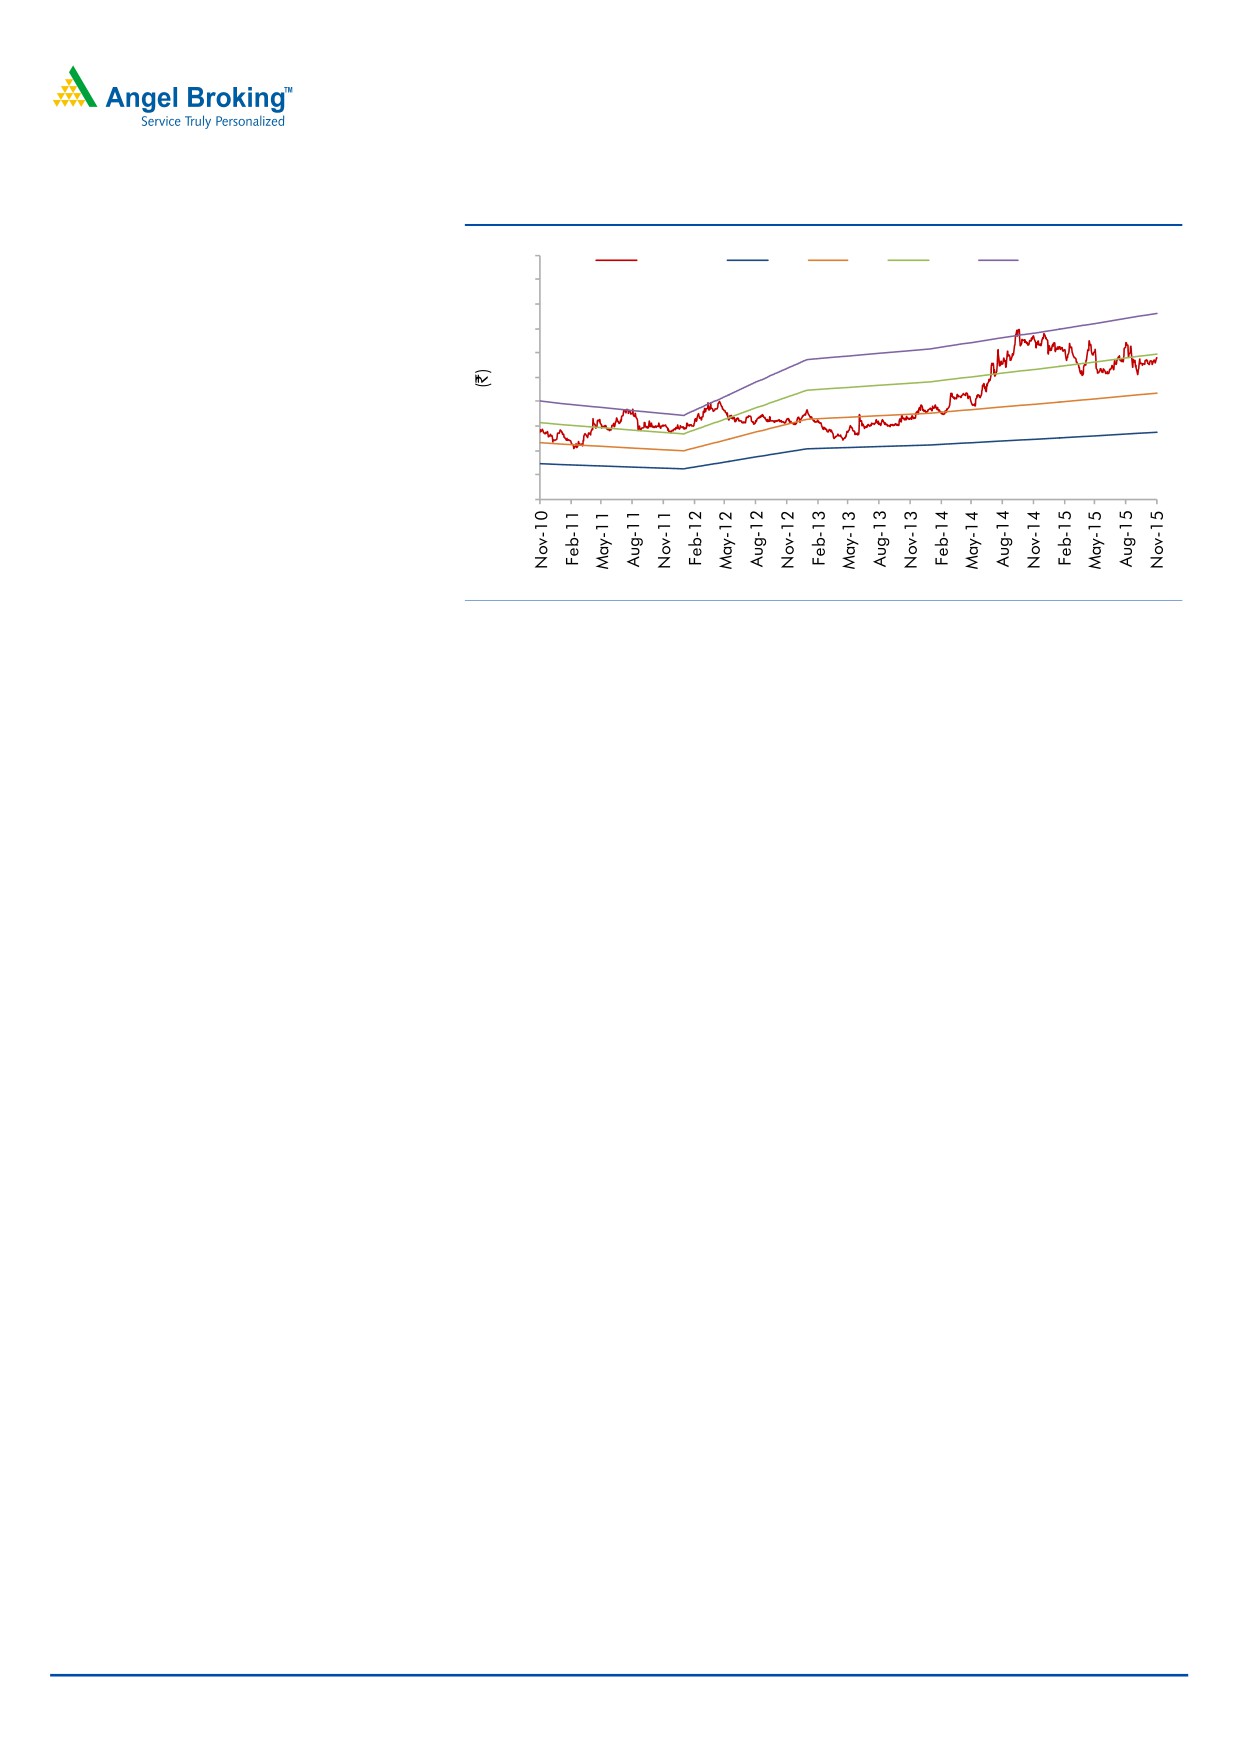
Exhibit 11: One-year forward P/E band
1000
Price (`)
5x
8x
11x
14
900
800
700
600
500
400
300
200
100
0
Source: Company, Angel Research
November 6, 2015
8
Goodyear | 3QFY2016 Result Update
Risks
Volatile rubber prices: Rubber constitutes ~65% of the total raw-material cost in
the manufacture of tyres. Domestic rubber prices have declined from the level of
`200/kg in June 2012 to average levels of `135/kg in CY2014 and to `112/kg
currently. However, any increase in rubber prices would have a negative impact on
the company’s EBITDA margin and consequently on its profit.
Concentrated product portfolio: GIL’s product portfolio is primarily
concentrated to tractor and passenger car tyres. Both these segments constitute
~98% of the total tonnage off-take of the company. Due to high dependency on
these segments, GIL is exposed to the risk of any slowdown in these segments.
Termination of off-take agreement: GIL is in an off-take agreement (on a
non-exclusive basis and can be terminated by either party with a four-month
notice) with Goodyear South Asia Tyres Pvt Ltd, from which it procures passenger
vehicle tyres. Considering that a significant percentage of GIL’s sales are backed
by this agreement, termination of the same may affect GIL’s sales considerably.
Hike in import duty of rubber: In the wake of falling domestic rubber prices, the
Central Government has increased the import duty on natural rubber to lower of
25% or `30/kg, from lower of 20% or `30/kg. Further upward revision in the
import duty will have an adverse impact on GIL’s profitability.
Company Background
GIL is a subsidiary of Goodyear Orient Company (Private) Ltd (a wholly owned
subsidiary of Goodyear Tire and Rubber Company, USA), which holds a 74% stake
in the company. The company majorly caters to the tractor tyre segment, where it
has a market share of ~22.0% in tractor front tyres and ~34.3% in tractor rear
tyres as of CY2012.
November 6, 2015
9
Goodyear | 3QFY2016 Result Update
Profit & Loss Statement
Y/E December (` cr)
CY2012
CY2013
CY2014
FY2016E*
FY2017E
Gross sales
1,613
1,706
1,709
2,048
1,822
Less: Excise duty
132
137
130
160
142
Net Sales
1,481
1,569
1,579
1,888
1,680
Other operating income
-
-
-
-
-
Total operating income
1,481
1,569
1,579
1,888
1,680
% chg
(2.1)
5.9
0.7
19.6
(11.0)
Net Raw Materials
1,102
1,116
1,094
1,210
1,086
Personnel
81
88
99
140
124
Other
207
226
232
310
269
Total Expenditure
1,391
1,430
1,426
1,660
1,480
EBITDA
91
139
154
229
201
% chg
(15.3)
53.2
10.5
49.0
(12.3)
(% of Net Sales)
6.1
8.9
9.7
12.1
11.9
Depreciation
24
25
29
39
35
EBIT
67
114
125
190
166
% chg
(23.7)
70.8
9.9
51.8
(12.8)
(% of Net Sales)
4.5
7.3
7.9
10.1
9.9
Interest & other charges
4
2
3
4
3
Other Income
22
30
32
31
35
(% of sales)
1.5
1.9
2.0
1.6
2.1
PBT
85
142
154
217
198
% chg
(12.1)
67.7
8.2
41.7
(9.1)
Tax
28
48
52
74
67
(% of PBT)
33.5
33.7
34.0
34.0
34.0
PAT (reported)
56
94
101
144
130
Extraordinary (Exp)/Inc.
(0)
-
-
-
-
ADJ. PAT
57
94
101
144
130
% chg
(13.4)
66.3
7.6
41.8
(9.1)
(% of Net Sales)
3.8
6.0
6.4
7.6
7.8
Basic EPS (`)
24.5
40.8
43.9
62.2
56.6
Fully Diluted EPS (`)
24.5
40.8
43.9
62.2
56.6
% chg
(12.4)
66.3
7.6
41.8
(9.1)
*reporting changed from CY to FY starting January 2015
November 6, 2015
10
Goodyear | 3QFY2016 Result Update
Balance Sheet
Y/E December (` cr)
CY2012
CY2013
CY2014E
FY2016E*
FY2017E
SOURCES OF FUNDS
Equity Share Capital
23
23
23
23
23
Preference Capital
-
-
-
-
-
Reserves& Surplus
331
400
474
589
692
Shareholders’ Funds
354
424
497
613
715
Minority Interest
-
-
-
-
-
Total Loans
-
-
-
-
-
Deferred Tax Liability
11
13
14
12
12
Other Long Term Liabilities
-
3
5
4
4
Long Term Provisions
19
20
21
25
22
Total Liabilities
384
459
536
653
753
APPLICATION OF FUNDS
Gross Block
398
430
481
541
595
Less: Acc. Depreciation
201
220
241
280
316
Net Block
198
210
240
261
280
Capital Work-in-Progress
17
32
17
10
10
Goodwill
-
-
-
-
-
Investments
-
-
-
-
-
Long Term Loans and adv.
19
17
19
15
15
Other non-current assets
0
0
1
1
1
Current Assets
507
600
617
701
823
Cash
238
317
365
425
524
Loans & Advances
6
10
6
11
10
Inventory
104
99
123
124
133
Debtors
154
165
112
133
148
Other Current Assets
4
9
10
8
8
Current liabilities
357
400
358
335
376
Net Current Assets
150
200
259
366
447
Misc. Exp. not written off
-
-
-
-
-
Total Assets
384
459
536
653
753
*reporting changed from CY to FY starting January 2015
November 6, 2015
11
Goodyear | 3QFY2016 Result Update
Cash Flow Statement
Y/E December (` cr)
CY2012
CY2013
CY2014E FY2016E* FY2017E
Profit before tax
85
142
154
217
198
Depreciation
24
25
29
39
35
Change in Working Capital
(40)
29
(11)
(46)
18
Other income
(22)
(30)
(32)
(31)
(35)
Direct taxes paid
(28)
(48)
(52)
(75)
(67)
Others
7
14
12
-
-
Cash Flow from Operations
26
131
99
104
149
(Inc.)/Dec. in Fixed Assets
(23)
(46)
(36)
(53)
(54)
(Inc.)/Dec. in Investments
-
-
-
-
-
(Incr)/Decr In L.T. loan and adv.
(4)
2
(2)
3
-
Other income
22
30
32
31
35
Others
(10)
(18)
(17)
-
-
Cash Flow from Investing
(14)
(32)
(24)
(19)
(19)
Issue of Equity
-
-
-
-
-
Inc./(Dec.) in loans
-
-
2
(1)
-
Inc./(Dec.) in L.T. Pro. & Liab.
1
1
1
4
(3)
Dividend Paid (Incl. Tax)
(19)
(24)
(28)
(28)
(28)
Others
(5)
3
(2)
-
-
Cash Flow from Financing
(23)
(21)
(27)
(25)
(30)
Inc./(Dec.) in Cash
(11)
78
48
60
99
Opening Cash balances
249
238
317
365
425
Closing Cash balances
238
317
365
425
524
*reporting changed from CY to FY starting January 2015
November 6, 2015
12
Goodyear | 3QFY2016 Result Update
Key Ratios
Y/E December
CY2012
CY2013
CY2014E
CY2015E
CY2016E
Valuation Ratio (x)
P/E (on FDEPS)
23.4
14.0
13.0
9.2
10.1
P/CEPS
16.4
11.1
10.2
7.2
8.0
P/BV
3.7
3.1
2.7
2.2
1.8
Dividend yield (%)
1.2
1.6
1.7
1.7
1.7
EV/Sales
0.7
0.6
0.6
0.5
0.5
EV/EBITDA
11.9
7.2
6.2
3.9
4.0
EV / Total Assets
2.8
2.2
1.8
1.4
1.1
Per Share Data (`)
EPS (Basic)
24.5
40.8
43.9
62.2
56.6
EPS (fully diluted)
24.5
40.8
43.9
62.2
56.6
Cash EPS
35.0
51.7
56.3
79.1
71.8
DPS
7.0
9.0
10.0
10.0
10.0
Book Value
153.5
183.6
215.4
265.6
310.1
Dupont Analysis
EBIT margin
4.5
7.3
7.9
10.1
9.9
Tax retention ratio
0.7
0.7
0.7
0.7
0.7
Asset turnover (x)
14.5
13.1
11.9
10.2
7.7
ROIC (Post-tax)
43.4
63.2
62.4
67.4
50.0
Cost of Debt (Post Tax)
-
-
-
-
-
Leverage (x)
(0.7)
(0.7)
(0.7)
(0.7)
(0.7)
Operating ROE
14.2
16.0
16.6
20.6
13.4
Returns (%)
ROCE (Pre-tax)
18.3
27.0
25.1
31.9
23.5
Angel ROIC (Pre-tax)
65.1
95.4
94.6
102.1
75.8
ROE
16.9
24.2
22.0
25.9
19.7
Turnover ratios (x)
Asset Turnover
3.8
3.8
3.5
3.7
3.0
Inventory / Sales (days)
23
24
26
30
28
Receivables (days)
35
37
32
32
32
Payables (days)
118
124
126
126
126
WC (ex-cash) (days)
(27)
(24)
(26)
(20)
(15)
Solvency ratios (x)
Net debt to equity
(0.7)
(0.7)
(0.7)
(0.7)
(0.7)
Net debt to EBITDA
(2.6)
(2.3)
(2.4)
(1.9)
(2.6)
Interest Coverage
17.5
52.7
36.7
53.9
63.7
*reporting changed from CY to FY starting January 2015
November 6, 2015
13
Goodyear | 3QFY2016 Result Update
Research Team Tel: 022 - 39357800
DISCLAIMER
Angel Broking Private Limited (hereinafter referred to as “Angel”) is a registered Member of National Stock Exchange of India Limited,
Bombay Stock Exchange Limited and Metropolitian Stock Exchange of India Limited. It is also registered as a Depository Participant
with CDSL and Portfolio Manager with SEBI. It also has registration with AMFI as a Mutual Fund Distributor. Angel Broking Private
Limited is a registered entity with SEBI for Research Analyst in terms of SEBI (Research Analyst) Regulations, 2014 vide registration
number INH000000164. Angel or its associates has not been debarred/ suspended by SEBI or any other regulatory authority for
accessing /dealing in securities Market. Angel or its associates including its relatives/analyst do not hold any financial
interest/beneficial ownership of more than 1% in the company covered by Analyst. Angel or its associates/analyst has not received any
compensation / managed or co-managed public offering of securities of the company covered by Analyst during the past twelve
months. Angel/analyst has not served as an officer, director or employee of company covered by Analyst and has not been engaged in
market making activity of the company covered by Analyst.
This document is solely for the personal information of the recipient, and must not be singularly used as the basis of any investment
decision. Nothing in this document should be construed as investment or financial advice. Each recipient of this document should
make such investigations as they deem necessary to arrive at an independent evaluation of an investment in the securities of the
companies referred to in this document (including the merits and risks involved), and should consult their own advisors to determine
the merits and risks of such an investment.
Reports based on technical and derivative analysis center on studying charts of a stock's price movement, outstanding positions and
trading volume, as opposed to focusing on a company's fundamentals and, as such, may not match with a report on a company's
fundamentals.
The information in this document has been printed on the basis of publicly available information, internal data and other reliable
sources believed to be true, but we do not represent that it is accurate or complete and it should not be relied on as such, as this
document is for general guidance only. Angel Broking Pvt. Limited or any of its affiliates/ group companies shall not be in any way
responsible for any loss or damage that may arise to any person from any inadvertent error in the information contained in this report.
Angel Broking Pvt. Limited has not independently verified all the information contained within this document. Accordingly, we cannot
testify, nor make any representation or warranty, express or implied, to the accuracy, contents or data contained within this document.
While Angel Broking Pvt. Limited endeavors to update on a reasonable basis the information discussed in this material, there may be
regulatory, compliance, or other reasons that prevent us from doing so.
This document is being supplied to you solely for your information, and its contents, information or data may not be reproduced,
redistributed or passed on, directly or indirectly.
Neither Angel Broking Pvt. Limited, nor its directors, employees or affiliates shall be liable for any loss or damage that may arise from
or in connection with the use of this information.
Note: Please refer to the important ‘Stock Holding Disclosure' report on the Angel website (Research Section). Also, please refer to the
latest update on respective stocks for the disclosure status in respect of those stocks. Angel Broking Pvt. Limited and its affiliates may
have investment positions in the stocks recommended in this report.
Disclosure of Interest Statement
Goodyear India
1. Analyst ownership of the stock
No
2. Angel and its Group companies ownership of the stock
No
3. Angel and its Group companies' Directors ownership of the stock
No
4. Broking relationship with company covered
No
Note: We have not considered any Exposure below ` 1 lakh for Angel, its Group companies and Directors
Ratings (Based on expected returns
Buy (> 15%)
Accumulate (5% to 15%)
Neutral (-5 to 5%)
over 12 months investment period):
Reduce (-5% to -15%)
Sell (< -15%)
November 6, 2015
14