Initiating Coverage | Auto Ancillary
December 22, 2015
Gabriel India
BUY
CMP
`87
Shocks absorbed; smooth ride ahead
Target Price
`101
Gabriel India Ltd (Gabriel) is one of the leading manufacturers of ride control
Investment Period
12 Months
products viz shock absorbers, front forks and struts across automotive segments. It
commands a market share of 25% in both two-wheelers and passenger vehicles and
Stock Info
is the market leader in commercial vehicles segment with a 75% market share.
Sector
Auto Ancillary
Recovery in two-wheelers bodes well for Gabriel
Market Cap (` cr)
1,256
The two-wheeler industry, which contributes ~52% of Gabriel’s revenues, is
poised to recover (we expect 7% CAGR growth over next two years on account of
Net Debt (` cr)
2
acceleration in urban markets (60% of 2W demand) due to better economic
Beta
1.1
growth and further easing of interest rates. Also, the implementation of the
52 Week High / Low
107/72
Seventh Commission would result in ~23% pay hike for about 5mn central
Avg. Daily Volume
36,354
government employees & the expected subsequent hikes for
12 mn state
Face Value (`)
1
government employees would aid demand recovery. (Implementation of Sixth pay
commission in FY09 had contributed to 25% growth both in FY10 and FY11).
BSE Sensex
25,736
Gabriel to outpace 2W industry on market share gains by key clients
Nifty
7,834
Gabriel is likely to outpace the two-wheeler industry growth on back of market
Reuters Code
GABR.BO
share gains of its key clients viz Honda India, TVS Motors and Royal Enfield (which
Bloomberg Code
GABR@IN
form 75% of 2W revenues) due to expansion of their distribution reach, new
products and increased proportion of fast growing scooters. GIL is likely to
register 9-10% growth in 2W as against industry growth of 7%
Shareholding Pattern (%)
Healthy growth in PV and CV segment to boost revenues
Promoters
54.6
We expect PV segment (27% of revenues) to grow a healthy 8% due to better OEM
MF / Banks / Indian Fls
8.4
industry growth and entry into new platforms. CV OEM segment (9% of revenues)
FII / NRIs / OCBs
10.7
is expected to grow 15% over next two years due to higher freight availability.
Indian Public / Others
26.3
Aftermarket and export segments to be key growth drivers
Increased shift towards branded product and new product introduction coupled
with GIL strategy to initiate supplies to OEM’s overseas arms and taping
Abs. (%)
3m 1yr 3yr
aftermarket exports would result in 15% CAGR for both aftermarket and exports
over next two years.
Sensex
(1.7)
(6.0)
33.7
Outlook and valuation: Two-wheeler recovery coupled with market share gains,
Gabriel
1.5
(0.8)
220.9
healthy growth in passenger vehicle segment, increased focus on aftermarket and
exports are likely to lead to a 10% CAGR in revenue for Gabriel over FY2016-2018
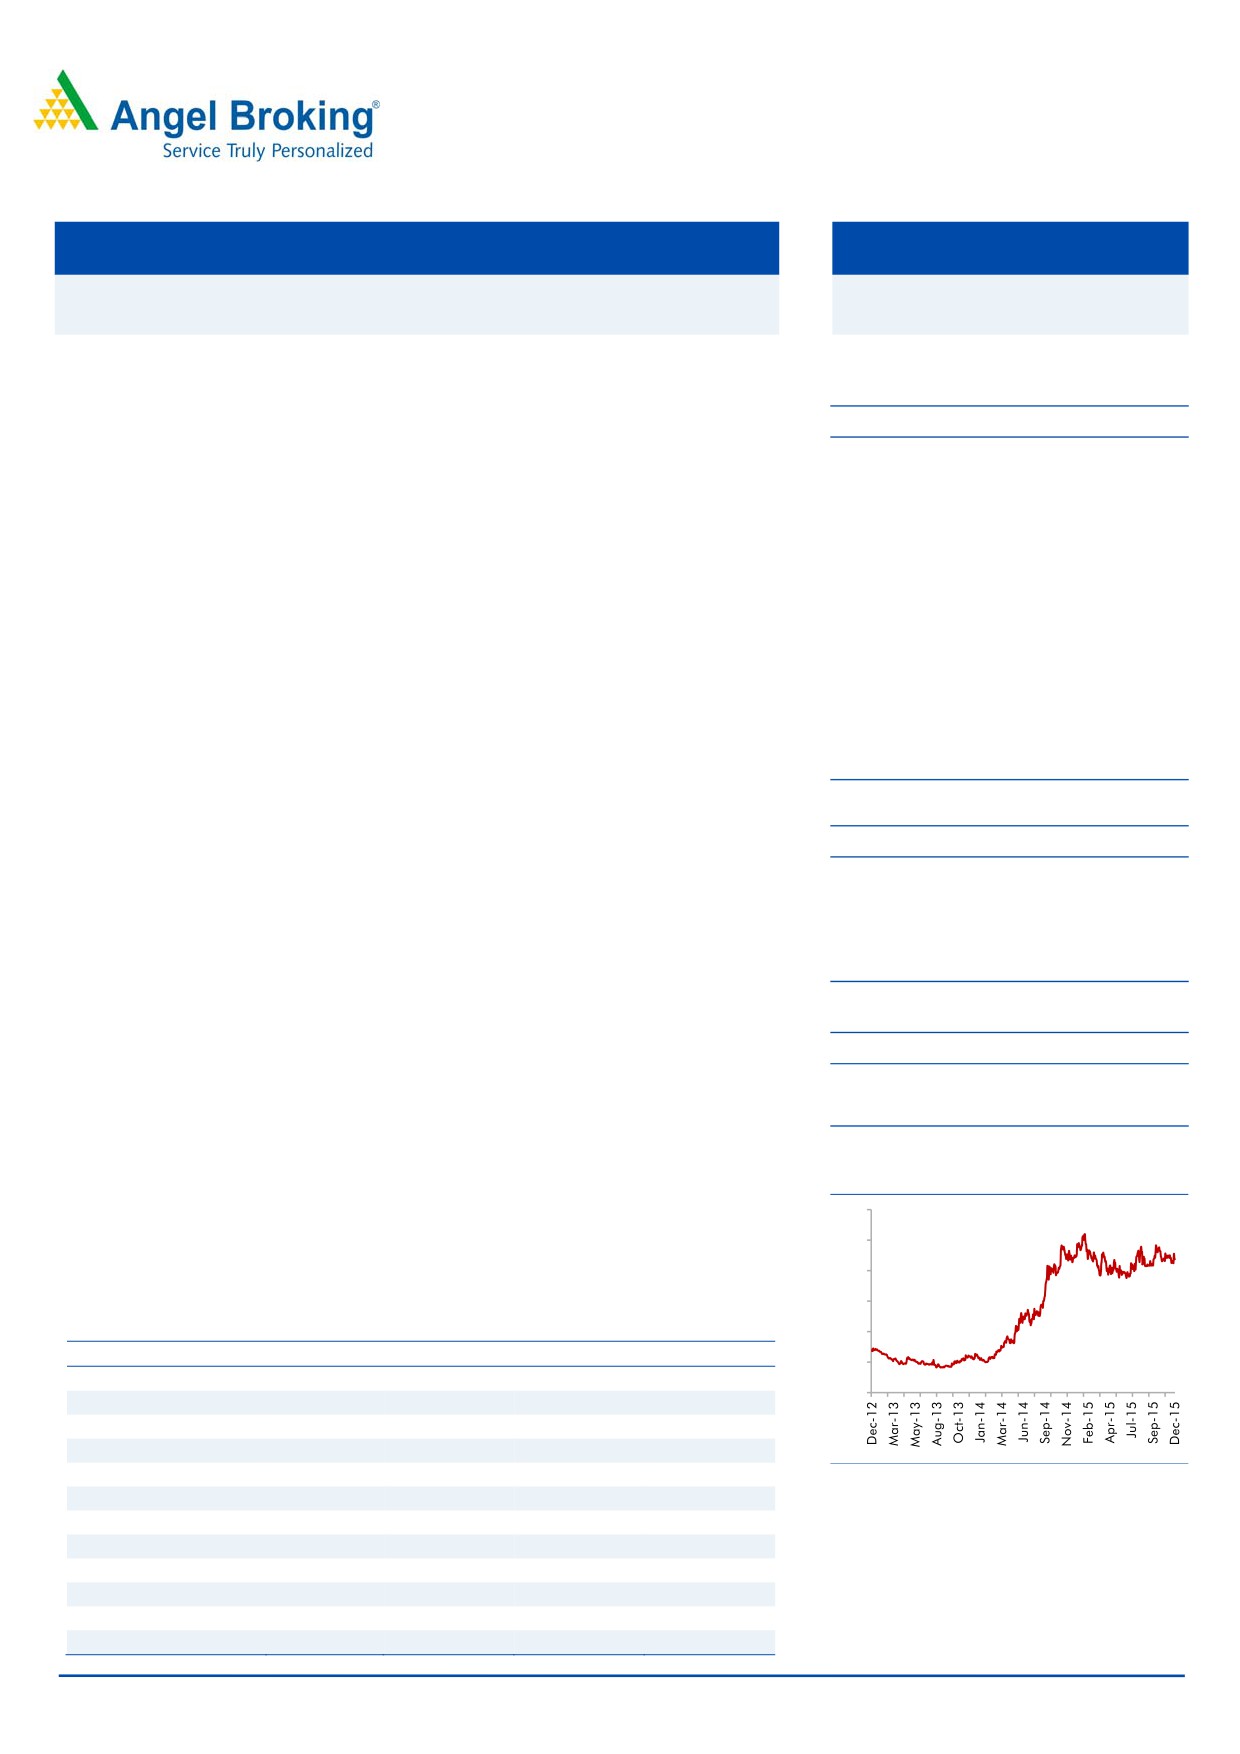
3-Year Daily price chart
period. Gabriel’s margins are also expected to improve by 60bp in the next two years
120
on back of operating leverage and cost control measures, resulting into 17% earnings
100
CAGR over the next two years. GIL is a quality ancillary company with bright earnings
growth, healthy return ratios and attractive valuations. We initiate coverage on Gabriel
80
with Buy rating and target price of `101 (based on 16x FY2018E earnings).
60
Key financials
40
Y/E March (` cr)
FY2015
FY2016E
FY2017E
FY2018E
20
Net sales
1,444
1,415
1,544
1,715
0
% chg
12.2
(2.0)
9.1
11.1
Net profit (Adj.)
61
66
78
90
% chg
29.5
9.1
17.4
16.6
EBITDA margin (%)
8.1
8.7
9.0
9.3
Source: Company, Angel Research
EPS (`)
4.2
4.6
5.4
6.3
P/E (x)
20.6
18.9
16.1
13.8
P/BV (x)
3.8
3.4
3.0
2.7
RoE (%)
18.6
18.1
18.9
19.5
RoCE (%)
25.5
24.0
24.7
25.5
Bharat Gianani
EV/Sales (x)
0.9
0.9
0.8
0.7
022-39357800 Ext: 6817
EV/EBITDA (x)
10.7
9.8
8.4
7.2
Source: Company, Angel Research; CMP as of December 21, 2015
Please refer to important disclosures at the end of this report
1
Gabriel India | Initiating Coverage
Investment Arguments
Two-wheeler volumes to recover in FY2017
The two-wheeler industry slowed down considerably in the last 4 quarters with the
segment reporting flattish volumes. (January 2015-November 2015) volumes grew
marginally by 1%. A decline in rural volumes on account of two consecutive years
of deficient rainfall led to sluggishness in two-wheeler sales. Rural sales account for
~40% of total two-wheeler volumes and are estimated to have dipped by 3% to
4% during January 2015-November 2015; while urban volumes are expected to
have grown by 4% to 5% during the same period.
We expect the two-wheeler industry to return to the growth trajectory in FY2017
and realign with its long term CAGR of ~10%. Acceleration in urban volumes on
account of better economic growth, resulting in higher incomes in the hands of
consumers, coupled with a further reduction in interest rates, are likely to boost
volumes. Further, the implementation of the Seventh Pay Commission
(recommending a 23% average salary hike) would result in higher incomes for
5mn government employees and this would act as an important catalyst for growth
in two-wheeler demand. Earlier in FY2009, when the Sixth Pay Commission had
declared a 35% salary hike, two-wheeler volumes resultantly witnessed buoyancy
in FY2010 and FY2011 (volumes grew by 25% in each year). Post the pay hike for
central government employees, various state governments (state govt employs
about 12 million) also raise salaries, which could further stoke demand. Also, a
gradual recovery in rural demand on expectations of a normal monsoon in
FY2017 and increase in Minimum Support Prices (MSPs) for agricultural output
would also aid recovery, going ahead. Gabriel, which draws 50% of its sales from
the 2WOEM segment, is likely to benefit from an expected recovery in the two-
wheeler segment.
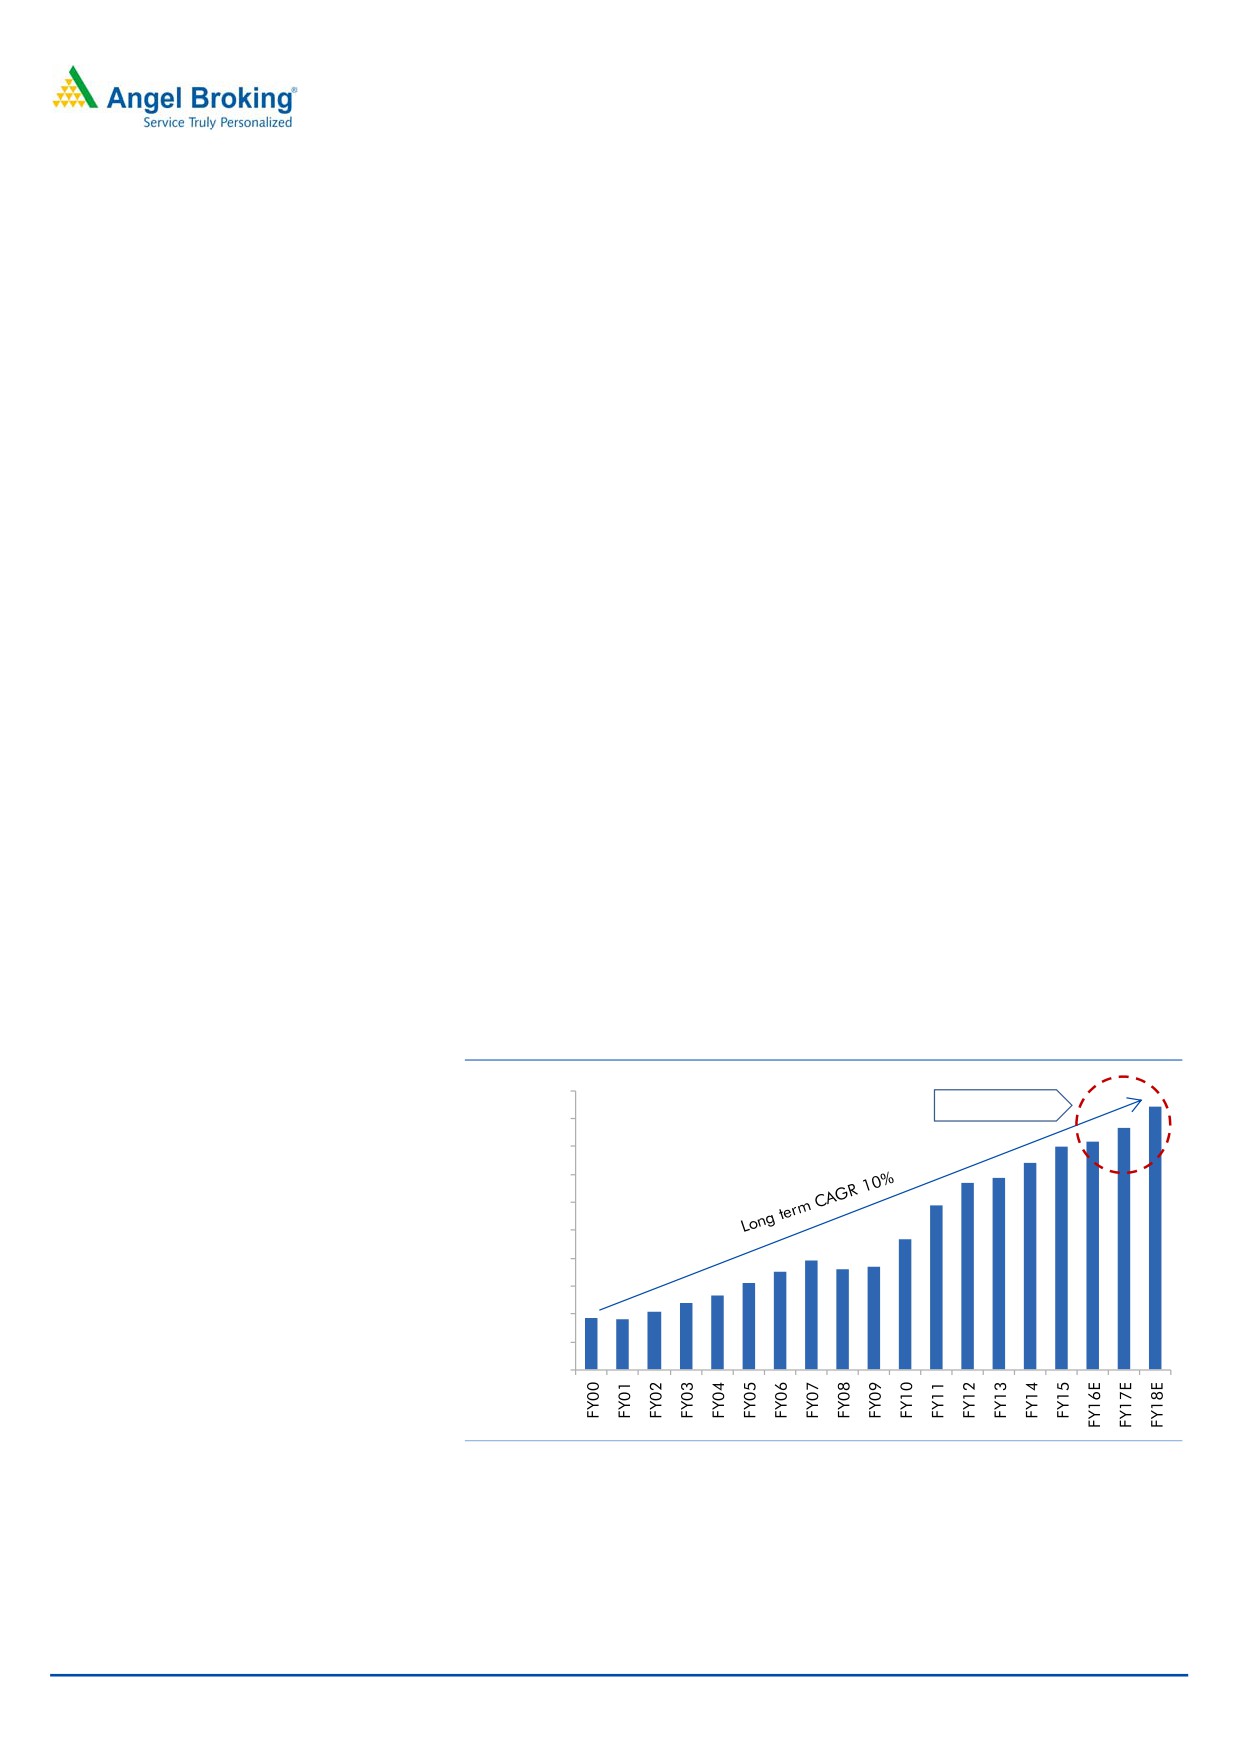
Exhibit 1: Two-wheeler industry growth trend
20,000,000
Implied CAGR 7%
18,000,000
16,000,000
14,000,000
12,000,000
10,000,000
8,000,000
6,000,000
4,000,000
2,000,000
0
Source:SIAM, Angel Research
December 22, 2015
2
Gabriel India | Initiating Coverage
Increased sourcing and market share gains of key customers to
enable Gabriel outpace two-wheeler industry growth
Gabriel’s key customers TVS Motors, Honda Motorcycles and Scooters India (HMSI)
and Royal Enfield, which form about 75% of its two-wheeler segment sales and
38% of the overall revenues, are poised to outgrow the two wheeler industry and
gain market share. TVS Motors and HMSI are expected to gain market share on
the back of new product launches, widening of their distribution reach and higher
proportion of the fast growing scooters (scooter constitutes 60% and 35% of HMSI
and TVS two wheeler volumes respectively). Further, Royal Enfield is also expected
to outpace the industry with a rising trend of leisure biking, a segment where it is
the market leader. We expect Gabriel’s key customers to gain 100-150bp market
share over the next two years, thereby enabling it to outpace the two-wheeler
industry growth.
Further, Gabriel is likely to increase sourcing to HMSI. Post the split with the Hero
group, HMSI is looking to increasingly source supplies from non-Hero vendors
which puts Gabriel in a favorable position. Gabriel is expected to receive increased
orders from HMSI’s upcoming plant in Gujarat which is likely to commence
operations in 4QFY2016. Gabriel’s share of business from HMSI currently stands
at 35% and is expected to reach 40% levels over the next two years. The above
factors are likely to enable Gabriel to report 9-10% growth in the two-wheeler
segment in the next two years as against industry growth of about 7%.
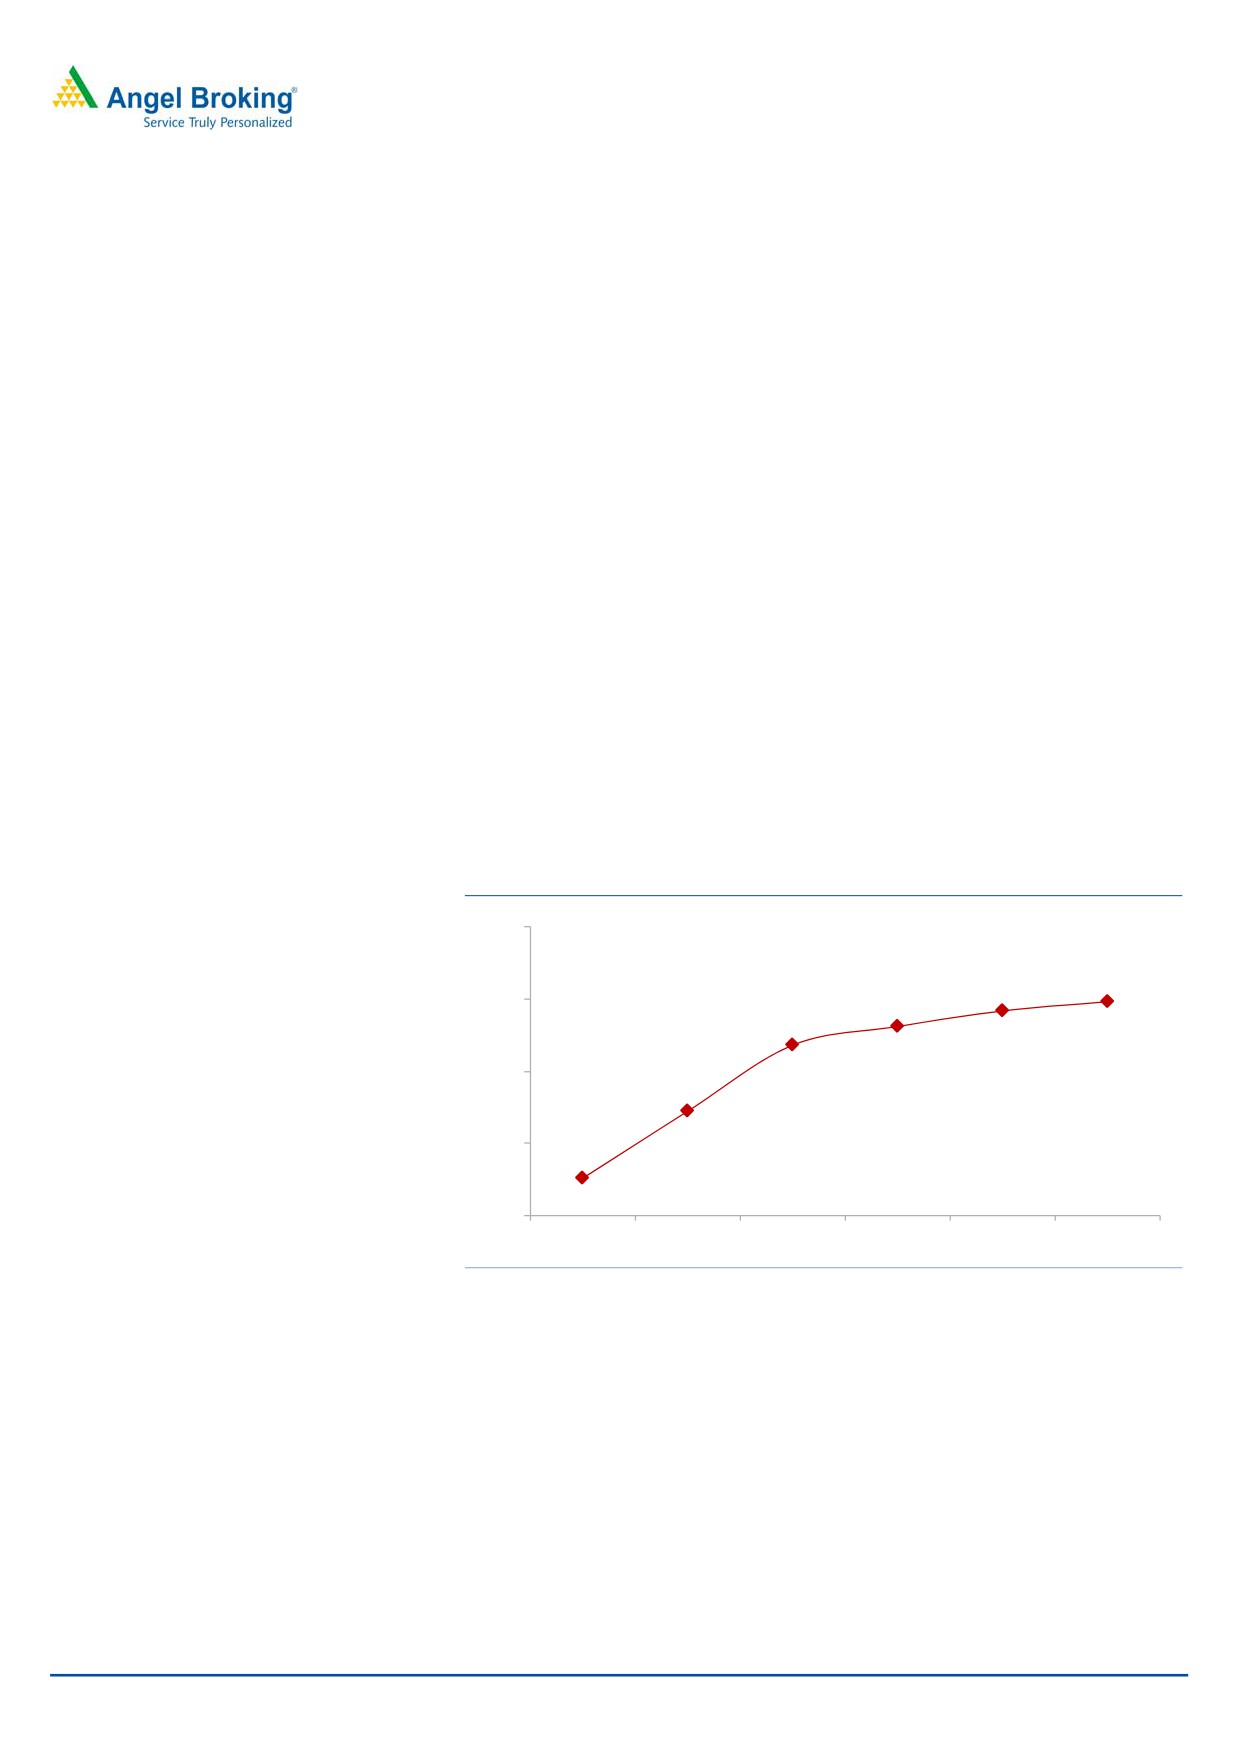
Exhibit 2: Two wheeler market share of key customers
50%
45%
40%
35%
30%
FY13
FY14
FY15
FY16E
FY17E
FY18E
Source: SIAM, Angel Research
Aftermarket and export segment to be the key growth drivers
Gabriel is increasing focus on growing revenues in the aftermarket space. It has
been successful in leveraging its brand image and strong relationships with OEMs
to increase presence in the aftermarket segment. The company’s aftermarket
revenues have grown at a CAGR of 18% over the last five years and currently
account for 13% of the top-line. The company has recently launched suspension
allied products such as front row coils and bush kits which will augment its
revenues. Further, the company is also introducing new products, viz wheel rims
and coolants, which would further drive its sales in the aftermarket space. Also,
increasing preference for branded products is likely to lead to shift from the
December 22, 2015
3
Gabriel India | Initiating Coverage
unorganized segment (unorganized players accounts for about 30%-35% of the
overall market) thus benefitting players like Gabriel who already have a large
OEM base and strong recall. The company is expecting a healthy double-digit
growth in the aftermarket space and is aiming to increase aftermarket revenues
from 13% currently to 15% over the next two years.
Similarly, Gabriel is focusing on increasing its export revenues by tapping overseas
arms of the OEMs to whom it is currently supplying in India. The company has
received approval from SML Isuzu and the supplies would commence from
4QFY2016. The company is also tapping the aftermarket segment in the export
markets to drive growth. It is aiming to increase export revenues from the current
3% to about 10% over the next two to three years.
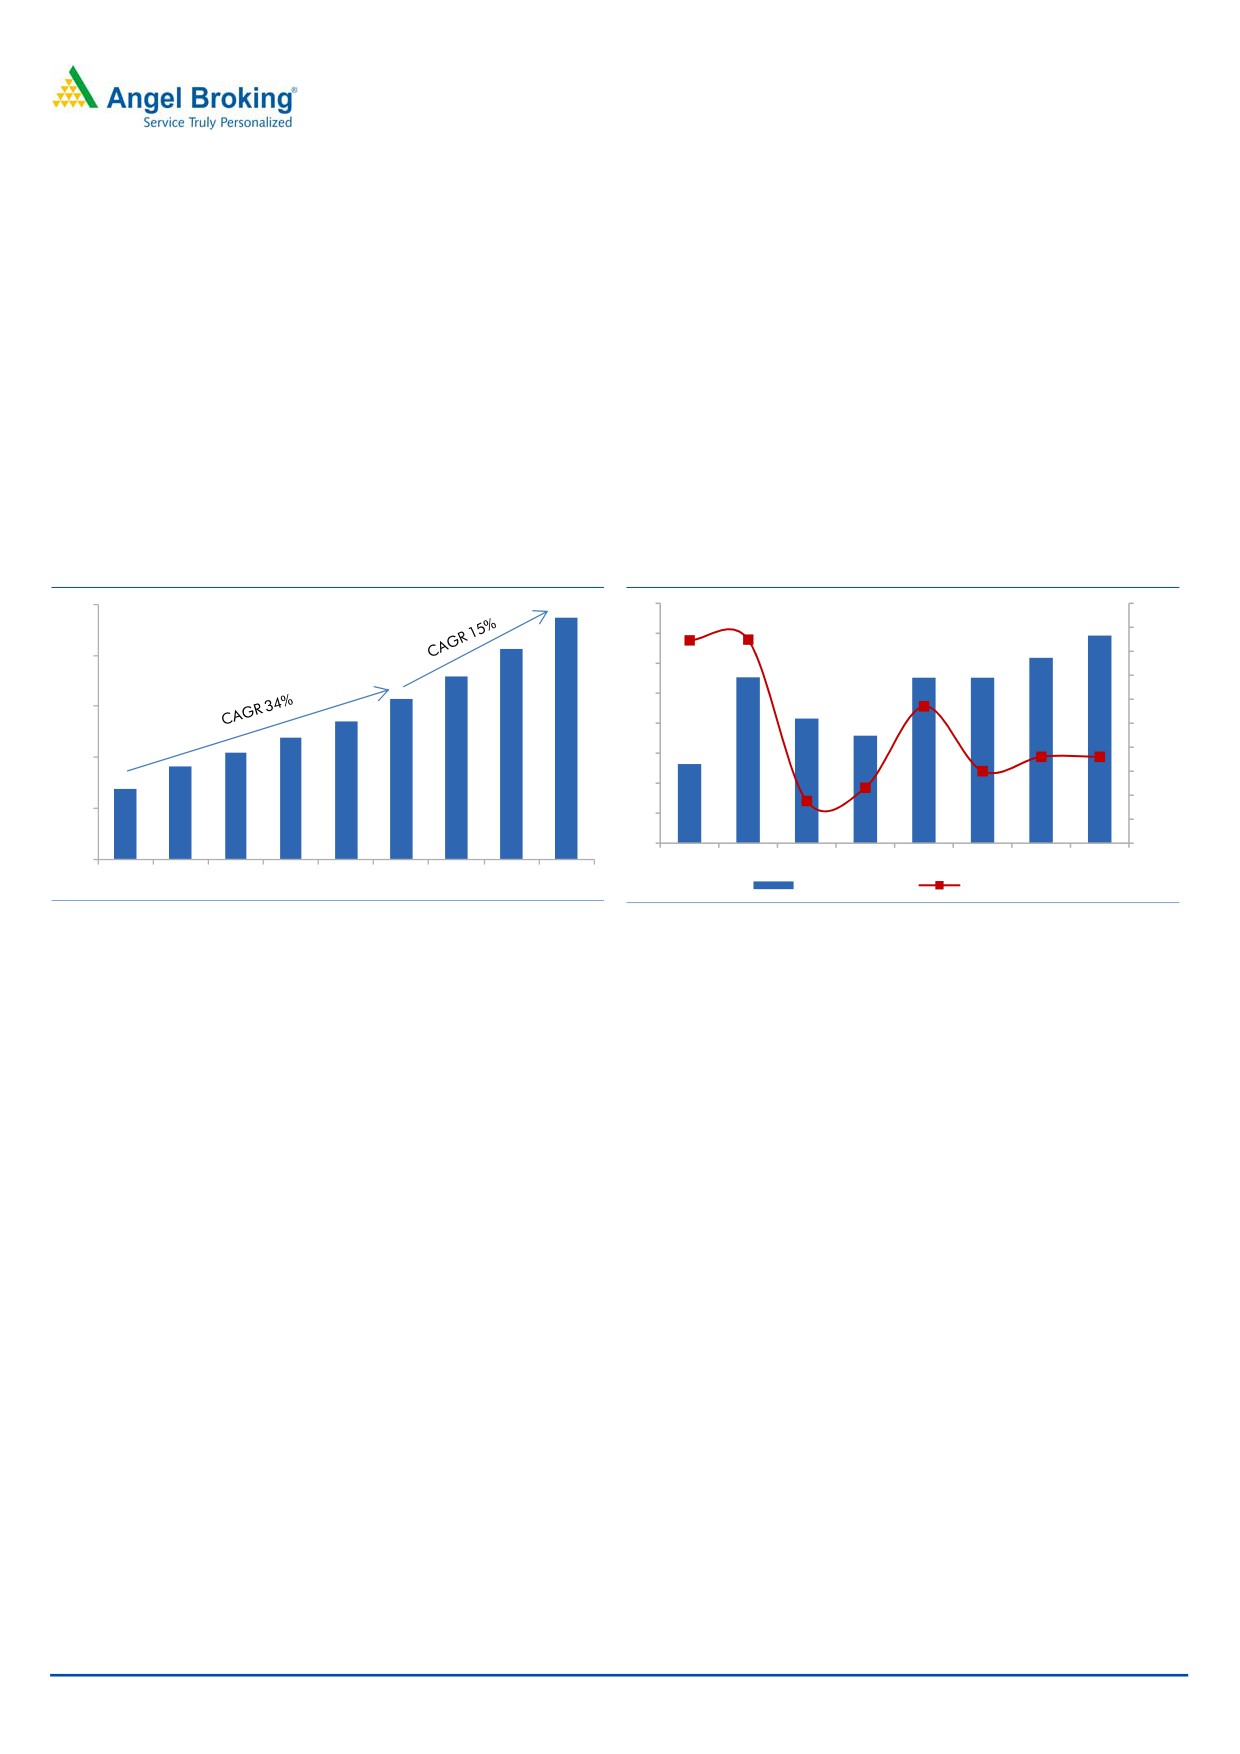
Exhibit 3: Aftermarket growth trend
Exhibit 4: Export growth trend
250
80
140
120
70
200
100
60
80
50
60
150
40
40
20
100
30
0
20
(20)
50
10
(40)
0
(60)
0
FY11
FY12
FY13
FY14
FY15
FY16E FY17E FY18E
FY10
FY11
FY12
FY13
FY14
FY15
FY16E FY17E FY18E
Exports (` cr)
Growth (%)
Source: Company, Angel Research
Source: Company, Angel Research
Passenger vehicle business poised for recovery
Gabriel’s passenger vehicle segment (contributing 27% of the revenues) has been
under pressure with the segment’s revenues having declined by about 10% in
1HFY2016. This is on account of car platforms of Maruti Suzuki (mini segment)
and Tata Motors (older platforms) in which Gabriel is the supplier not performing
well. Underperformance of its key customer - Mahindra & Mahindra (M&M) (M&M
volumes dipped 8% in 1HFY2016 as against passenger vehicle industry growth of
6%), has also led to decline in the company’s passenger vehicle segment revenues.
However, Gabriel has been nominated in new platforms of Maruti (S Cross and an
upcoming LCV) and M&M (K1OO compact SUV), which would enable recovery in
the passenger vehicle business from FY2017, in our view. Also, Gabriel is in
negotiations with Ford, Renault, and General Motors to increase supplies. We
believe Gabriel’s passenger vehicle segment would grow at a CAGR of 8% over
FY2017-18, which would be broadly in line with the passenger vehicle industry
growth.
December 22, 2015
4
Gabriel India | Initiating Coverage
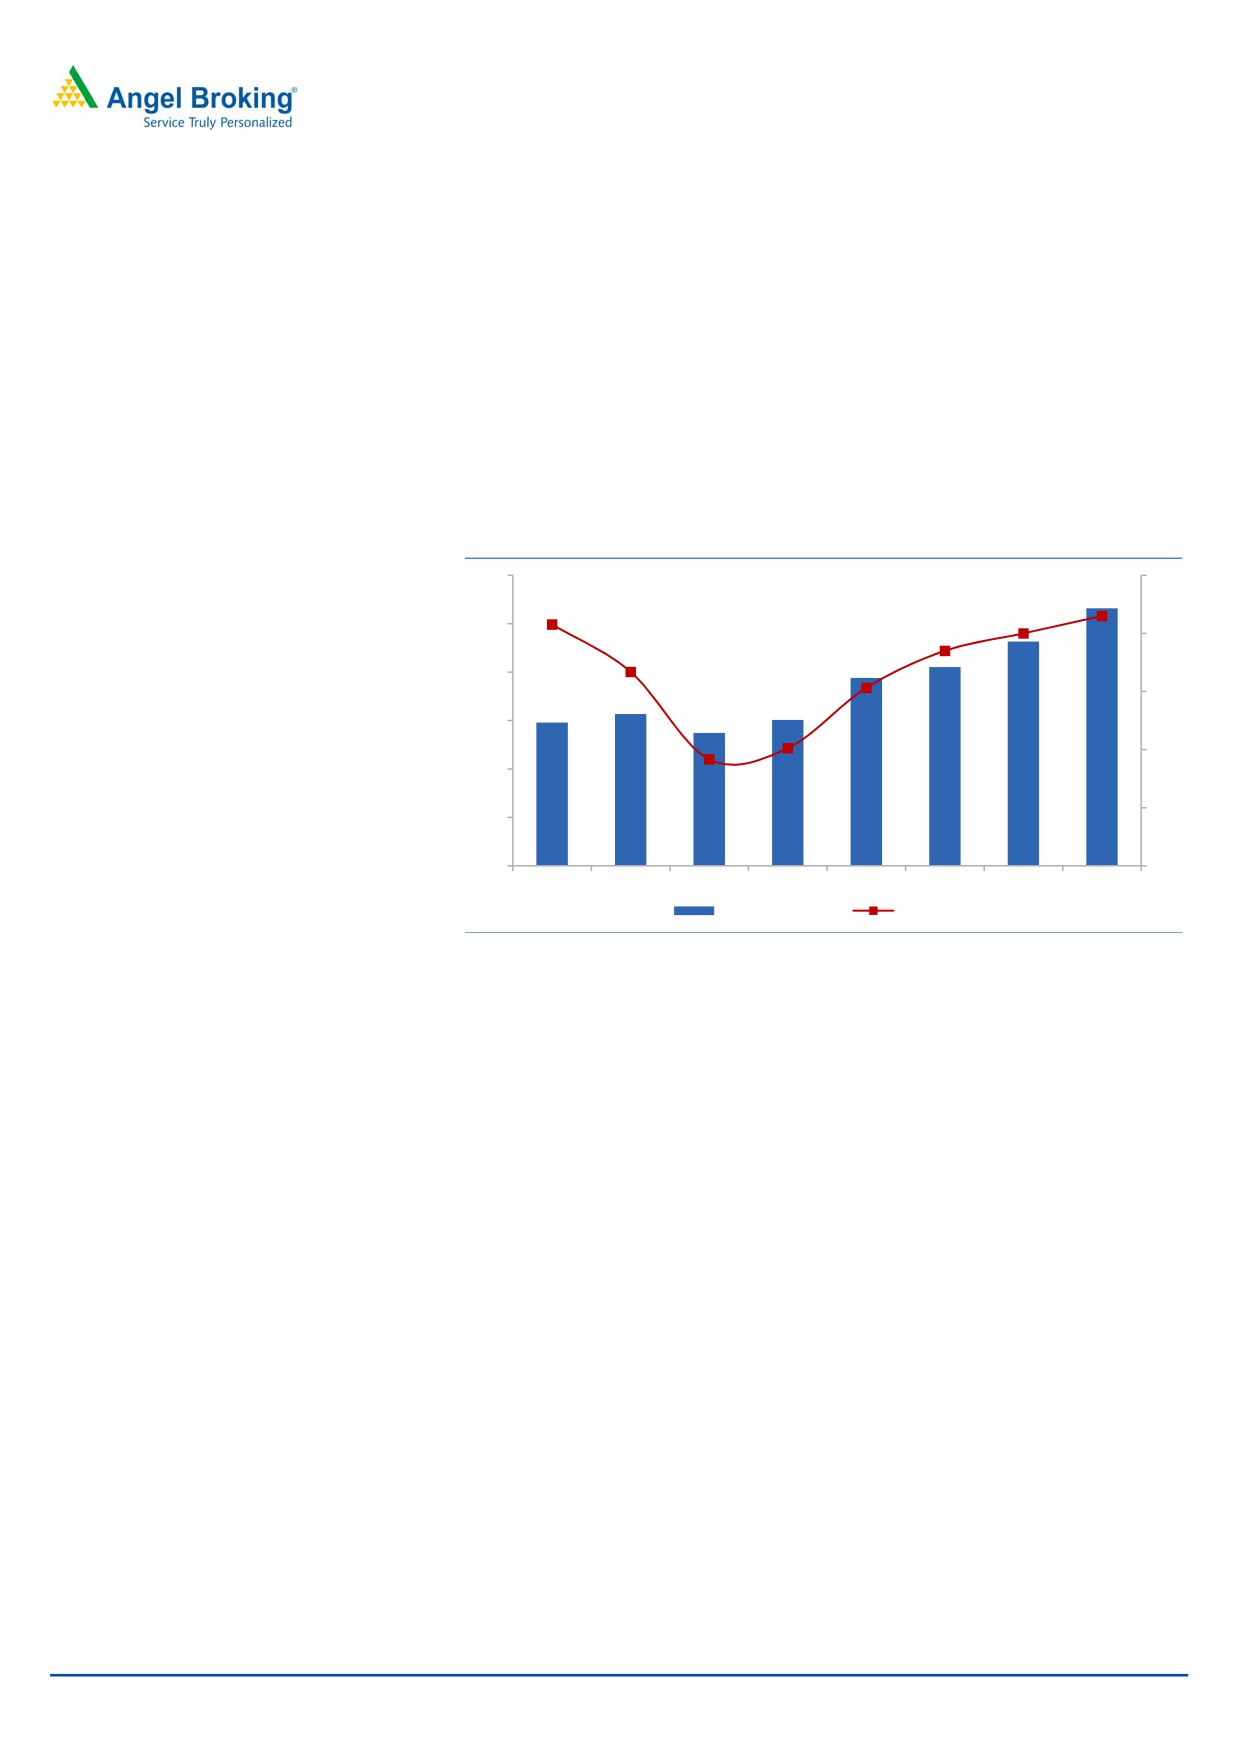
Operating leverage coupled with raw material savings to
improve margins
Gabriel’s top-line is estimated to post a CAGR of ~10% over FY2017-18. The
company is poised to gain benefits of operating leverage on back of healthy
top-line growth. Further, Gabriel has embarked upon a programme on reducing
raw material expenses where it is focusing on value engineering to bring down the
raw material costs. Also, Gabriel is contemplating to procure from new vendors to
draw better raw material prices. Softness in raw material prices is expected to
continue benefitting the company. We estimate Gabriel’s margins to improve by
60bp over the next two years.
Exhibit 5: EBIDTA margin trend
180
10
150
9
120
8
90
7
60
6
30
0
5
FY11
FY12
FY13
FY14
FY15
FY16E
FY17E
FY18E
EBIDTA (` cr)
Margin (%)
Source: Company, Angel Research
December 22, 2015
5
Gabriel India | Initiating Coverage
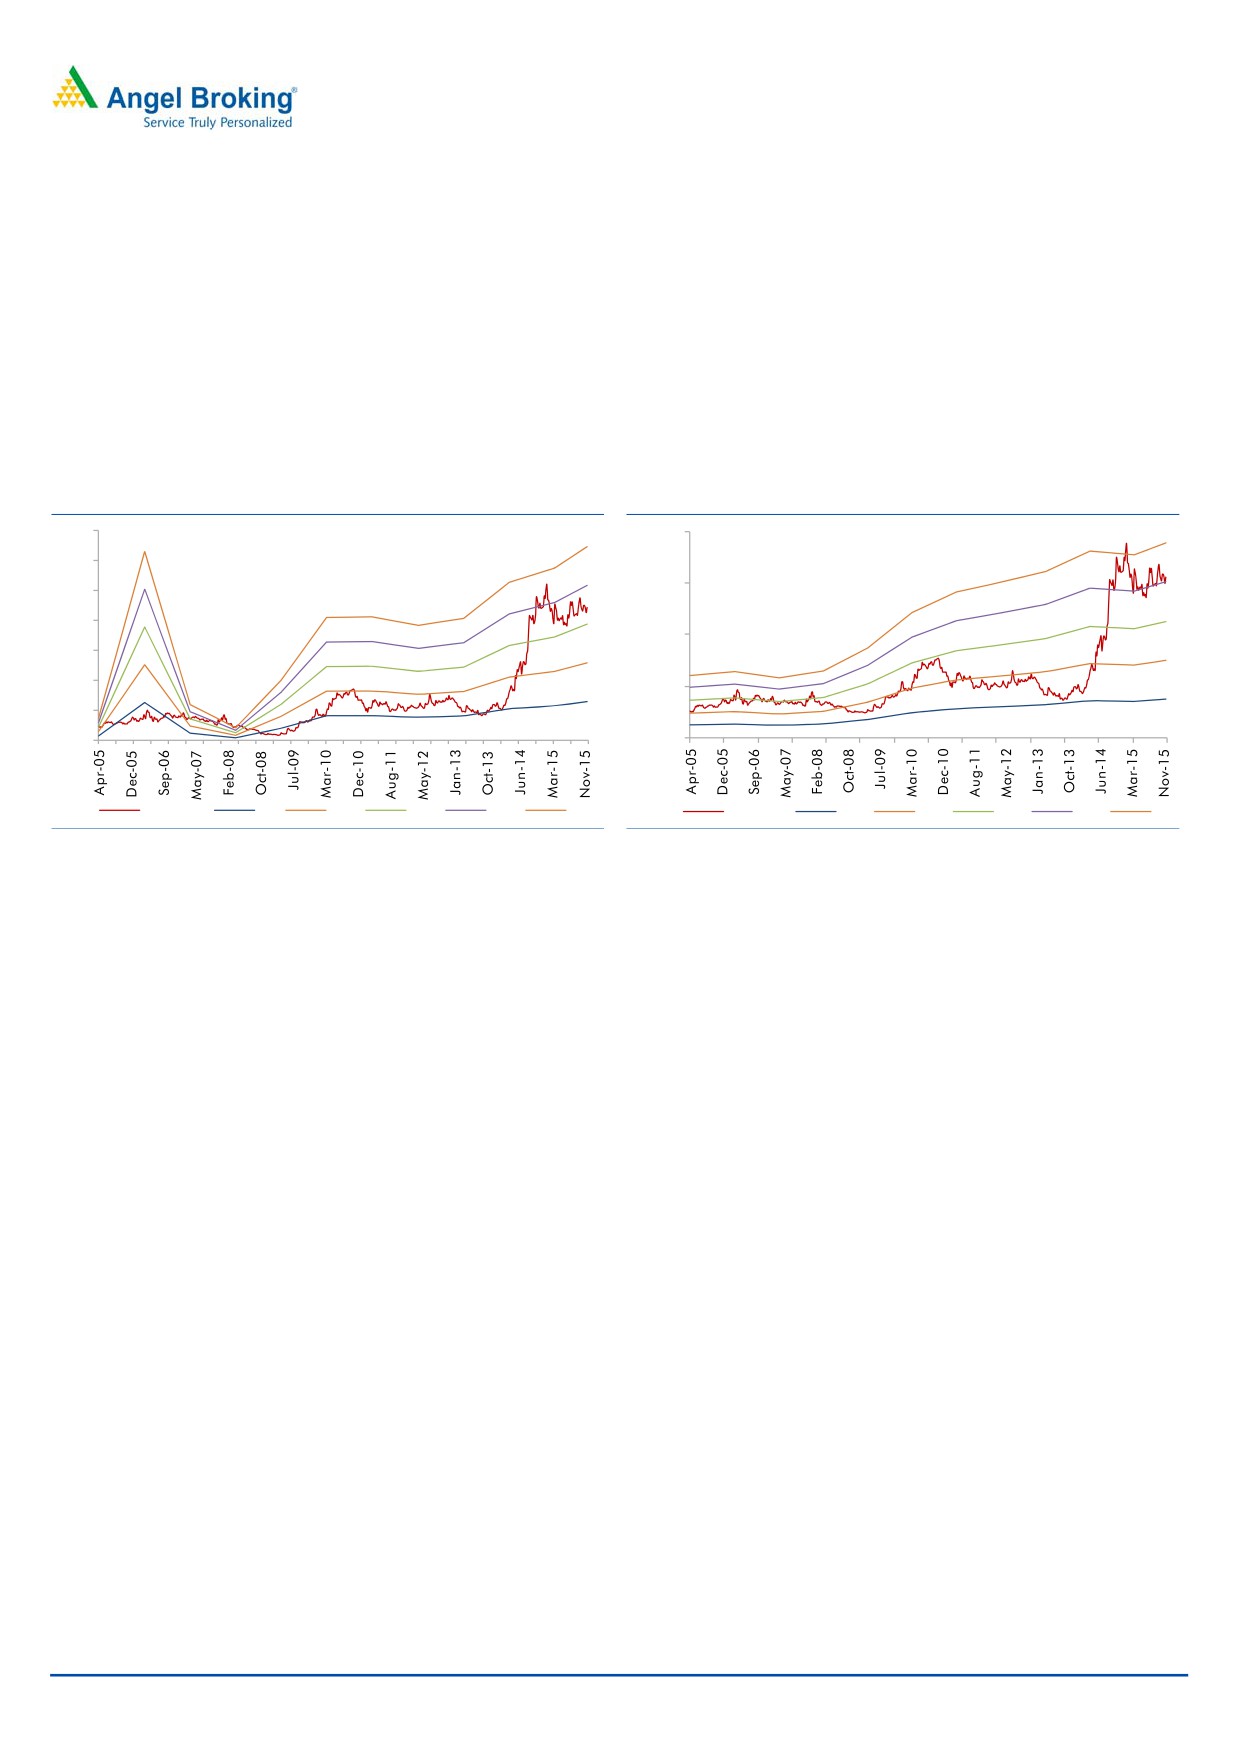
Outlook and Valuation
Two-wheeler recovery coupled with market share gains, healthy growth in
passenger vehicle segment, increased focus on aftermarket and exports are likely
to lead to a 10% CAGR in revenue for Gabriel over FY2016-2018 period. Gabriel’s
margins are also expected to improve by 60bp in the next two years on back of
operating leverage and cost control measures, resulting into 17% earnings CAGR over
the next two years. GIL is a quality ancillary company with bright earnings growth,
healthy return ratios and attractive valuations. We initiate coverage on Gabriel with Buy
rating and target price of `101 (based on 16x FY2018E earnings).
Exhibit 6: One year forward P/E Band
Exhibit 7: One year forward EV/Sales Band
140
1,600
120
1,200
100
80
800
60
40
400
20
0
0
Price (`)
5x
10x
15x
20x
25x
EV (` cr)
0.2x
0.4x
0.6x
0.8x
1x
Source: Angel Research
Source: Angel Research
Company Background
Gabriel India Limited (GIL) is the flagship company of ANAND group and a
leading name in the Indian Auto Component Industry. Established in 1961, GIL
has been the pioneer of ride control products in India. GIL provides the widest
range of ride control products including shock absorbers, struts and front forks,
across every automotive segment with over 300 product models on offer. GIL has
wide manufacturing presence with facilities spread across the country located at
Pune, Nashik, Hosur, Dewas, Gurgaon, Parwanoo. It has technological
collaboration with KYB Corporation of Japan. KYB is the world leader in supplier
of shocks and struts for OEMs and the aftermarket. The company has 32 facilities
in 21 countries including 15 manufacturing plants in Asia, the United States, and
Europe.
December 22, 2015
6
Gabriel India | Initiating Coverage
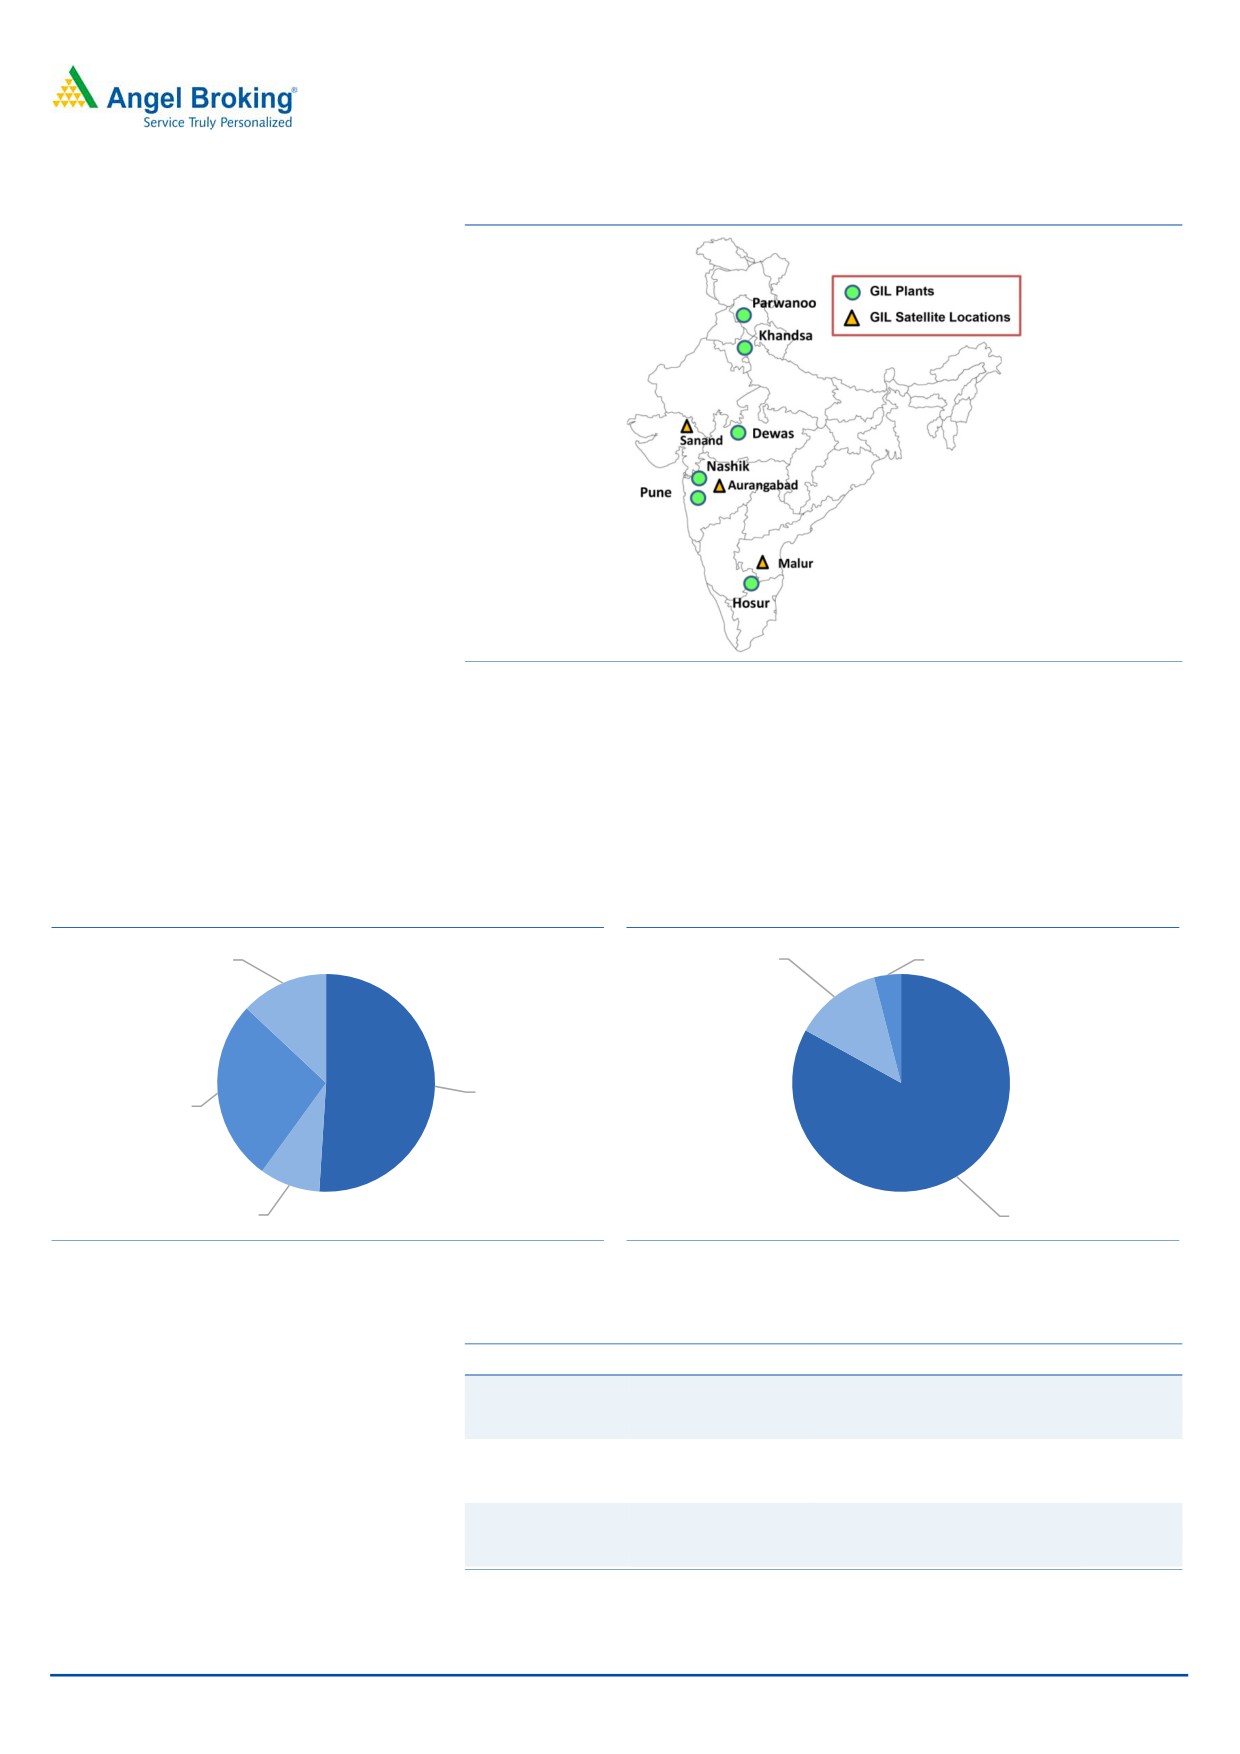
Exhibit 8: Manufacturing footprint
Source: Company, Angel Research
Two-wheelers form the biggest chunk of the company’s revenues, contributing half
of the top-line. Passenger vehicles is the second largest segment constituting 27%
of the revenues. Commercial Vehicles and the three-wheeler segment form 13%
and 9% of revenues, respectively. OEMs form the largest customer base forming
83% of the top-line. Aftermarket and exports constitute 13% and 4%, respectively.
Exhibit 9: Segmentwise breakup
Exhibit 10: Customerwise breakup
CV, 13%
Aftermarket,
Exports, 4%
13%
2W, 51%
Cars, 27%
3W, 9%
OEM, 83%
Source: Company, Angel Research
Source: Company, Angel Research
Exhibit 11: Product and client base
Segment
Products
Customers
Market share
Front forks, gas and
TVS Motors, Honda India,
Two wheelers
hydraulic shock
Yamaha India, Bajaj Auto,
25%
absorber
Royal Enfield
Maruti Suzuki, M&M, Toyota
Mc Pherson struts,
Passenger vehicles
India, Hyundai, Volkswagen
25%
gas shock absorber
India, Ford India
Shock absorber,
Tata Motors, Ashok Leyland,
Commercial vehicles
cabin and seat
VECV, Bharat Benz,
75%
dampers
Force Motors
Source: Company, Angel Research
December 22, 2015
7
Gabriel India | Initiating Coverage
Profit & Loss Statement
Y/E March (` cr)
FY2013
FY2014
FY2015
FY2016E
FY2017E
FY2018E
Total operating income
1,205
1,287
1,444
1,415
1,544
1,715
% chg
6.8
6.7
12.2
(2.0)
9.1
11.1
Total Expenditure
1,123
1,196
1,328
1,292
1,405
1,556
Net Raw Materials
875
928
1,043
1,016
1,106
1,226
Personnel
91
94
108
105
114
127
Other
157
175
177
171
185
202
EBITDA
82
90
116
123
139
160
% chg
(12.5)
9.8
28.8
5.7
12.9
14.8
(% of Net Sales)
6.8
7.0
8.1
8.7
9.0
9.3
Depreciation & Amortisation
27
27
31
33
36
39
EBIT
59
69
90
94
108
126
% chg
(19.6)
16.3
30.0
4.7
14.9
16.6
(% of Net Sales)
4.9
5.4
6.2
6.6
7.0
7.3
Interest & other Charges
12
9
5
2
0
0
Other Income
4
6
4
4
5
5
PBT (recurring)
47
60
84
92
108
126
% chg
(16.9)
27.2
40.3
9.1
17.4
16.6
Extraordinary Expense/(Inc.)
(6)
(4)
(1)
0
0
0
PBT (reported)
41
56
84
92
108
126
Tax
3
13
24
26
30
35
(% of PBT)
7.4
23.6
28.2
28.0
28.0
28.0
PAT (reported)
38
43
60
66
78
90
ADJ. PAT
44
47
61
66
78
90
% chg
(6.9)
6.2
29.5
9.1
17.4
16.6
(% of Net Sales)
3.7
3.6
4.2
4.7
5.0
5.3
Basic EPS (`)
2.7
3.0
4.2
4.6
5.4
6.3
Fully Diluted EPS (`)
3.1
3.3
4.2
4.6
5.4
6.3
% chg
(6.9)
6.2
29.5
9.1
17.4
16.6
December 22, 2015
8
Gabriel India | Initiating Coverage
Balance sheet statement
Y/E March (` cr)
FY2013 FY2014 FY2015 FY2016E FY2017E FY2018E
SOURCES OF FUNDS
Equity Share Capital
14
14
14
14
14
14
Reserves& Surplus
242
271
311
350
396
449
Shareholders Funds
257
285
325
364
410
464
Total Loans
66
56
6
4
0
0
Deferred Tax Liability
11
10
10
10
10
10
Other long term liab.
4
0
0
0
0
0
Long term provisions
6
4
9
12
15
18
Total Liabilities
343
355
351
391
436
492
APPLICATION OF FUNDS
Gross Block
459
492
524
555
594
647
Less: Acc. Dep.
204
225
257
290
325
364
Net Block
255
267
268
265
268
283
Capital WIP
6
12
3
0
0
0
Investments
0
0
0
0
0
0
Long Loans and adv.
31
23
23
23
25
27
Current Assets
Cash
7
5
4
44
76
105
Other
252
278
317
314
343
381
Current liabilities
209
231
265
259
282
312
Net Current Assets
44
47
51
55
61
69
Total Assets
343
355
351
391
436
492
December 22, 2015
9
Gabriel India | Initiating Coverage
Cash flow statement
Y/E March (` cr)
FY2013
FY2014
FY2015
FY2016E FY2017E FY2018E
Profit before tax
41
56
84
92
108
126
Depreciation
25
21
32
33
36
39
Change in Working Capital
35
(4)
(4)
(4)
(6)
(8)
Others
4
(7)
4
1
1
1
Direct taxes paid
(3)
(13)
(24)
(26)
(30)
(35)
Cash Flow from Operations
102
53
92
97
108
123
(Inc.)/ Dec. in Fixed Assets
(69)
(39)
(23)
(28)
(39)
(53)
(Inc.)/ Dec. in Investments
0
0
0
0
0
0
(Inc.)/ Dec. in Loans & Adv
7
7
1
(0)
(2)
(3)
Cash Flow from Investing
(63)
(31)
(22)
(28)
(41)
(56)
Issue of Equity
7
0
0
0
0
0
Inc./(Dec.) in loans
(25)
(9)
(51)
(2)
(4)
0
Dividend Paid (Incl. Tax)
(11)
(12)
(18)
(27)
(32)
(37)
Others
(9)
(2)
(2)
0
0
0
Cash Flow from Financing
(38)
(24)
(70)
(29)
(36)
(37)
Inc./(Dec.) in Cash
1
(2)
(1)
40
32
29
Opening Cash balances
6
7
5
4
44
76
Closing Cash balances
7
5
4
44
76
105
December 22, 2015
10
Gabriel India | Initiating Coverage
Key ratios
Y/E March
FY2013
FY2014
FY2015
FY2016E
FY2017E
FY2018E
Valuation Ratio (x)
P/E (on FDEPS)
28.4
26.7
20.6
18.9
16.1
13.8
P/CEPS
28.4
26.7
20.6
18.9
16.1
13.8
P/BV
4.9
4.4
3.8
3.4
3.0
2.7
Dividend yield (%)
0.9
1.0
1.4
2.2
2.5
3.0
EV/Sales
1.1
1.0
0.9
0.9
0.8
0.7
EV/EBITDA
15.9
14.4
10.7
9.8
8.4
7.2
EV / Total Assets
3.8
3.7
3.6
3.1
2.7
2.3
Per Share Data (`)
EPS (Basic)
3.1
3.3
4.2
4.6
5.4
6.3
EPS (fully diluted)
3.1
3.3
4.2
4.6
5.4
6.3
Cash EPS
5.0
5.1
6.4
6.9
7.9
9.0
DPS
0.7
0.9
1.2
1.9
2.2
2.6
Book Value
17.9
19.9
22.7
25.4
28.6
32.3
Returns (%)
ROCE (Pre-tax)
17.3
19.4
25.5
24.0
24.7
25.5
Angel ROIC (Pre-tax)
17.7
19.7
25.8
27.0
29.9
32.5
ROE
17.2
16.4
18.6
18.1
18.9
19.5
Turnover ratios (x)
Asset Turnover (Gross Block)
2.6
2.6
2.8
2.6
2.6
2.7
Inventory / Sales (days)
33.7
33.1
28.3
29.0
29.0
29.0
Receivables (days)
35.4
38.6
43.6
44.0
44.0
44.0
Payables (days)
63.3
65.5
67.1
66.8
66.6
66.4
WC cycle (ex-cash) (days)
13.2
13.4
13.0
14.2
14.4
14.6
Solvency ratios (x)
Net debt to equity
0.2
0.2
0.0
(0.1)
(0.2)
(0.2)
Net debt to EBITDA
0.7
0.6
0.0
(0.3)
(0.5)
(0.7)
Interest Coverage (EBIT / Int.)
4.9
7.7
16.4
46.9
NA
NA
December 22, 2015
11
Gabriel India | Initiating Coverage
Research Team Tel: 022 - 39357800
DISCLAIMER
Angel Broking Private Limited (hereinafter referred to as “Angel”) is a registered Member of National Stock Exchange of India Limited,
Bombay Stock Exchange Limited and Metropolitan Stock Exchange of India Limited. It is also registered as a Depository Participant with
CDSL and Portfolio Manager with SEBI. It also has registration with AMFI as a Mutual Fund Distributor. Angel Broking Private Limited is
a registered entity with SEBI for Research Analyst in terms of SEBI (Research Analyst) Regulations, 2014 vide registration number
INH000000164. Angel or its associates has not been debarred/ suspended by SEBI or any other regulatory authority for accessing
/dealing in securities Market. Angel or its associates including its relatives/analyst do not hold any financial interest/beneficial
ownership of more than 1% in the company covered by Analyst. Angel or its associates/analyst has not received any compensation /
managed or co-managed public offering of securities of the company covered by Analyst during the past twelve months. Angel/analyst
has not served as an officer, director or employee of company covered by Analyst and has not been engaged in market making activity
of the company covered by Analyst.
This document is solely for the personal information of the recipient, and must not be singularly used as the basis of any investment
decision. Nothing in this document should be construed as investment or financial advice. Each recipient of this document should
make such investigations as they deem necessary to arrive at an independent evaluation of an investment in the securities of the
companies referred to in this document (including the merits and risks involved), and should consult their own advisors to determine
the merits and risks of such an investment.
Reports based on technical and derivative analysis center on studying charts of a stock's price movement, outstanding positions and
trading volume, as opposed to focusing on a company's fundamentals and, as such, may not match with a report on a company's
fundamentals.
The information in this document has been printed on the basis of publicly available information, internal data and other reliable
sources believed to be true, but we do not represent that it is accurate or complete and it should not be relied on as such, as this
document is for general guidance only. Angel Broking Pvt. Limited or any of its affiliates/ group companies shall not be in any way
responsible for any loss or damage that may arise to any person from any inadvertent error in the information contained in this report.
Angel Broking Pvt. Limited has not independently verified all the information contained within this document. Accordingly, we cannot
testify, nor make any representation or warranty, express or implied, to the accuracy, contents or data contained within this document.
While Angel Broking Pvt. Limited endeavors to update on a reasonable basis the information discussed in this material, there may be
regulatory, compliance, or other reasons that prevent us from doing so.
This document is being supplied to you solely for your information, and its contents, information or data may not be reproduced,
redistributed or passed on, directly or indirectly.
Neither Angel Broking Pvt. Limited, nor its directors, employees or affiliates shall be liable for any loss or damage that may arise from
or in connection with the use of this information.
Note: Please refer to the important ‘Stock Holding Disclosure' report on the Angel website (Research Section). Also, please refer to the
latest update on respective stocks for the disclosure status in respect of those stocks. Angel Broking Pvt. Limited and its affiliates may
have investment positions in the stocks recommended in this report.
Disclosure of Interest Statement
Gabriel India
1. Analyst ownership of the stock
No
2. Angel and its Group companies ownership of the stock
No
3. Angel and its Group companies' Directors ownership of the stock
No
4. Broking relationship with company covered
No
Note: We have not considered any Exposure below ` 1 lakh for Angel, its Group companies and Directors
Ratings (Based on expected returns
Buy (> 15%)
Accumulate (5% to 15%)
Neutral (-5 to 5%)
over 12 months investment period):
Reduce (-5% to -15%)
Sell (< -15)
December 22, 2015
12