3QFY2016 Result Update | Banking
January 13, 2016
Federal Bank
NEUTRAL
CMP
`50
Performance Highlights
Target Price
-
Particulars (` cr)
3QFY16 2QFY16
% chg (qoq) 3QFY15
% chg (yoy)
Investment Period
-
NII
605
608
(0.5)
587
3.1
Pre-prov. profit
325
337
(3.3)
397
(18.1)
Stock Info
PAT
163
161
0.9
265
(38.5)
Sector
Banking
Source: Company, Angel Research
Market Cap (` cr)
8,587
Federal Bank reported a weak set of numbers for 3QFY2016. Its NII grew 3.1%
Beta
1.1
yoy while profit declined on a yoy basis on account of decrease in non-interest
52 Week High / Low
79.7/47.4
income as well as higher provisions.
Avg. Daily Volume
46,42,224
Slippages at peak; NIM falls qoq
Face Value (`)
2
BSE Sensex
24,854
During 3QFY2016, the bank witnessed a loan growth of 9.8% yoy, while
deposits grew by 14.1% yoy. Growth in advances was led by the Corporate and
Nifty
7,562
SME books, which grew by 19.4% and 17.1% yoy, respectively, while the growth
Reuters Code
FED.BO
in the retail loan book was lower at 6.9% yoy. CASA deposits, with a growth of
Bloomberg Code
FB:IN
20.1% yoy, outpaced deposit growth, led by growth in both the current and
savings deposits. As a result, the CASA ratio improved by 161bp yoy to 32.1%.
Shareholding Pattern (%)
The Reported NIM fell by 7bp qoq to 3.04%, due to interest reversal on account
Promoters
0.0
of higher slippages and base rate cut by the bank. Other income (excluding
MF / Banks / Indian Fls
30.6
treasury) growth was moderate as the quarter saw some softness in forex income,
FII / NRIs / OCBs
37.5
while core fee income remained stable. Treasury gains during the quarter came
Indian Public / Others
32.0
in much lower at `23cr as against `77cr in 3QFY2015.
On the asset quality front, the annualized slippage ratio was higher at 4.5% as
Abs. (%)
3m
1yr
3yr
compared to 3.2% in 2QFY2016 and 2.2% in 3QFY2015. During the quarter,
Sensex
(7.2)
(9.1)
24.9
the bank registered the highest ever slippages of `571cr. 3 of the bank’s
FB
(22.2)
(32.5)
(3.8)
accounts amounting to `225cr were sold to ARCs (1 account in the shipping
industry [`109cr] and 2 accounts falling in the metals segment). There is no
pending stress on these lines as far as the list from the RBI is concerned.
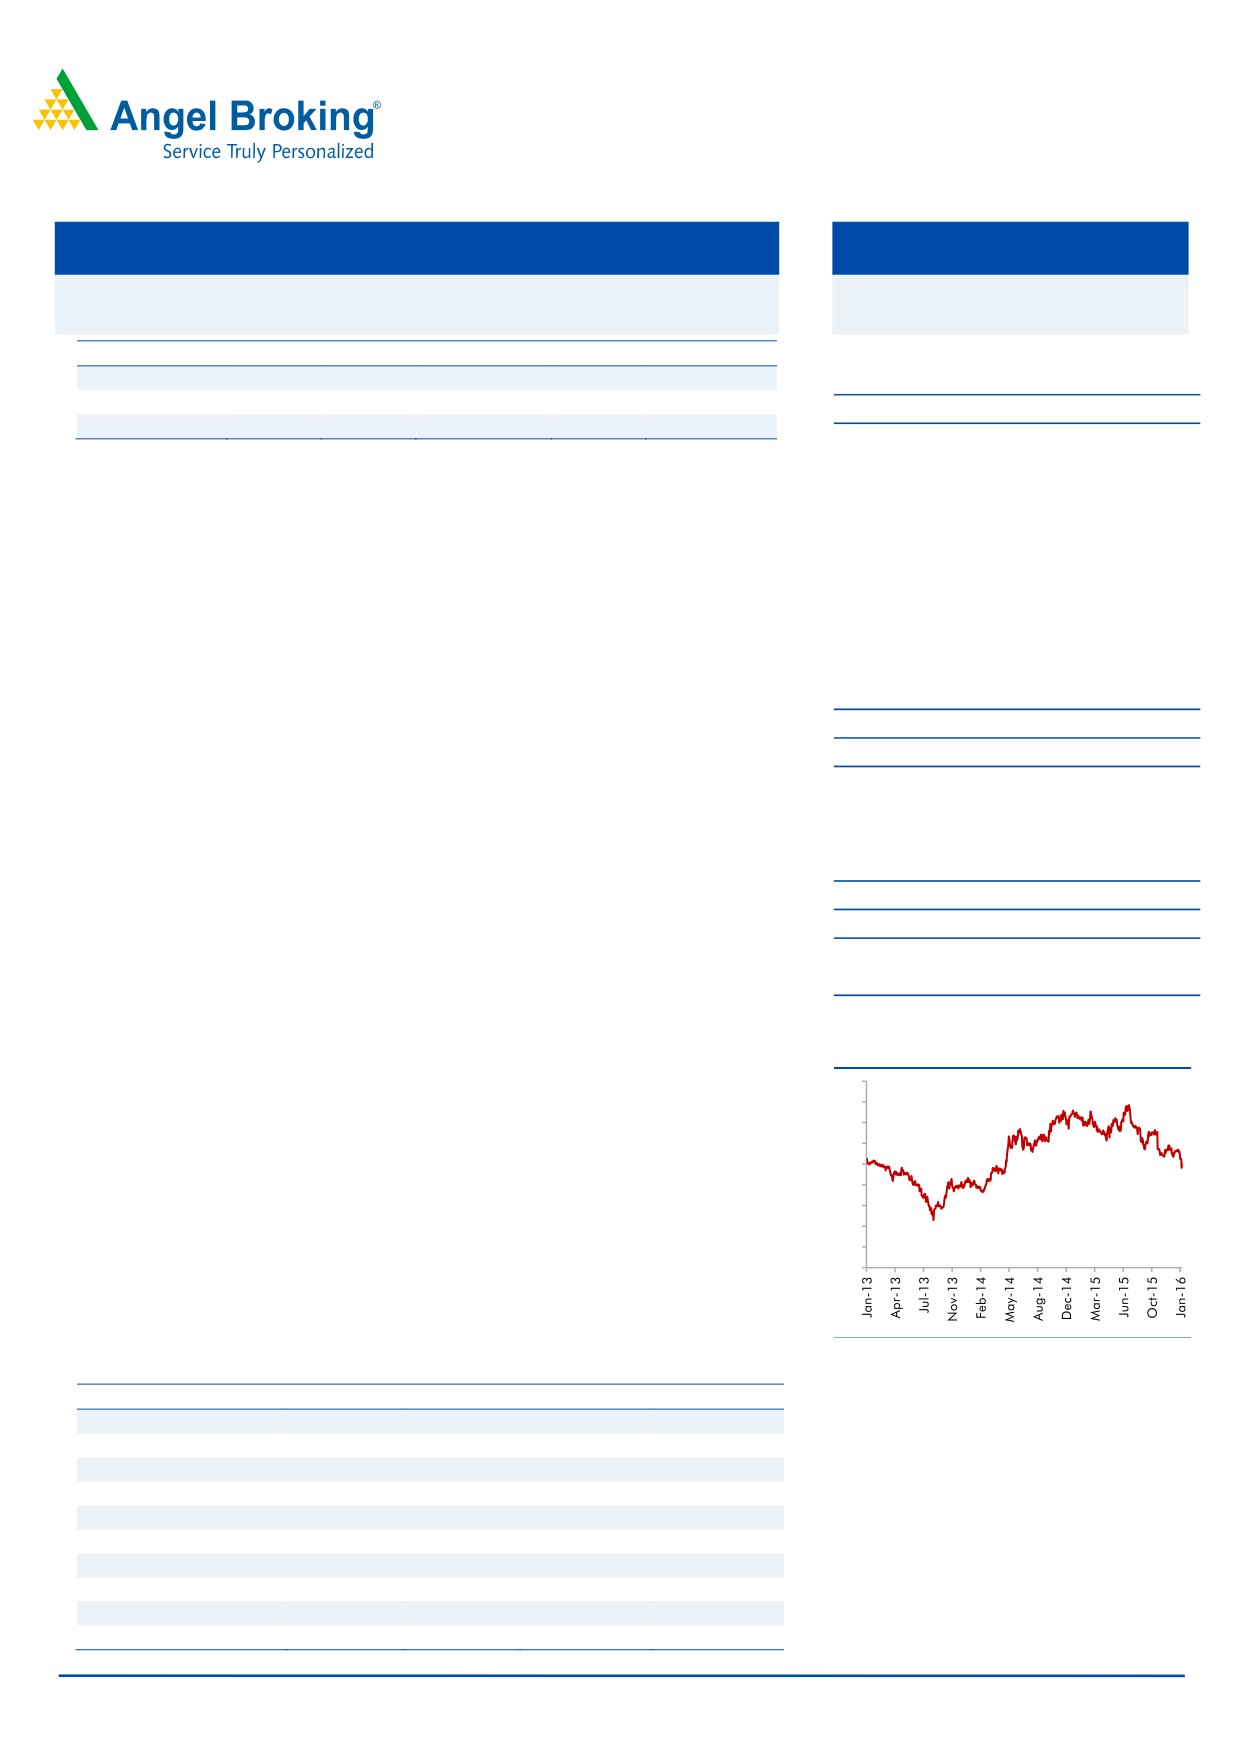
3-year price chart
Recoveries and upgrades were higher at `108cr during the quarter, partially
90
offsetting the impact of higher slippages in terms of absolute Gross NPAs which
80
rose by 12.3% qoq to `1,684cr. Higher slippages led to an increase in the Gross
70
NPA ratio by 25bp qoq to 3.15%, whereas the Net NPA ratio increased by 33bps
60
50
qoq to 1.66%. The provision coverage ratio fell by 1,331bp yoy and 493bp qoq
40
to 71.7% as of 3QFY2016.
30
20
Outlook and valuation: Earnings were affected due to decline in non-interest
10
income, higher cost-income ratio and poor asset quality. Given the increasing
0
uncertainty in the corporate books in the industry as a whole, we remain watchful of the
bank’s near-term performance on the asset quality front. At the current market price,
the stock trades at 0.9x FY2017E ABV. We maintain our Neutral rating on the stock.
Source: Company, Angel Research
Key financials
Y/E March (` cr)
FY2014
FY2015
FY2016E
FY2017E
NII
2,229
2,380
2,457
2,861
% chg
12.9
6.8
3.2
16.4
Net profit
839
1,006
675
948
% chg
0.1
19.9
(32.9)
40.4
Vaibhav Agrawal
NIM (%)
3.2
3.1
2.8
2.9
022 - 3935 7800 Ext: 6808
EPS (`)
4.9
5.9
3.9
5.5
P/E (x)
10.2
8.5
12.7
9.0
P/ABV (x)
0.6
0.6
1.0
0.9
Chintan Shah
RoA (%)
1.2
1.3
0.8
0.9
022 - 4000 3600 Ext: 6828
RoE (%)
12.6
13.7
8.4
10.8
Source: Company, Angel Research; Note: CMP as of January 13, 2016
Please refer to important disclosures at the end of this report
1
Federal Bank | 3QFY2016 Result Update
Exhibit 1: 3QFY2016 performance
Particulars (` cr)
3QFY16
2QFY16
% chg (qoq)
3QFY15
% chg (yoy)
FY2015
FY2014
% chg
Interest earned
1,903
1,902
0.0
1,870
1.7
7,419
6,946
6.8
- on Advances / Bills
1,386
1,400
(1.0)
1,399
(1.0)
5,447
5,011
8.7
- on investments
446
424
5.3
449
(0.7)
1,836
1,777
3.3
- on balance with RBI & others
17
19
(13.0)
21
(19.6)
62
52
19.1
- on others
55
60
(8.1)
1
3,650.7
74
106
(29.7)
Interest Expended
1,298
1,294
0.3
1,283
1.1
5,039
4,717
6.8
Net Interest Income
605
608
(0.5)
587
3.1
2,380
2,229
6.8
Other income
183
182
0.6
220
(16.6)
878
694
26.6
- Other income excl. treasury
160
156
2.6
142
12.5
623
540
15.3
- Treasury Income
23
26
(11.5)
77
(70.3)
256
154
66.1
Operating income
789
791
(0.3)
807
(2.3)
3,259
2,922
11.5
Operating expenses
463
454
2.0
410
13.0
1,631
1,392
17.2
- Employee expenses
259
249
3.9
235
10.0
892
722
23.6
- Other Opex
204
205
(0.3)
175
17.1
739
671
10.2
Pre-provision Profit
325
337
(3.3)
397
(18.1)
1,628
1,530
6.4
Provisions & Contingencies
75
87
(13.9)
(1)
(9,259.8)
107
318
(66.5)
- Provisions for NPAs
-
127
(100.0)
56
(100.0)
204
228
(10.8)
- Provisions for Investments
-
(26)
(100.0)
(59)
(100.0)
(80)
112
(171.4)
- Other Provisions
75
(14)
(647.4)
2
3,345.4
(41)
(35)
16.1
PBT
250
249
0.4
398
(37.1)
1,521
1,212
25.5
Provision for Tax
88
88
(0.4)
133
(34.3)
515
373
38.1
PAT
163
161
0.9
265
(38.5)
1,006
839
19.9
Effective Tax Rate (%)
35.0
35.3
(30)bp
33.5
148bp
33.9
30.8
309bp
Source: Company, Angel Research
January 13, 2016
2
Federal Bank | 3QFY2016 Result Update
Exhibit 2: 3QFY2016 performance
Particulars
3QFY16
2QFY16
% chg (qoq) 3QFY15
% chg (yoy)
Balance sheet
Advances (`cr)
52,753
50,867
3.7
48,026
9.8
Deposits (` cr)
74,792
73,783
1.4
65,550
14.1
Credit-to-Deposit Ratio (%)
70.5
68.9
159bp
73.3
(273)bp
Current deposits (` cr)
3,877
4,178
(7.2)
3,194
21.4
Saving deposits (` cr)
20,128
19,335
4.1
16,791
19.9
CASA deposits (` cr)
24,005
23,513
2.1
19,985
20.1
CASA ratio (%)
32.1
31.9
23bp
30.49
161bp
CAR (%)
14.3
14.7
(39)bp
14.5
(19)bp
Profitability Ratios (%)
Reported NIM
3.0
3.1
(7)bp
3.2
(16)bp
Cost-to-income ratio
58.7
57.4
129bp
50.8
796bp
Asset quality
Gross NPAs (` cr)
1,684
1,499
12.3
1,067
57.9
Gross NPAs (%)
3.15
2.9
25bp
2.2
96bp
Net NPAs (` cr)
876
675
29.8
333
163.1
Net NPAs (%)
1.7
1.3
33bp
0.7
97bp
Provision Coverage Ratio (%)
71.7
76.6
(493)bp
85.0
(1331)bp
Slippage ratio (%)
4.5
3.2
129bp
2.2
230bp
Source: Company, Angel Research, Note: *Basel III
Balance sheet growth moderate; NIM falls
During 3QFY2016, the bank witnessed a loan growth of 9.8% yoy, while deposits
grew by 14.1% yoy. Growth in advances was led by the Corporate and SME
books, which grew by 19.4% and 17.1% yoy, respectively, while the growth in the
retail loan book was lower at 6.9% yoy.
Deposits profile continues to be better with CASA inching higher to 32% of
deposits, while credit growth has been mainly from credit substitutes in the
corporate book. 82% of the incremental corporate advances were to the highly
rated corporates with a rating of A and above.
CASA deposits, with a growth of 20.1% yoy, outpaced deposit growth, led by
growth in both the current and savings deposits. As a result, the CASA ratio
improved by 161bp yoy to 32.1%.
January 13, 2016
3
Federal Bank | 3QFY2016 Result Update
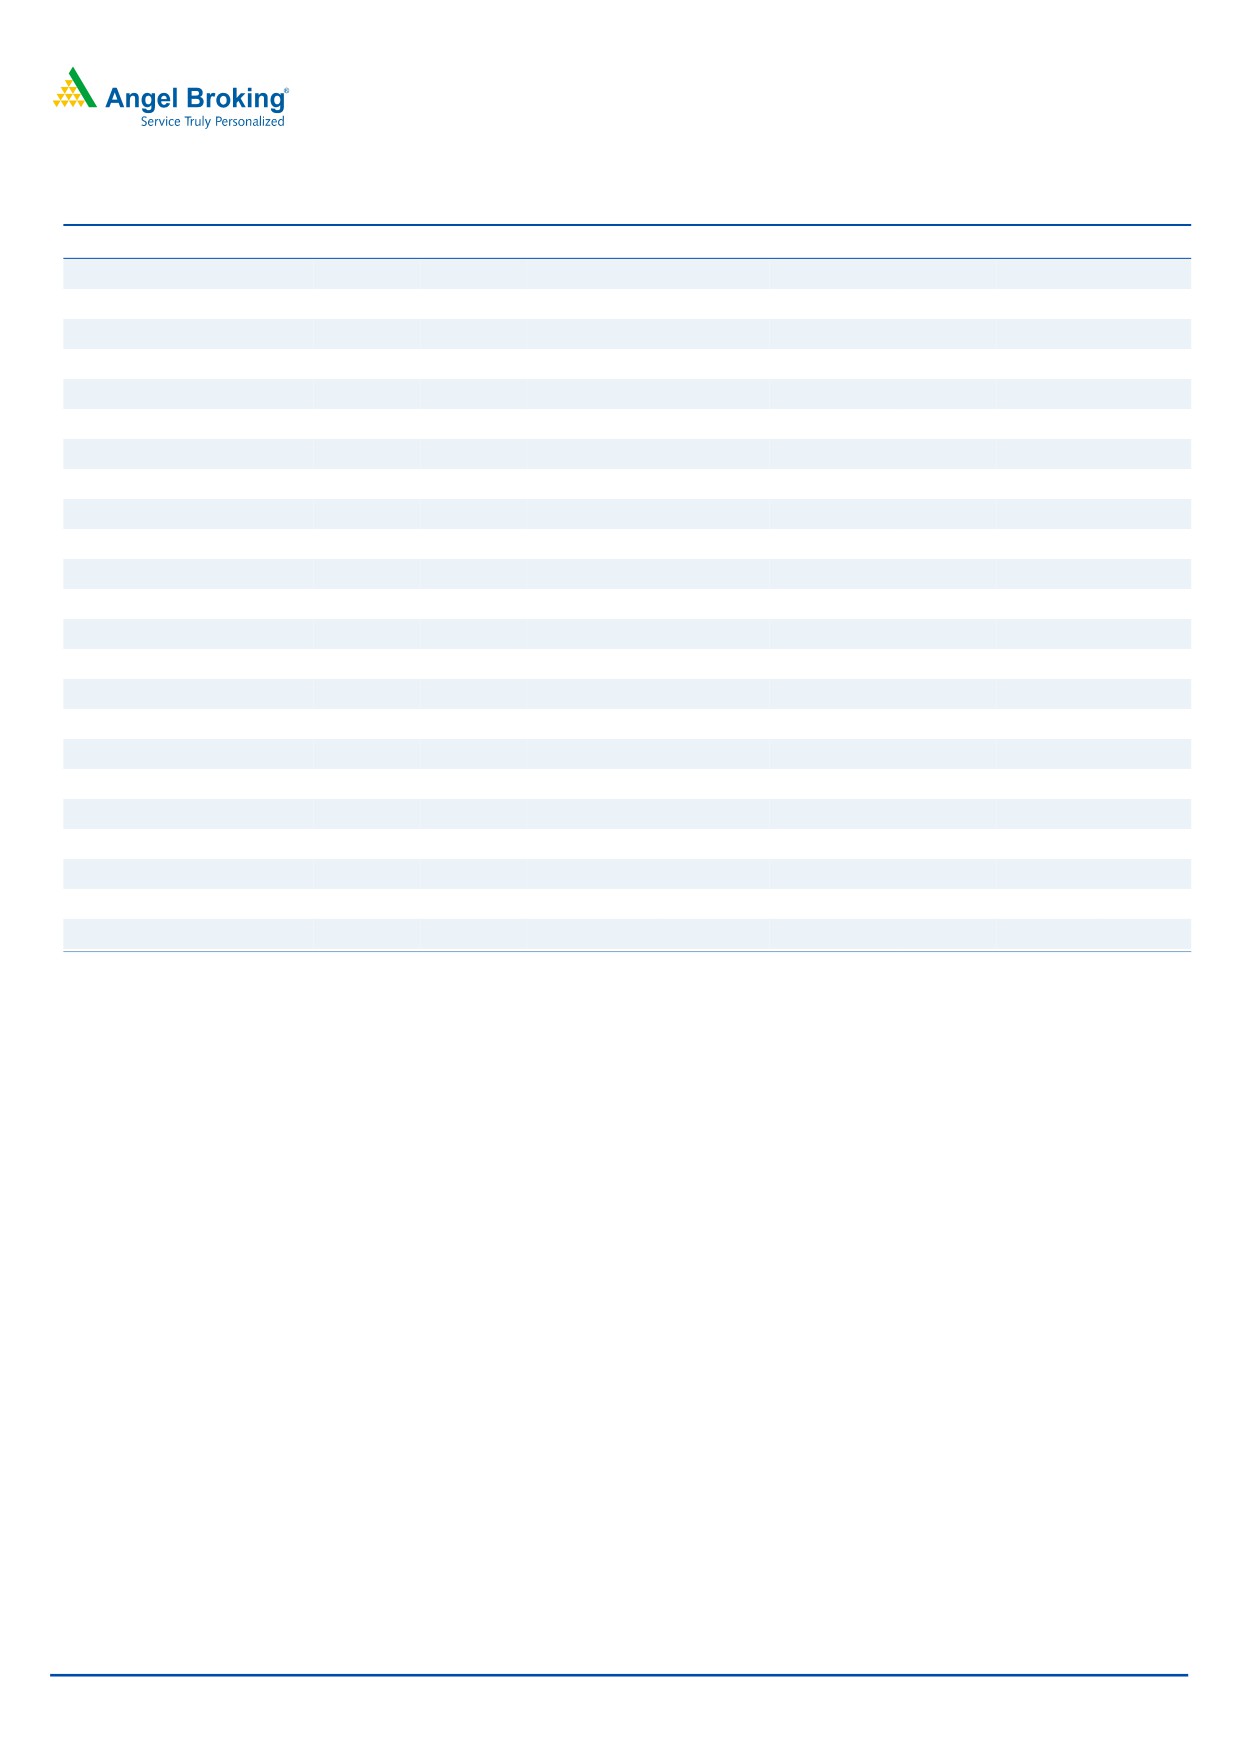
Exhibit 3: Business growth moderate in 3QFY2016
Exhibit 4: CASA ratio improves
Adv. yoy chg (% )
Dep. yoy chg (%)
CDR (%, RHS)
(%)
20.0
78.0
34.0
31.9
32.1
76.0
31.3
32.0
30.5
30.4
15.0
73.3
70.5
72.4
74.0
30.0
72.0
28.0
10.0
68.7
68.9
70.0
26.0
68.0
24.0
5.0
66.0
22.0
-
64.0
20.0
3QFY15
4QFY15
1QFY16
2QFY16
3QFY16
3QFY15
4QFY15
1QFY16
2QFY16
3QFY16
Source: Company, Angel Research
Source: Company, Angel Research
The Reported NIM fell by 7bp qoq to 3.04%, due to interest reversal on account of
higher slippages and base rate cut by the bank.
Cost of deposits fell to 6.90% as against 6.98% in 2QFY2016 and is expected to
trend lower going ahead. The Management expects NIM to be in the range of
3.10-3.15% in FY2017.
Exhibit 5: NIM fell by 7bp qoq; 16bp yoy
(%)
3.4
3.31
3.2
3.2
3.12
3.11
3.04
3
2.8
3QFY15
4QFY15
1QFY16
2QFY16
3QFY16
Source: Company, Angel Research
Moderate performance in Non-interest income (excluding
treasury)
During the quarter, other income (excluding treasury) growth was moderate as the
quarter saw some softness in forex income, while core fee income remained
stable. Treasury gains during the quarter came in much lower at `23cr as against
`77cr in 3QFY2015. The overall other income for the bank de-grew by 16.6% yoy.
January 13, 2016
4
Federal Bank | 3QFY2016 Result Update
Asset quality woes worsen, Slippages at the peak
On the asset quality front, the annualized slippage ratio was higher at 4.5% as
compared to 3.2% in 2QFY2016 and 2.2% in 3QFY2015. During the quarter, the
bank registered the highest ever slippages of `571cr. 3 of the bank’s accounts
amounting to `225cr were sold to ARCs (1 account in the shipping industry
[`109cr] and 2 accounts falling in the metals segment). There is no pending stress
on these lines as far as the list from the RBI is concerned. Recoveries and upgrades
were higher at `108cr during the quarter, partially offsetting the impact of higher
slippages in terms of absolute Gross NPAs which rose by 12.3% qoq to `1,684cr.
Higher slippages led to an increase in the Gross NPA ratio by 25bp qoq to 3.15%,
whereas the Net NPA ratio increased by 33bps qoq to 1.66%. The provision
coverage ratio fell by 1,331bp yoy and 493bp qoq to 71.7% as of 3QFY2016.
The bank has not undertaken any refinancing in 5/25 scheme nor participated in
SDR during this quarter.
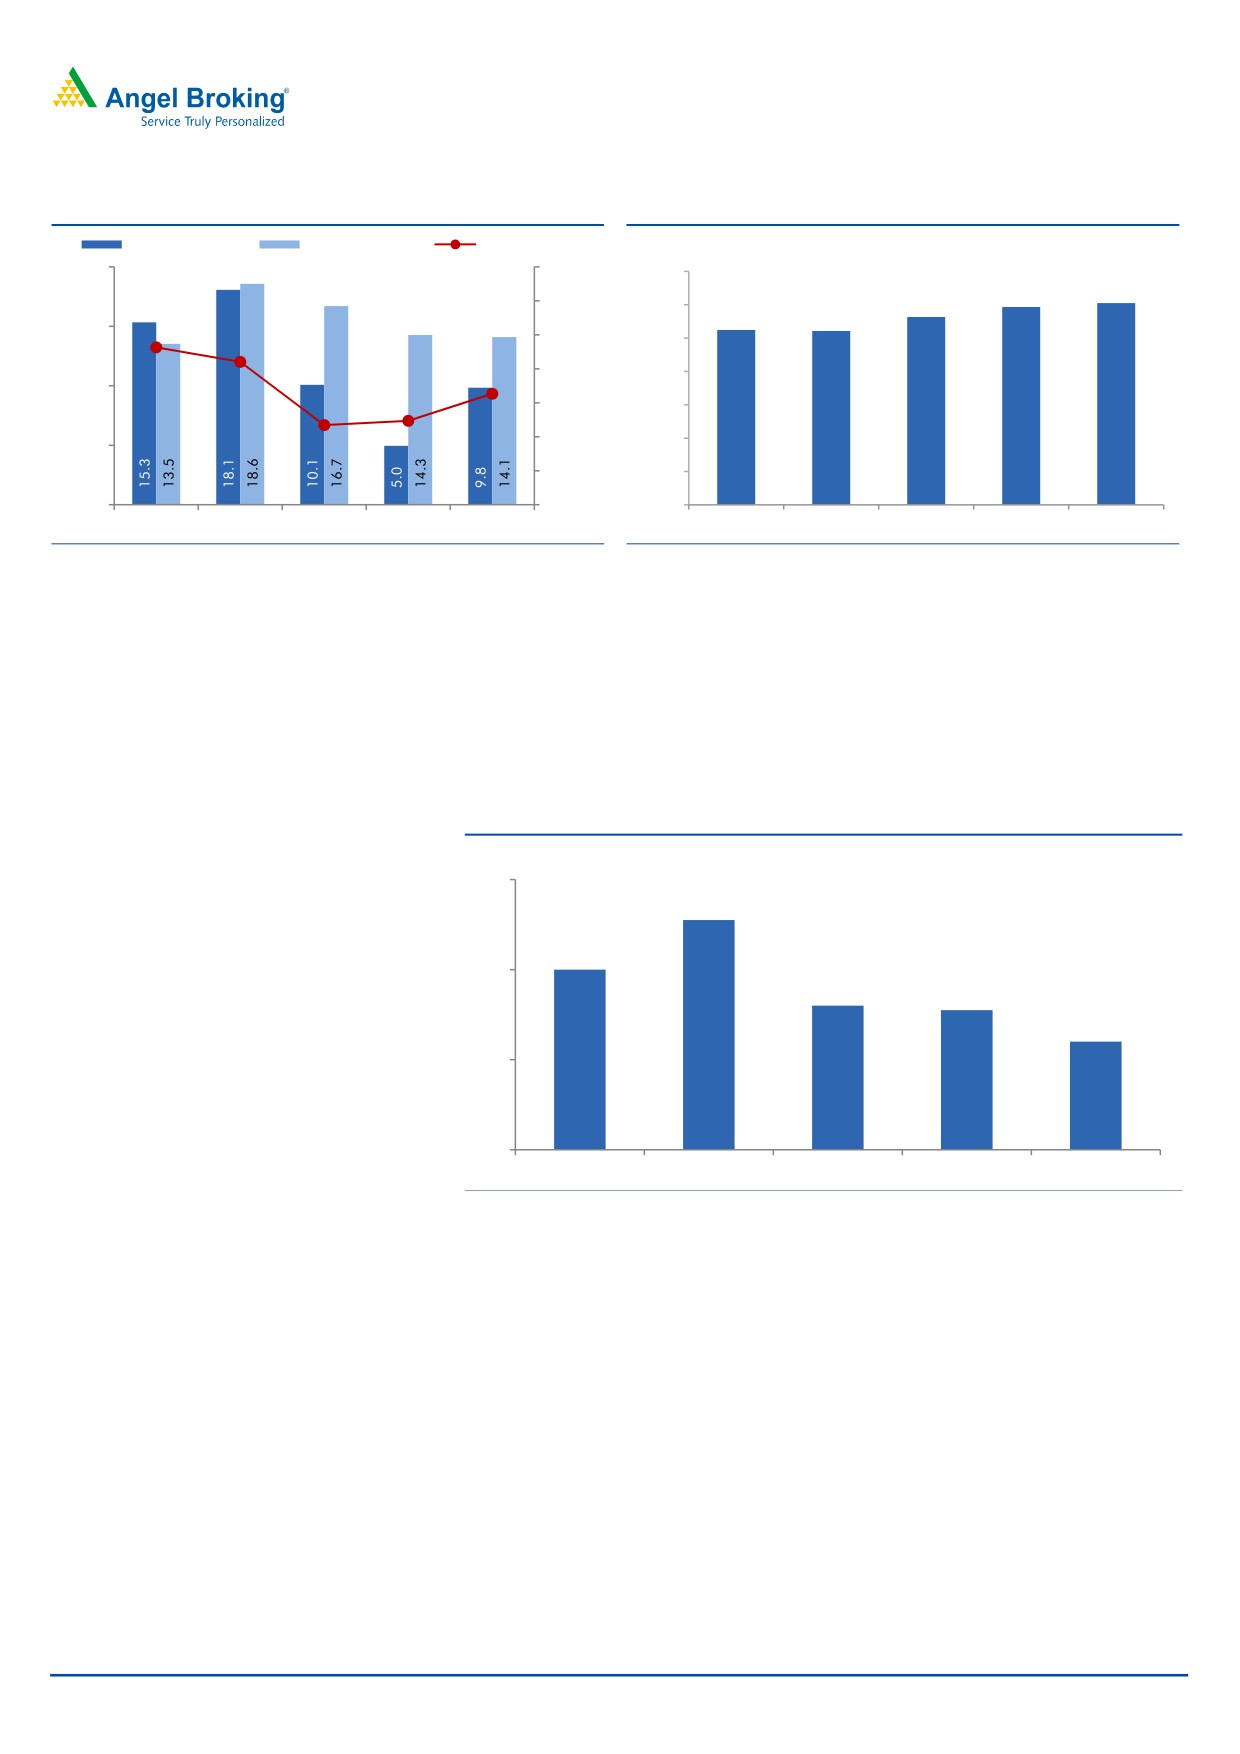
Exhibit 6: Trends in Gross and Net NPA levels
Exhibit 7: Slippages at 4.5% during 3QFY2016
Gross NPAs (` cr)
Net NPAs (` cr)
PCR (%, RHS)
(%)
5.00
1,800
95.0
4.45
4.50
90.0
1,500
85.0
4.00
83.9
85.0
3.50
3.16
1,200
80.5
3.00
76.6
80.0
2.47
2.50
2.15
900
71.7
75.0
2.00
1.66
600
1.50
70.0
1.00
300
65.0
0.50
-
60.0
0.00
3QFY15
4QFY15
1QFY16
2QFY16
3QFY16
3QFY15
4QFY15
1QFY16
2QFY16
3QFY16
Source: Company, Angel Research
Source: Company, Angel Research
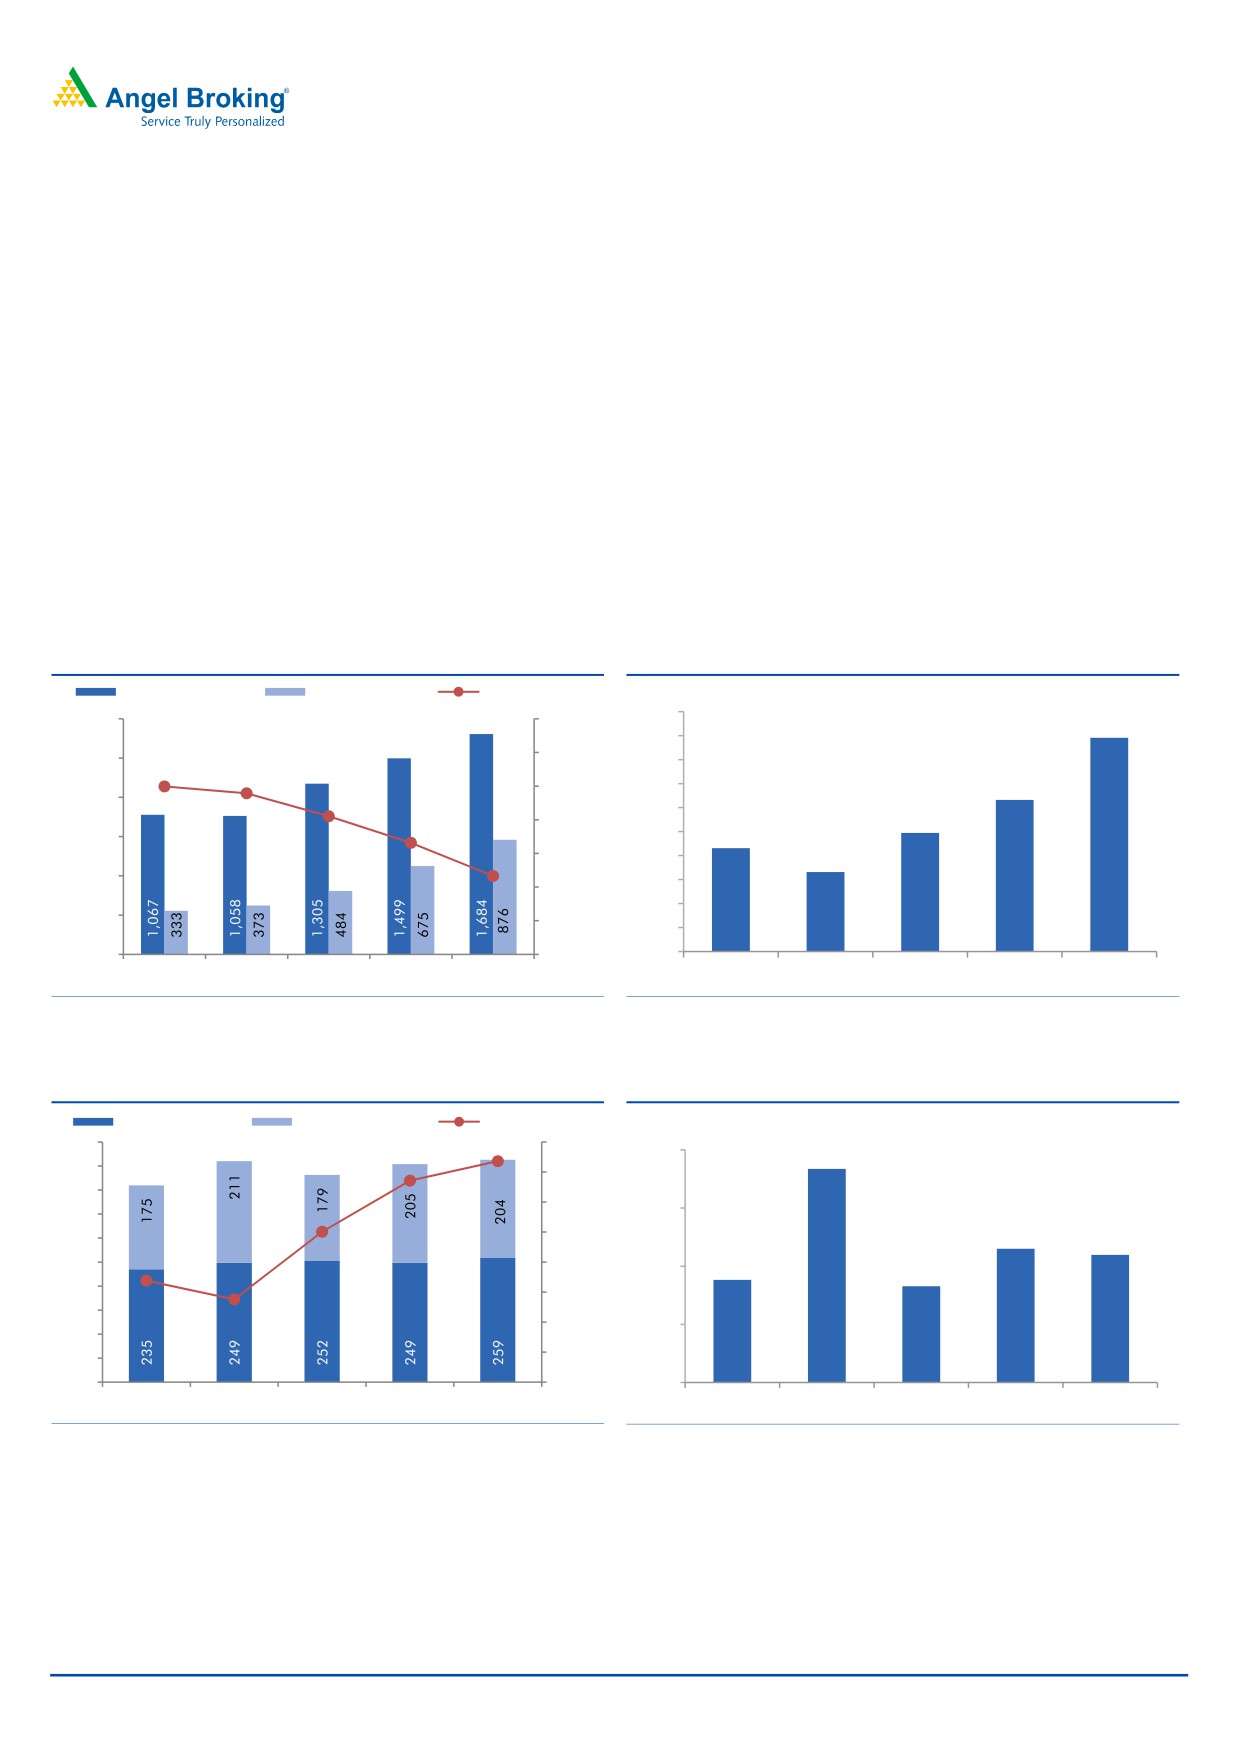
Exhibit 8: Opex trends
Exhibit 9: Opex-to-avg. assets trend
Staff exps (` cr)
Other opex (` cr)
CIR (%, RHS)
(%)
500
58.7
60.0
2.30
2.27
57.4
450
58.0
400
56.0
350
2.20
54.0
2.13
300
2.12
54.0
250
52.0
2.08
50.8
2.10
2.07
200
50.0
150
49.5
48.0
2.00
100
46.0
50
-
44.0
1.90
3QFY15
4QFY15
1QFY16
2QFY16
3QFY16
3QFY15
4QFY15
1QFY16
2QFY16
3QFY16
Source: Company, Angel Research
Source: Company, Angel Research
January 13, 2016
5
Federal Bank | 3QFY2016 Result Update
Outlook and valuation
Earnings were affected due to decline in non-interest income, higher cost-income
ratio and poor asset quality. Given the increasing uncertainty in the corporate
books in the industry as a whole, we remain watchful of the bank’s near-term
performance on the asset quality front. At the current market price, the stock trades at
0.9x FY2017E ABV. We maintain our Neutral rating on the stock.
Exhibit 10: Recommendation summary
CMP
Tgt. Price
Upside
FY2017E
FY2017E
FY2017E
FY15-17E
FY2017E
FY2017E
Company
Reco.
(`)
(`)
(%)
P/ABV (x)
Tgt. P/ABV (x)
P/E (x)
EPS CAGR (%)
RoA (%)
RoE (%)
HDFCBk
Buy
1,059
1,262
19.2
3.2
3.8
17.4
22.4
1.9
19.7
ICICIBk*
Buy
239
304
27.3
1.6
1.7
9.8
13.5
1.6
14.7
YesBk
Buy
683
825
20.8
1.8
2.2
9.8
20.5
1.6
19.6
AxisBk
Buy
406
531
30.6
1.6
2.2
9.3
18.4
1.8
18.9
SBI*
Buy
201
237
17.7
1.0
1.0
8.2
17.8
0.7
12.8
FedBk
Neutral
50
-
-
0.9
1.0
9.0
(2.9)
0.9
10.8
SIB
Neutral
19
-
-
0.7
0.7
5.8
21.6
0.7
11.6
BOB
Neutral
132
-
-
0.7
0.7
6.2
17.5
0.6
10.6
PNB
Neutral
98
-
-
0.5
0.5
3.6
28.5
0.7
12.0
BOI
Neutral
100
-
-
0.3
0.8
3.0
14.0
0.3
7.6
IndBk
Neutral
99
-
-
0.3
0.3
3.3
19.4
0.6
8.6
Vijaya Bank
Neutral
32
-
-
0.4
0.4
4.8
14.1
0.4
8.8
OBC
Neutral
116
-
-
0.2
0.3
2.6
65.5
0.5
9.4
Allahabad BankNeutral
60
-
-
0.3
0.3
2.2
56.2
0.6
11.9
UnionBk
Neutral
128
-
-
0.4
0.4
3.3
18.1
0.6
11.4
CanBk
Neutral
199
-
-
0.3
0.3
2.8
12.0
0.6
11.2
AllBk
Neutral
60
-
-
0.3
0.4
2.2
56.2
0.6
11.9
IDBI#
Neutral
70
-
-
0.5
0.5
4.9
61.6
0.6
9.3
Source: Company, Angel Research; Note: *Target multiples=SOTP target price/ABV (including subsidiaries); # Without adjusting for SASF
January 13, 2016
6
Federal Bank | 3QFY2016 Result Update
Income statement
Y/E March (` cr)
FY11
FY12
FY13
FY14
FY15 FY16E FY17E
NII
1,747
1,953
1,975
2,229
2,380
2,457
2,861
- YoY growth (%)
23.8
11.8
1.1
12.9
6.8
3.2
16.4
Other income
517
532
664
694
878
821
927
- YoY growth (%)
(2.7)
3.0
24.8
4.4
26.6
(6.5)
12.8
Operating income
2,263
2,486
2,639
2,922
3,259
3,279
3,787
- YoY growth (%)
16.6
9.8
6.2
10.7
11.5
0.6
15.5
Operating expenses
836
979
1,180
1,442
1,631
1,861
2,073
- YoY growth (%)
23.5
17.1
20.5
22.3
13.1
14.1
11.4
Pre-prov. profit
1,427
1,506
1,460
1,480
1,628
1,418
1,714
- YoY growth (%)
12.8
5.6
(3.1)
1.4
9.9
(12.9)
20.9
Prov. & cont.
525
337
266
268
106.7
385
265
- YoY growth (%)
29.6
(35.9)
(21.1)
1.0
(60.2)
261.0
(31.3)
PBT
902
1,170
1,194
1,212
1,521
1,032
1,449
- YoY growth (%)
4.9
29.7
2.1
1.5
25.5
(32.1)
40.4
Prov. for taxation
315
393
356
373
515
357
502
- as a % of PBT
34.9
33.6
29.8
30.8
33.9
34.6
34.6
PAT
587
777
838
839
1,006
675
948
- YoY growth (%)
26.4
32.3
7.9
0.1
19.9
(32.9)
40.4
January 13, 2016
7
Federal Bank | 3QFY2016 Result Update
Balance sheet
Y/E March (` cr)
FY11
FY12
FY13
FY14
FY15
FY16E
FY17E
Share Capital
171
171
171
171
171
343
343
Reserves & Surplus
4,938
5,535
6,194
6,780
7,566
8,082
8,811
Deposits
43,015
48,937
57,615
59,731
70,825
80,741
93,659
- Growth (%)
19.3
13.8
17.7
3.7
18.6
14.0
16.0
Borrowings
1,582
3,935
4,957
5,458
2,084
4,071
4,402
Tier 2 Capital
306
306
230
230
224
219
213
Other Liab. & Prov.
1,445
1,742
1,883
2,224
1,980
2,323
2,630
Total Liabilities
51,456
60,627
71,050
74,594
82,851
95,778
1,10,058
Cash Balances
2,935
2,424
2,743
3,104
3,380
4,037
4,683
Bank Balances
813
1,108
977
1,425
1,401
1,619
1,860
Investments
14,538
17,402
21,155
24,118
24,409
29,951
33,765
Advances
31,953
37,756
44,097
43,436
51,285
57,439
66,629
- Growth (%)
18.6
18.2
16.8
-1.5
18.1
12.0
16.0
Fixed Assets
290
326
397
425
467
523
583
Other Assets
927
1,610
1,681
2,086
1,910
2,208
2,537
Total Assets
51,456
60,627
71,050
74,594
82,851
95,778
1,10,058
- Growth (%)
17.8
17.8
17.2
5.0
11.1
15.6
14.9
January 13, 2016
8
Federal Bank | 3QFY2016 Result Update
Ratio analysis
Y/E March
FY11
FY12
FY13
FY14
FY15
FY16E
FY17E
Profitability ratios (%)
NIMs
3.8
3.6
3.1
3.2
3.1
2.8
2.9
Cost to Income Ratio
36.9
39.4
44.7
49.3
50.1
56.8
54.7
RoA
1.2
1.4
1.3
1.2
1.3
0.8
0.9
RoE
12.0
14.4
13.9
12.6
13.7
8.4
10.8
B/S ratios (%)
CASA Ratio
26.9
27.5
27.2
31.2
29.4
29.3
29.2
Credit/Deposit Ratio
74.3
77.2
76.5
72.7
72.4
71.1
71.1
CAR
16.8
16.6
14.7
15.3
15.6
14.8
14.1
- Tier I
15.6
15.9
14.1
14.6
14.8
14.1
13.5
Asset Quality (%)
Gross NPAs
3.5
3.3
3.4
2.5
2.0
2.2
2.0
Net NPAs
0.6
0.5
1.0
0.7
0.7
0.7
0.6
Slippages
3.2
2.1
2.1
1.2
1.7
2.1
1.5
Loan Loss Prov./Avg. Assets
1.0
0.4
0.3
0.3
0.3
0.4
0.2
Provision Coverage
83.4
84.7
72.2
70.4
64.8
67.8
68.5
Per Share Data (`)
EPS
3.4
4.5
4.9
4.9
5.9
3.9
5.5
ABVPS
59.7
66.7
73.8
80.6
89.0
48.6
52.9
DPS
8.5
9.0
9.0
10.0
11.0
4.0
5.5
Valuation Ratios
PER (x)
14.6
11.0
10.2
10.2
8.5
12.7
9.0
P/ABVPS (x)
0.8
0.8
0.7
0.6
0.6
1.0
0.9
Dividend Yield
17.0
18.0
18.0
20.0
22.0
8.0
11.0
DuPont Analysis (%)
NII
3.7
3.5
3.0
3.1
3.0
2.8
2.8
(-) Prov. Exp.
1.1
0.6
0.4
0.4
0.1
0.4
0.3
Adj. NII
2.6
2.9
2.6
2.7
2.9
2.3
2.5
Treasury
0.1
0.1
0.3
0.2
0.3
0.2
0.2
Int. Sens. Inc.
2.7
3.0
2.9
2.9
3.2
2.5
2.7
Other Inc.
1.0
0.8
0.7
0.7
0.8
0.8
0.7
Op. Inc.
3.7
3.8
3.6
3.6
4.0
3.2
3.4
Opex
1.8
1.7
1.8
2.0
2.1
2.1
2.0
PBT
1.9
2.1
1.8
1.7
1.9
1.2
1.4
Taxes
0.7
0.7
0.5
0.5
0.7
0.4
0.5
RoA
1.2
1.4
1.3
1.2
1.3
0.8
0.9
Leverage (x)
9.7
10.4
10.9
10.9
10.7
11.1
11.7
RoE
12.0
14.4
13.9
12.6
13.7
8.4
10.8
January 13, 2016
9
Federal Bank | 3QFY2016 Result Update
Research Team Tel: 022 - 39357800
DISCLAIMER
Angel Broking Private Limited (hereinafter referred to as “Angel”) is a registered Member of National Stock Exchange of India Limited,
Bombay Stock Exchange Limited and Metropolitan Stock Exchange of India Limited. It is also registered as a Depository Participant with
CDSL and Portfolio Manager with SEBI. It also has registration with AMFI as a Mutual Fund Distributor. Angel Broking Private Limited is
a registered entity with SEBI for Research Analyst in terms of SEBI (Research Analyst) Regulations, 2014 vide registration number
INH000000164. Angel or its associates has not been debarred/ suspended by SEBI or any other regulatory authority for accessing
/dealing in securities Market. Angel or its associates including its relatives/analyst do not hold any financial interest/beneficial
ownership of more than 1% in the company covered by Analyst. Angel or its associates/analyst has not received any compensation /
managed or co-managed public offering of securities of the company covered by Analyst during the past twelve months. Angel/analyst
has not served as an officer, director or employee of company covered by Analyst and has not been engaged in market making activity
of the company covered by Analyst.
This document is solely for the personal information of the recipient, and must not be singularly used as the basis of any investment
decision. Nothing in this document should be construed as investment or financial advice. Each recipient of this document should
make such investigations as they deem necessary to arrive at an independent evaluation of an investment in the securities of the
companies referred to in this document (including the merits and risks involved), and should consult their own advisors to determine
the merits and risks of such an investment.
Reports based on technical and derivative analysis center on studying charts of a stock's price movement, outstanding positions and
trading volume, as opposed to focusing on a company's fundamentals and, as such, may not match with a report on a company's
fundamentals.
The information in this document has been printed on the basis of publicly available information, internal data and other reliable
sources believed to be true, but we do not represent that it is accurate or complete and it should not be relied on as such, as this
document is for general guidance only. Angel Broking Pvt. Limited or any of its affiliates/ group companies shall not be in any way
responsible for any loss or damage that may arise to any person from any inadvertent error in the information contained in this report.
Angel Broking Pvt. Limited has not independently verified all the information contained within this document. Accordingly, we cannot
testify, nor make any representation or warranty, express or implied, to the accuracy, contents or data contained within this document.
While Angel Broking Pvt. Limited endeavors to update on a reasonable basis the information discussed in this material, there may be
regulatory, compliance, or other reasons that prevent us from doing so.
This document is being supplied to you solely for your information, and its contents, information or data may not be reproduced,
redistributed or passed on, directly or indirectly.
Neither Angel Broking Pvt. Limited, nor its directors, employees or affiliates shall be liable for any loss or damage that may arise from
or in connection with the use of this information.
Note: Please refer to the important ‘Stock Holding Disclosure' report on the Angel website (Research Section). Also, please refer to the
latest update on respective stocks for the disclosure status in respect of those stocks. Angel Broking Pvt. Limited and its affiliates may
have investment positions in the stocks recommended in this report.
Disclosure of Interest Statement
Federal Bank
1. Analyst ownership of the stock
No
2. Angel and its Group companies ownership of the stock
No
3. Angel and its Group companies' Directors ownership of the stock
No
4. Broking relationship with company covered
No
Note: We have not considered any Exposure below ` 1 lakh for Angel, its Group companies and Directors
Ratings (Based on expected returns
Buy (> 15%)
Accumulate (5% to 15%)
Neutral (-5 to 5%)
over 12 months investment period):
Reduce (-5% to -15%)
Sell (< -15)
January 13, 2016
10