Quick take
February 7, 2018
Elantas Beck India Ltd.
BUY
CMP
`2155
Leader in liquid insulation
Target Price
`2500
Investment Period
12 Months
Elantas Beck India (Elantas) is the Indian market leader in liquid insulation
segment used in electrical equipments like motors, transformers, generators etc.
Stock Info
Part of global specialty chemicals leader ALTANA Group, the company
Sector
Chemicals
practically has no visible peer in ` 600 cr+ market in India. Elantas enjoys
Market Cap (` cr)
1,701
market leadership in both primary and secondary insulation market with over
Beta
0.3
35% market share.
Liquid insulation forms small but critical part of the equipment: Liquid insulation
52 Week High / Low
2395/1726
forms a small part of the total equipment cost (<1-2%); however, it performs a
Avg. Daily Volume
1,704
critical function. This helps the company in commanding tangible pricing power
Face Value (`)
10
which helped in improving margins. It has almost doubled its margin to 21%
over CY12-16, taking advantage of falling crude prices and premium pricing.
BSE Sensex
34,082
This has helped in registering 6% CAGR in revenue and 17% CAGR in PAT over
Nifty
10,476
the same period.
Reuters Code
BECK.BO
Demand from user industries likely to be robust- It derives demand from several
Bloomberg Code
EBECK IN
industries including electronic equipment's, power segment and automotive
component Industries which are expected to register 10%+ CAGR in demand in
the coming years. Elantas with strong R&D support from its global parents and
Shareholding Pattern (%)
diversified product offerings is likely to benefit from such buoyant demand.
Promoters
75
Deleveraged company generates healthy free cash flow: It is a debt free
MF / Banks / Indian Fls
5
company which generates robust free cash flows. Its robust business model also
helps in limiting its working capital cycle
~65-70 days and its capex
FII / NRIs / OCBs
4
requirements. This has led to liquid investments crossing `128cr in H1FY18. The
Indian Public / Others
16
company shares this wealth in every 2-3 years with investors in the form of rich
dividends. We expect the company to soon announce a lumpy dividend.
Abs.(%)
3m 1yr 3yr
Outlook & Valuation: Elantas is likely to post subdued CY17 mainly marred by
GST woes and poor off take from customer side. The demand to pick up from
Sensex
1.4
20.2
20.8
CY18 onwards which will boost the earnings CAGR to 17% over CY18-20.
Elantas Beck
7.5
21.7
100.2
Current valuations at 22.4x CY19 EPS, looks attractive considering its growth
potential and high return ratios. We initiate coverage on Elantas with a Buy
recommendation and Target Price of `2500 (26x CY19E EPS), indicating an
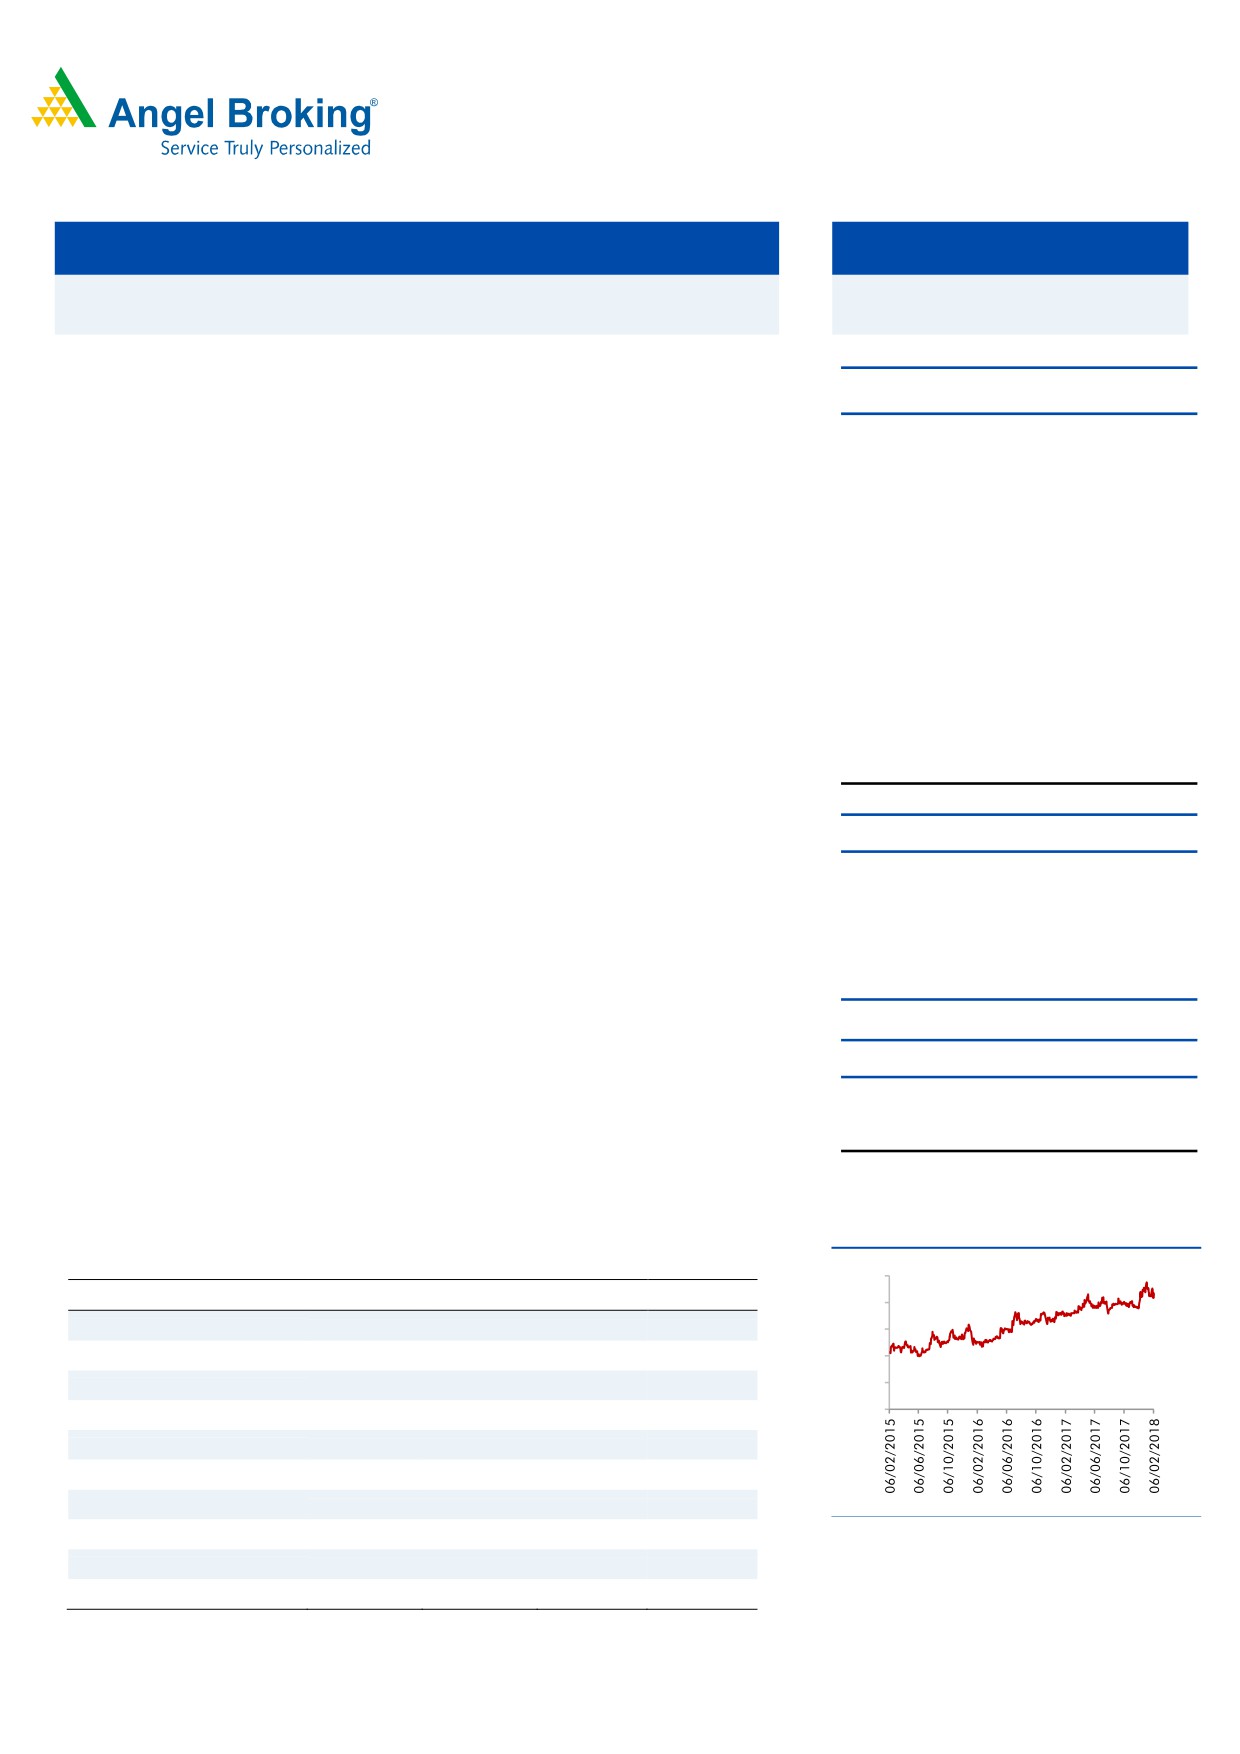
3-year price chart
upside of ~16% from the current levels.
Key Financials
2500
Y/E March ( ` cr)
CY2016
CY2017E CY2018E CY2019E
2000
Net Sales
365
373
435
508
1500
% chg
6.1
2.0
16.7
16.7
1000
500
Net Profit
54
55
66
76
0
% chg
30.6
1.4
18.6
16.3
OPM (%)
21.5
21.5
21.8
22.0
EPS (Rs)
68.7
69.7
82.7
96.2
P/E (x)
31.4
30.9
26.1
22.4
Source: Company, Angel Research
P/BV (x)
7.7
6.3
5.1
4.2
RoE (%)
24.6
20.2
19.6
18.8
Nidhi Agrawal
RoCE (%)
33.1
27.3
26.4
25.8
022 - 3935 7800 Ext: 6872
Source :Company, Angel Research; Note: CMP as of February 07, 2018
Please refer to important disclosures at the end of this report
1
All Prices in
Elantas Beck India| Initiating Coverage
Company Background
Incorporated in 1956 as Dr. Beck & Company India Ltd., ELANTAS is present in
India for 60+years. It was acquired by world’s leading company in Liquid
Electrical Insulation ELANTAS Gmbh, part of global specialty chemicals leader
ALTANA Group, in 2003. It is engaged in the business of manufacturing and
marketing of Electrical Insulation Systems and Electronic & Engineering Materials
having applications in Electrical Equipment, Power and Automotive Sectors. Its
manufacturing plants located at Pimpri, Pune in Maharashtra and Ankleshwar in
Gujarat with combined capacity of 24000 MT.
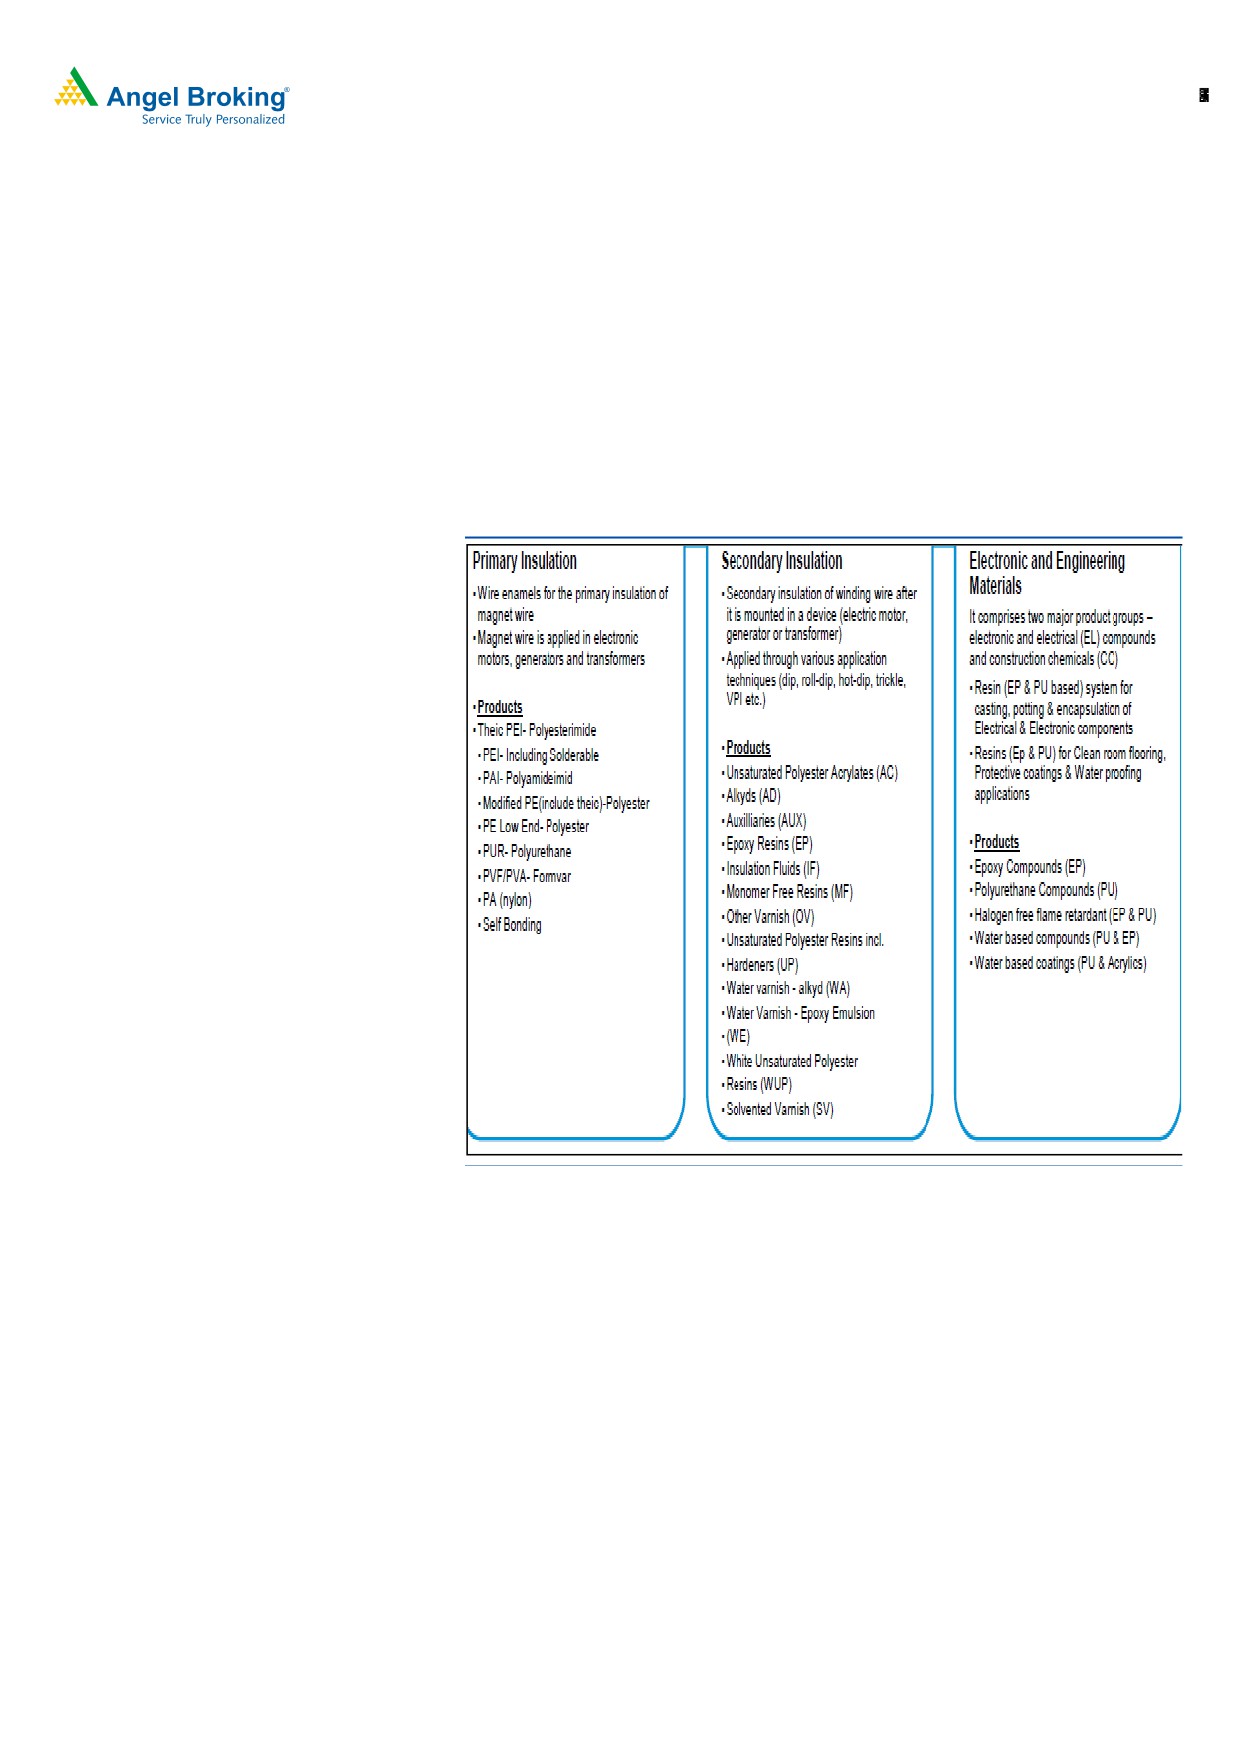
Product Profile
Source: Company
Outlook and Valuation
Elantas is likely to witness a subdued CY17 mainly marred by GST woes and poor
off take from customer side. We expect the demand to pick up from CY18
onwards which boost the earnings CAGR to 17% over CY18-20. We also expect
the company to announce a lumpy dividend in next few months to reduce its
burgeoning liquid investment. Current valuations at 22.4x CY19 EPS, looks
attractive considering its growth potential and high return ratios. We initiate
coverage on Elantas with a Buy recommendation and Target Price of `2500 (26x
CY19E EPS), indicating an upside of ~16% from the current levels.
February 07, 2018
2
All Prices in
Elantas Beck India| Initiating Coverage
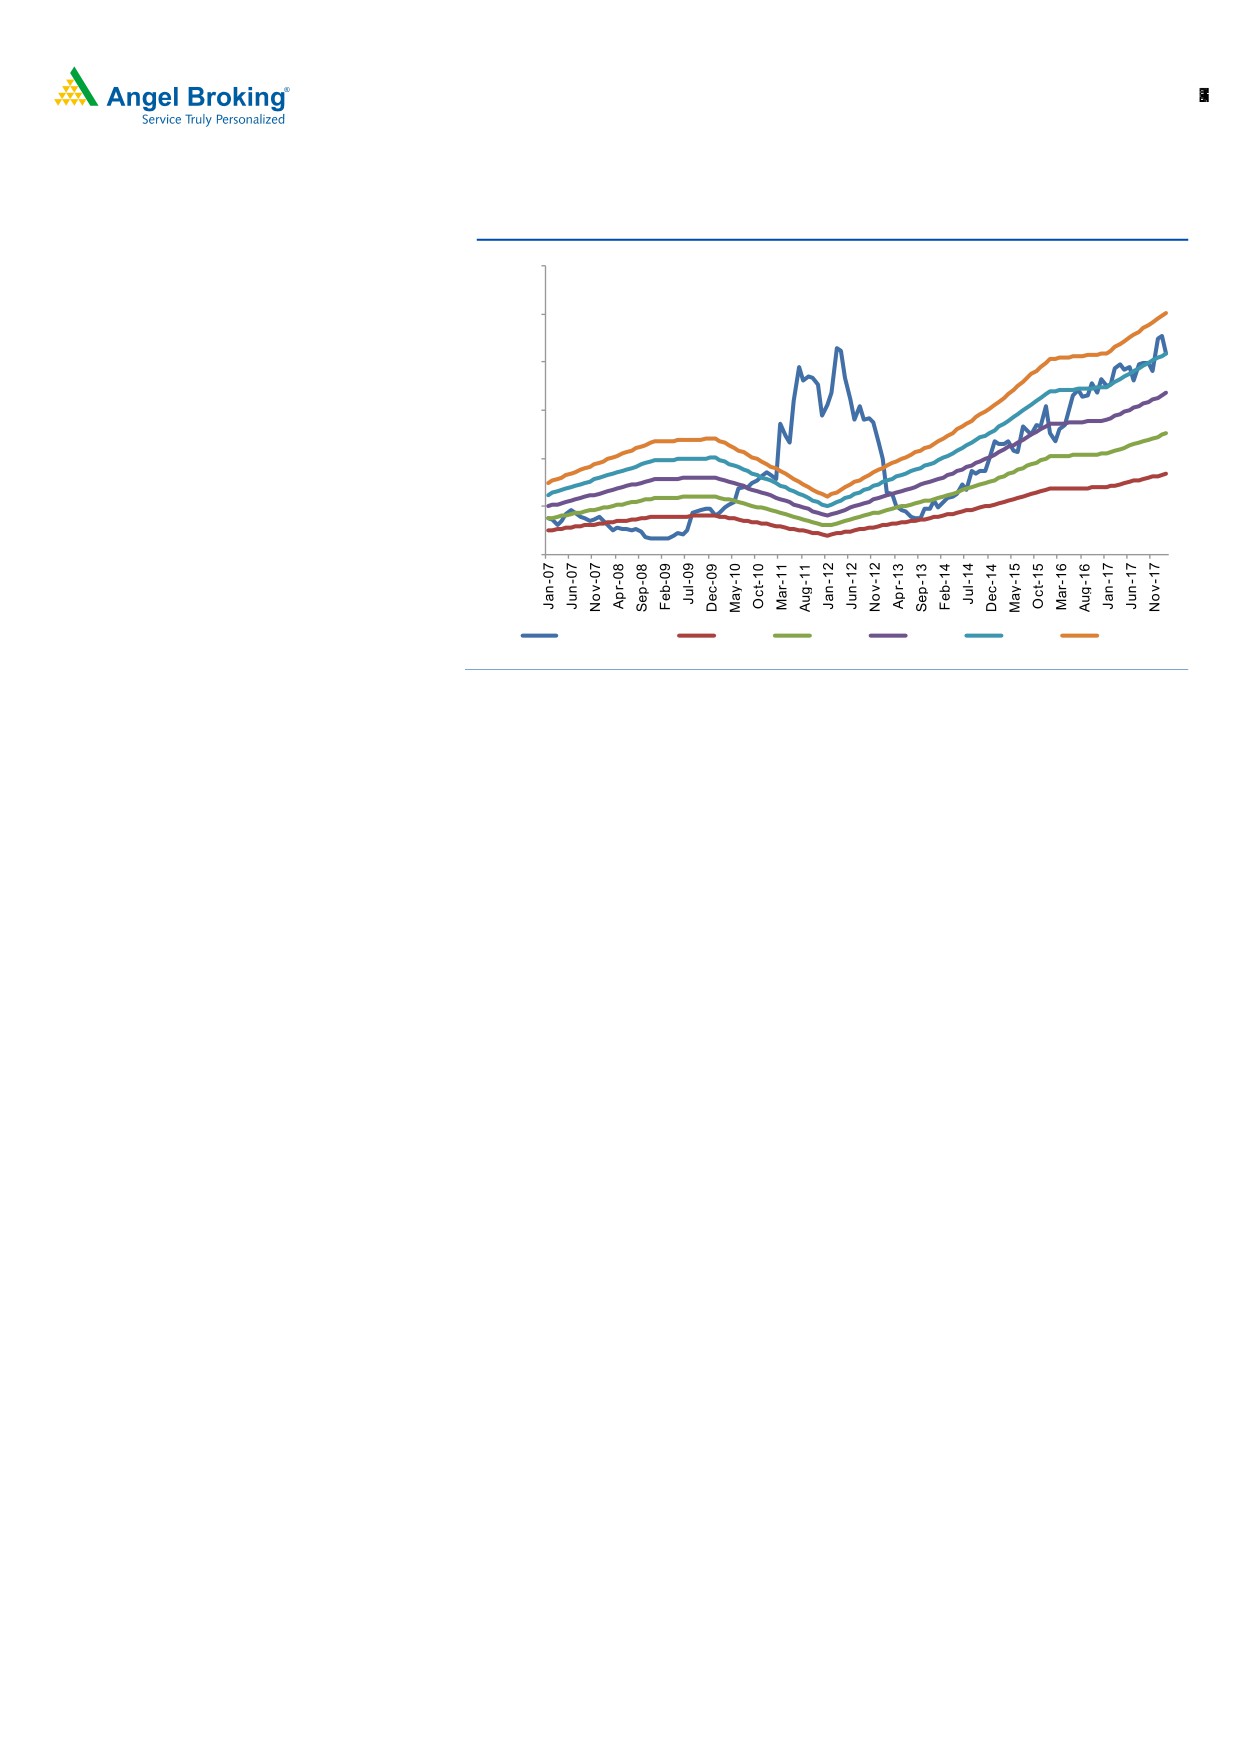
Exhibit 1: One Year Forward P/E
3000.00
2500.00
2000.00
1500.00
1000.00
500.00
0.00
Close -Unit Curr
10.0 X
15.0 X
20.0 X
25.0 X
30.0 X
Source: Company, Angel Research
Risks to our estimates
Revenues may get impacted if the demand from the user industries i.e.
electrical equipments slows down
Abrupt fluctuations in raw material price i.e. crude oil and its derivatives may
adversely impact profitability
February 07, 2018
3
All Prices in
Elantas Beck India| Initiating Coverage
Profit & Loss Statement
Y/E March (` cr)
CY2016
CY2017E
CY2018E
CY2019E
Total operating income
365
373
435
508
% chg
6.1
2.0
16.7
16.7
Total Expenditure
287
292
340
396
Raw Material
220
224
262
306
Personnel
22
23
26
30
Others Expenses
45
45
52
60
EBITDA
79
80
95
112
% chg
26.3
2.0
18.4
17.8
(% of Net Sales)
21.5
21.5
21.8
22.0
Depreciation& Amortisation
5
6
7
7
EBIT
73.5
75
88
105
% chg
30.4
1.6
18.4
18.5
(% of Net Sales)
20.1
20.0
20.3
20.6
Interest & other Charges
0
0
0
0
Other Income
8
10
12
12
(% of PBT)
9.4
11.8
12.0
10.3
Share in profit of Associates
-
-
-
-
Recurring PBT
80.9
84
100
117
% chg
31.0
4.4
18.6
16.3
Tax
28
29
35
40
(% of PBT)
34.5
34.5
34.5
34.5
Deferred tax
(1.5)
-
-
-
PAT (reported)
54
55
66
76
Extraordinary Items
(0)
-
-
-
ADJ. PAT
54.5
55
66
76
% chg
30.6
1.4
18.6
16.3
(% of Net Sales)
14.9
14.8
15.1
15.0
Basic EPS (Rs)
68.7
69.7
82.7
96.2
Fully Diluted EPS (Rs)
68.7
69.7
82.7
96.2
% chg
30.6
1.4
18.6
16.3
February 07, 2018
4
All Prices in
Elantas Beck India| Initiating Coverage
Balance Sheet
CY2016
CY2017E
CY2018E
CY2019E
SOURCES OF FUNDS
Equity Share Capital
8
8
8
8
Reserves& Surplus
214
265
326
398
Shareholders Funds
222
273
334
406
Total Loans
-
-
-
-
Deferred Tax Liability
(1)
-
-
-
Other Long Term Liabilities
0.5
0.5
0.5
0.5
Long-Term Provisions
3.5
4.7
4.9
5.2
Total Liabilities
225
278
340
412
APPLICATION OF FUNDS
(4)
30
12
10
Gross Block
96
126
138
148
Less: Acc. Depreciation
60
65
72
79
Net Block
36
61
66
69
Capital Work-in-Progress
5
2
2
2
Investments
109
129
149
169
Long-Term Loans and Advances
3.6
2.6
2.6
2.6
Other non current assets
0.2
0.2
0.2
0.2
Current Assets
134
149
196
259
Inventories
56
57
67
78
Sundry Debtors
53
54
63
74
Cash
17
27
54
93
Loans & Advances
4
4
4
5
Other Assets
4
6
7
9
Current liabilities
64
66
77
90
Net Current Assets
70
83
119
169
Deferred Tax Asset
-
-
-
-
Mis. Exp. not written off
-
-
-
-
Total Assets
225
278
340
412
February 07, 2018
5
All Prices in
Elantas Beck India| Initiating Coverage
Cash Flow Statement
Y/E March (Rs cr)
CY2016
CY2017E CY2018E CY2019E
Profit before tax
81
84
100
117
Depreciation
5
6
7
7
Change in Working Capital
1
(1)
(9)
(11)
Interest / Dividend (Net)
(1)
0
0
0
Direct taxes paid
(26)
(29)
(35)
(40)
Others
(4)
0
0
0
Cash Flow from Operations
56
68
51
62
(Inc.)/ Dec. in Fixed Assets
(5)
(30)
(12)
(10)
(Inc.)/ Dec. in Investments
(45)
(20)
(20)
(20)
Other income
5
10
12
12
Cash Flow from Investing
(51)
(40)
(20)
(18)
Issue of Equity
0
0
0
0
Inc./(Dec.) in loans
0
0
0
0
Dividend Paid (Incl. Tax)
(5)
(4)
(4)
(5)
Interest / Dividend (Net)
(0)
0
0
0
Cash Flow from Financing
(5)
(4)
(4)
(5)
Inc./(Dec.) in Cash
0
24
27
39
Opening Cash balances
0
3
27
54
Closing Cash balances
0
27
54
93
Free cash flow
106
108
71
80
February 07, 2018
6
All Prices in
Elantas Beck India| Initiating Coverage
Key Ratios
Y/E March
CY2016
CY2017E
CY2018E
CY2019E
Valuation Ratio (x)
P/E (on FDEPS)
31.4
30.9
26.1
22.4
P/CEPS
28.6
28.1
23.7
20.5
P/BV
7.7
6.3
5.1
4.2
Dividend yield (%)
0.2
0.2
0.3
0.3
EV/Sales
4.3
4.2
3.5
2.8
EV/EBITDA
20.1
19.4
15.8
12.9
EV / Total Assets
7.0
5.6
4.4
3.5
Per Share Data (Rs)
EPS (Basic)
68.7
69.7
82.7
96.2
EPS (fully diluted)
68.7
69.7
82.7
96.2
Cash EPS
75.2
76.7
91.0
105.2
DPS
4.5
5.0
5.5
6.1
Book Value
279.8
344.5
421.7
511.9
Returns (%)
ROCE
33.1
27.3
26.4
25.8
Angel ROIC (Pre-tax)
77.1
64.1
67.5
72.9
ROE
24.6
20.2
19.6
18.8
Turnover ratios (x)
Asset Turnover (Gross Block)
3.8
3.0
3.1
3.4
Inventory / Sales (days)
56
56
56
56
Receivables (days)
53
53
53
53
Payables (days)
41
41
41
41
Working capital cycle (ex-cash) (days)
68
68
68
68
Source: Company Angel research, Note - Valuation done on closing price of 07/02/2018
February 07, 2018
7
All Prices in
Elantas Beck India| Initiating Coverage
Research Team Tel: 022 - 39357800
DISCLAIMER
Angel Broking Private Limited (hereinafter referred to as “Angel”) is a registered Member of National Stock Exchange of India Limited,
Bombay Stock Exchange Limited and Metropolitan Stock Exchange Limited. It is also registered as a Depository Participant with CDSL
and Portfolio Manager with SEBI. It also has registration with AMFI as a Mutual Fund Distributor. Angel Broking Private Limited is a
registered entity with SEBI for Research Analyst in terms of SEBI (Research Analyst) Regulations, 2014 vide registration number
INH000000164. Angel or its associates has not been debarred/ suspended by SEBI or any other regulatory authority for accessing
/dealing in securities Market. Angel or its associates/analyst has not received any compensation / managed or co-managed public
offering of securities of the company covered by Analyst during the past twelve months.
This document is solely for the personal information of the recipient, and must not be singularly used as the basis of any investment
decision. Nothing in this document should be construed as investment or financial advice. Each recipient of this document should
make such investigations as they deem necessary to arrive at an independent evaluation of an investment in the securities of the
companies referred to in this document (including the merits and risks involved), and should consult their own advisors to determine
the merits and risks of such an investment.
Reports based on technical and derivative analysis center on studying charts of a stock's price movement, outstanding positions and
trading volume, as opposed to focusing on a company's fundamentals and, as such, may not match with a report on a company's
fundamentals. Investors are advised to refer the Fundamental and Technical Research Reports available on our website to evaluate the
contrary view, if any.
The information in this document has been printed on the basis of publicly available information, internal data and other reliable
sources believed to be true, but we do not represent that it is accurate or complete and it should not be relied on as such, as this
document is for general guidance only. Angel Broking Pvt. Limited or any of its affiliates/ group companies shall not be in any way
responsible for any loss or damage that may arise to any person from any inadvertent error in the information contained in this report.
Angel Broking Pvt. Limited has not independently verified all the information contained within this document. Accordingly, we cannot
testify, nor make any representation or warranty, express or implied, to the accuracy, contents or data contained within this document.
While Angel Broking Pvt. Limited endeavors to update on a reasonable basis the information discussed in this material, there may be
regulatory, compliance, or other reasons that prevent us from doing so.
This document is being supplied to you solely for your information, and its contents, information or data may not be reproduced,
redistributed or passed on, directly or indirectly.
Neither Angel Broking Pvt. Limited, nor its directors, employees or affiliates shall be liable for any loss or damage that may arise from
or in connection with the use of this information.
Disclosure of Interest Statement
Elantas Beck India
1. Financial interest of research analyst or Angel or his Associate or his relative
No
2. Ownership of 1% or more of the stock by research analyst or Angel or associates or relatives
No
3. Served as an officer, director or employee of the company covered under Research
No
4. Broking relationship with company covered under Research
No
February 07, 2018
8