4QFY2016 Result Update | Automobile
February 6, 2016
Eicher Motors
ACCUMULATE
CMP
`18,128
Performance Highlights
Target Price
`20,044
Y/E December (` cr)
4QFY16* 3QCY14
% chg (yoy) 3QFY16*
% chg (qoq)
Investment Period
12 Months
Net Sales
3,317
2,294
44.6
3,123
6.2
EBITDA
517
303
70.6
493
4.9
Stock Info
EBITDA Margin (%)
15.6
13.2
240 bp
15.8
(20 bp)
Sector
Automobile
Adj. PAT
271
154
76.1
255
6.0
Market Cap (` cr)
49,226
Source: Company, Angel Research; * FY16 is a 15month period
Net Debt (` cr)
(422)
Beta
1.2
Results in line with estimates: Eicher Motors’ 4QFY2016 consolidated results have
52 Week High / Low
21,618/13,930
come in in line with our estimates. Consolidated revenues grew 45% yoy to
Avg. Daily Volume
10,398
`3,316cr, coming broadly in line with our expectation. The 2W business (Royal
Face Value (`)
10
Enfield)’s top-line grew strongly by 55% yoy to `1,284cr, driven largely by volume
BSE Sensex
24,617
growth. The VECV segment’s revenues grew 39% yoy, driven majorly by strong
demand in the commercial vehicle (CV) segment and market share gains.
Nifty
7,489
Consolidated operating margins at 15.6% were in line with our estimates of
Reuters Code
EICH.BO
15.3%. Royal Enfield posted its highest ever margins of 28.6% (a 90bp sequential
Bloomberg Code
EIM IN
improvement despite slightly lower volumes due to disruption by Chennai rains).
Royal Enfield’s margins were better than our estimate of 26.5%. The VECV
Shareholding Pattern (%)
segment’s margins at
7.4% were lower than our estimate of
8.1%. The
Promoters
54.9
consolidated net profit at `271cr was in line with our estimate.
MF / Banks / Indian Fls
7.2
Outlook and Valuation: Demand for Royal Enfield continues to remain strong on
FII / NRIs / OCBs
26.6
increasing acceptance of leisure biking in India. The company continues to have
Indian Public / Others
11.3
an order backlog with higher number of orders being taken per month than the
actual production despite huge capacity addition. Also, the company has recently
introduced the 400cc adventure tourer bike “Himalayan” which is likely to boost
Abs. (%)
3m 1yr
3yr
demand going ahead. Also, commercial vehicle (VECV) business is witnessing
Sensex
(6.4)
(14.7)
25.2
strong demand given the recovery in the CV segment. We have marginally
Eicher Motors
2.5
14.6
530.7
increased our earnings estimates given the margin beat at Royal Enfield. We
maintain our Accumulate recommendation on the stock with a revised SOTP
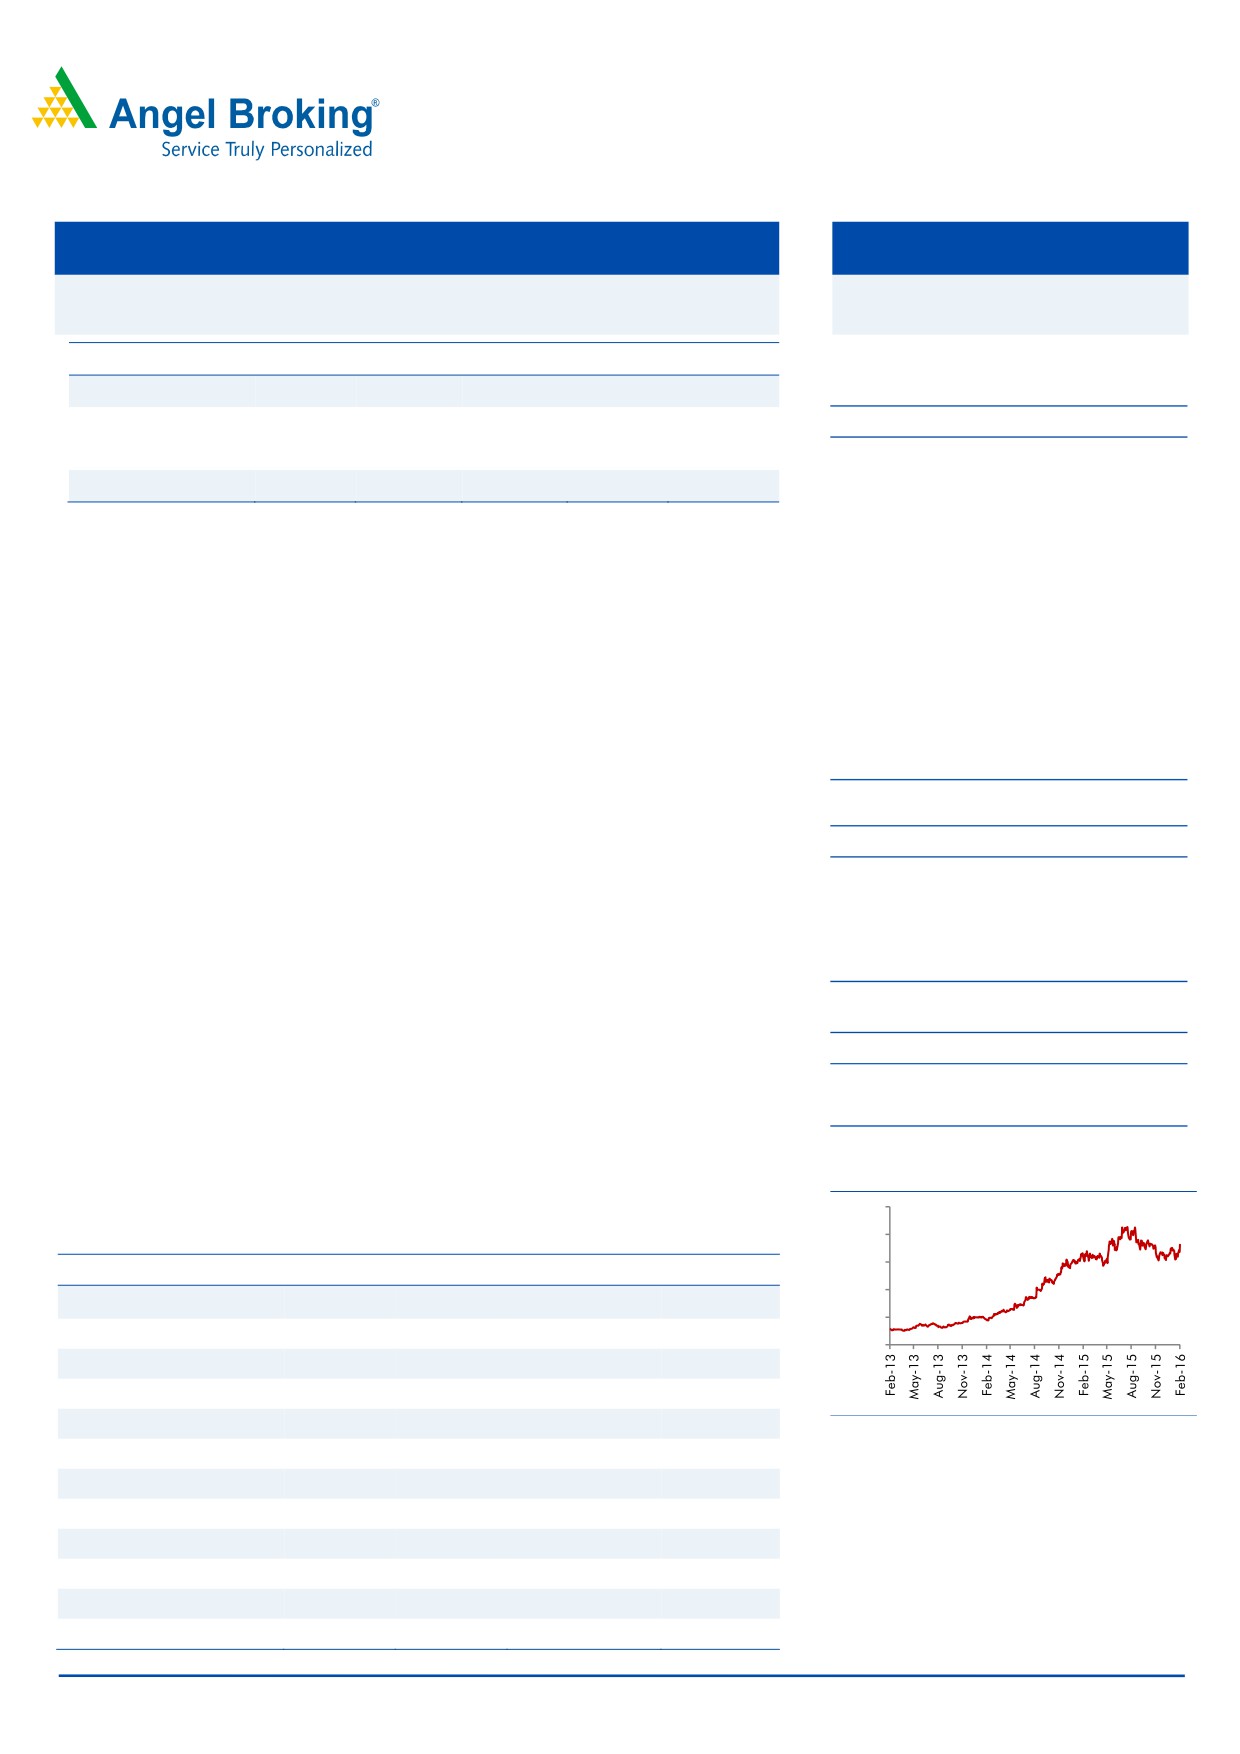
3-year price chart
based target price of `20,044.
25,000
20,000
Key financials (Consolidated)
15,000
Y/E December (` cr)
CY2013
CY2014
15MFY2016E
FY2017E
10,000
Net Sales
6,810
8,738
15,556
16,747
5,000
% chg
6.6
28.3
49.3
28.9
0
Net Profit
394
615
1,262
1,622
% chg
21.2
55.9
77.0
52.1
EBITDA (%)
10.5
12.8
15.5
17.3
Source: Company, Angel Research
EPS (`)
145.6
227.1
464.8
597.5
P/E (x)
124.5
79.8
39.0
30.3
P/BV (x)
24.2
19.7
14.2
10.5
RoE (%)
19.2
24.5
36.2
34.3
RoCE (%)
19.8
25.1
39.8
39.9
Bharat Gianani
EV/Sales (x)
7.0
5.4
3.1
2.8
022-3935 7800 Ext: 6817
EV/EBITDA (x)
66.8
42.6
19.8
16.2
Source: Company, Angel Research; Note: CMP as of February 5, 2016
Please refer to important disclosures at the end of this report
1
Eicher Motors | 4QFY2016 Result Update
Exhibit 1: Quarterly financial performance (Consolidated)
Y/E December (` cr)
4QFY16*
4QCY14
% chg (yoy)
3QFY16*
% chg (qoq)
12MFY16* CY14
% chg (yoy)
Net Sales
3,317
2,294
44.6
3,123
6.2
11,924
8,738
36.5
Consumption of RM
2,132
1,493
42.8
2,017
5.7
7,708
5,766
33.7
(% of Sales)
64.3
65.1
64.6
64.6
66.0
Staff Costs
228
167
36.3
214
6.2
830
660
25.9
(% of Sales)
6.9
7.3
6.9
7.0
7.5
Other Expenses
440
330
33.2
398
10.5
1,578
1,198
31.7
(% of Sales)
13.3
14.4
12.8
13.2
13.7
Total Expenditure
2,800
1,991
40.6
2,630
6.5
10,116
7,624
32.7
Operating Profit
517
303
70.6
493
4.9
1,807
1,115
62.1
OPM (%)
15.6
13.2
15.8
15.2
12.8
Interest
2
2
13.8
3
(23.2)
8
10
25.9
Depreciation
99
60
65.0
88
12.8
343
220
56.1
Other Income
31
15
103.9
13
143.3
84
107
(21.9)
PBT (excl. Extr. Items)
447
256
74.3
415
7.7
1,540
993
55.1
Extr. Income/(Expense)
PBT (incl. Extr. Items)
447
256
74.3
415
7.7
1,540
993
55.1
(% of Sales)
13.5
11.2
13.3
12.9
11.4
Provision for Taxation
136
75
80.6
129
5.4
471
291
61.8
(% of PBT)
30.4
29.4
31.1
30.6
29.3
PAT before MI
311
181
71.7
286
8.7
1,069
702
52.4
Minority Interest
40
27
46.6
30
31.6
126
86
46.0
Net Profit after MI
271
154
76.1
255
6.0
943
615
53.3
PATM
8.2
6.7
8.2
7.9
7.0
Equity capital (cr)
27
27
27
27
27
Reported EPS (`)
99.7
56.7
75.8
94.1
6.0
348
227
53.0
Source: Company, Angel Research; * FY16 is a 15month period
Exhibit 2: 4QFY2016 - Actual vs Angel estimates
Y/E December (` cr)
Actual
Estimates
Variation (%)
Net Sales
3,317
3,278
1.2
EBITDA
517
503
2.9
EBITDA margin (%)
15.6
15.3
30 bp
Adj. PAT
271
271
0.0
Source: Company, Angel Research
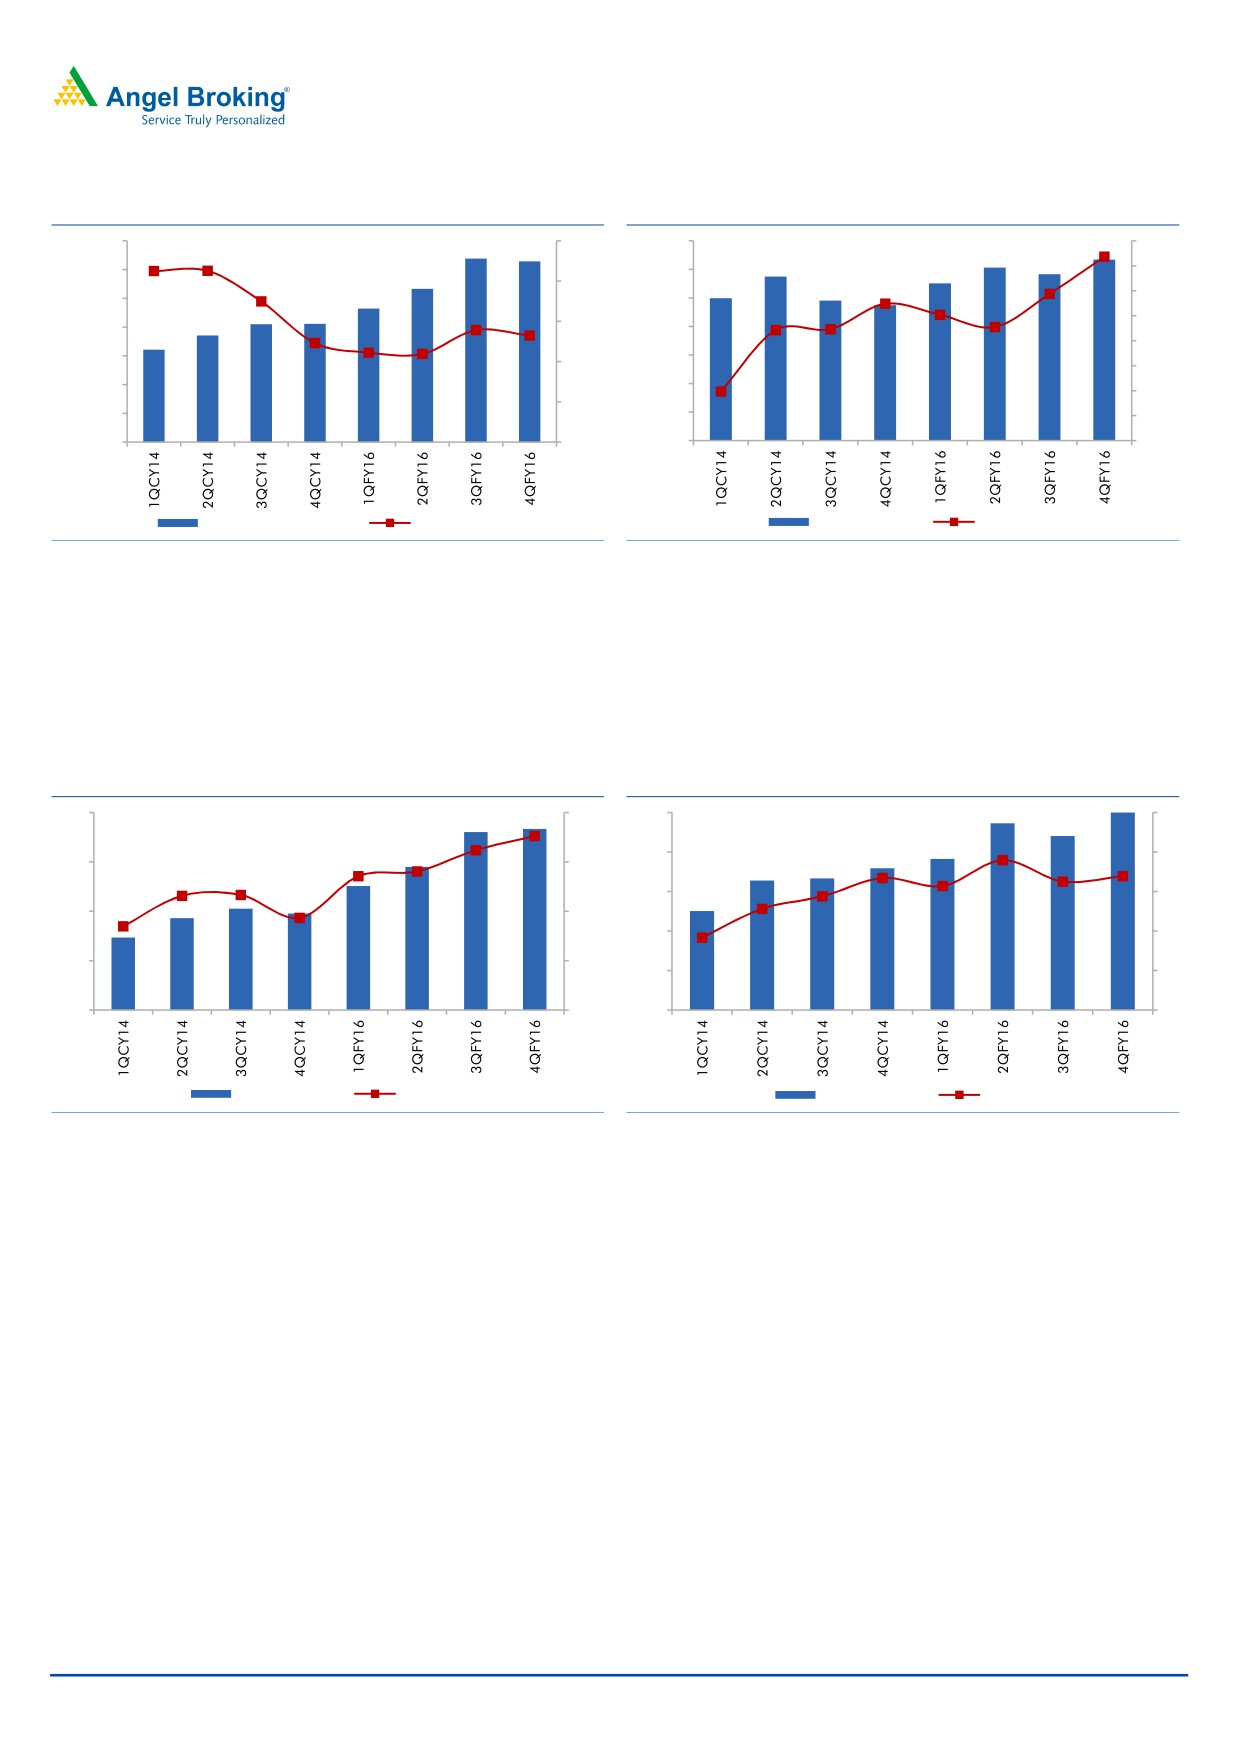
Royal Enfield continued with its robust double-digit volume growth, led by
capacity expansion as demand continues to outstrip supply. In 4QFY2016,
volumes grew 53% yoy but declined marginally by 1% on a sequential basis.
Volumes were impacted by about 11,200 units due to production disruptions
owing to floods in Chennai. The current order backlog for Royal Enfield stands
at 3-4 months.
VECV volumes continued to report healthy double-digit growth, led by
improvement in LMD and HD volumes. VECV reported the second consecutive
month of double-digit growth (volumes grew by 34% yoy).
February 6, 2016
2
Eicher Motors | 4QFY2016 Result Update
Exhibit 3: Royal Enfield growth trend
Exhibit 4: VECV growth trend
140,000
100
14,000
40
120,000
12,000
30
80
20
100,000
10,000
10
80,000
60
8,000
0
60,000
6,000
40
(10)
40,000
4,000
(20)
20
20,000
2,000
(30)
0
0
0
(40)
Royal Enfield Volumes
Growth yoy (%)
VECV volumes
Growth yoy (%)
Source: Company, Angel Research
Source: Company, Angel Research
Royal Enfield’s margins are in a constant uptrend, buoyed by a sharp jump in
volumes, tremendous pricing power and benign commodity prices. In
4QFY2016, Royal Enfield posted lifetime high margins of 28.6%.
VECV margins at 7.4% improved marginally on a yoy basis.
Exhibit 5: Royal Enfield margins at record high
Exhibit 6: VECV margins improve marginally
400
30
150
9
120
8
300
27
90
7
200
24
60
6
100
21
30
5
0
18
0
4
EBIDTA (` cr)
Margin (%)
EBIDTA (` cr)
Marign (%)
Source: Company, Angel Research
Source: Company, Angel Research
Conference call - Key highlights
The demand for Royal Enfield bikes continues to remain strong with the
company taking more orders every month as compared to sales volumes.
However, given the huge capacity increase, the waiting period for bikes has
reduced from 4-6 months earlier to 3-4 months currently.
EML has received a board approval for commencing its third manufacturing
plant for Royal Enfield, given the strong demand. Royal Enfield is targeting to
have a total capacity of 9 lakh units by CY2018, given the ramp up at the
second plant and commencement of the third unit. EML has given production
guidance of 620,000 units for CY2016 and 780,000 units for CY2017.
EML recently introduced an all new
411cc adventure bike “Himalyan”.
Himalyan has an all new engine developed by EML and would be positioned
as an mid adventure tourer bike. As per EML, this is an altogether new
segment as the current rugged off-roader bikes are in the higher cc segment.
February 6, 2016
3
Eicher Motors | 4QFY2016 Result Update
The bookings for Himalyan would commence in mid March 2016. To broaden
the product portfolio, EML would introduce another new bike in CY2017.
Royal Enfield has been expanding its dealer network in tier 2 and tier 3 cities.
It increased the dealership strength from 400 dealers in CY2014 to 500
dealers in CY2015. Royal Enfield plans to have more than 550 dealers by
CY2016.
EML is targeting export markets as a new growth driver for Royal Enfield. It is
eyeing potential in South East Asia and Latin American markets which have a
huge commuter bike base to boost exports. EML has established presence in
Thailand and Jakarta and is likely to commence exports shortly.
VECV volumes continued to improve given the uptick in the MHCV industry on
account of better freight availability and improved fleet operator sentiments
due to subdued diesel prices. VECV posted second consecutive month of
double-digit growth in 4QFY2016.
VECV lost some market share in the MHCV space due to high discounting in
the industry. VECV market share slipped marginally from 11.7% in CY2014 to
10.6% in CY2015.
Engine supplies to Volvo have been ramping up. In 4QFY2016, VECV shipped
about 4,728 units as against 2,600 units in the corresponding quarter last
year.
Royal Enfield undertook a price increase of about 1% in January 2016 while
VECV increased prices by 1.2% in November 2015.
Eicher-Polaris JV for all terrain vehicles has been progressing as per plans.
Eicher is expanding the distribution of its recently introduced “Multix” vehicle.
So far Multix has sold 650 units in the last six months.
Investment arguments
Royal Enfield demand to remain strong; ramping capacity to meet demand:
EML’s two-wheeler business (Royal Enfield) is in a demand sweet spot and is
expected to report a healthy 30% CAGR in volume over the next two years.
Royal Enfield is the direct beneficiary of pick up in the leisure biking trend.
Customers are increasingly opting for leisure bikes as an upgrade. Currently,
the segment just accounts for about 3% of the motorcycle industry and has
tremendous demand potential. EML enjoys virtual monopoly in the space
commanding a market share of 95% on back of strong brand image and
appropriate pricing which is very difficult to replicate. EML has an order backlog
of about 5 months and continues to ramp capacity to meet demand. Recently,
EML has acquired land for another plant in Chennai to boost production.
CV volumes to recover on back of improving demand cycle and new product
launches: After three consecutive years of downturn, the commercial vehicle
segment is poised to recover over the next two to three years. Better economic
growth and improvement in fleet utilization is expected to boost volumes.
Further, VECV aims to gain market share in the HCV space on back of new
product launches in technological tie up with Volvo. Also, the discounting levels
which are currently at record highs are likely to recede given the recovery in
volumes.
February 6, 2016
4
Eicher Motors | 4QFY2016 Result Update
Outlook and valuation
Demand for Royal Enfield continues to remain strong on increasing acceptance of
leisure biking in India. The company continues to have an order backlog with
higher number of orders being taken per month than the actual production despite
huge capacity addition. Also, the company has recently introduced the 400cc
adventure tourer bike “Himalayan” which is likely to boost demand going ahead.
Also, commercial vehicle (VECV) business is witnessing strong demand given the
recovery in the CV segment. We have marginally increased our earnings estimates
given the margin beat at Royal Enfield. We maintain our Accumulate
recommendation on the stock with a revised SOTP based target price of `20,044.
Exhibit 7: SOTP valuation
Particulars
Value/share
Remarks
Royal Enfield
18,188
At 35x FY17 earnings
VECV
1,856
At 12x FY17 EV/EBIDTA
Target Price
20,044
Source: Company, Angel Research
Company background
Eicher Motors Ltd (EML) manufactures commercial vehicles in collaboration with
global giant Volvo (through the subsidiary VECV) and manufactures two-wheelers
(Royal Enfield). VECV is one of the leading commercial vehicle manufacturers,
commanding a market share of about 7%. Apart from commercial vehicles, VECV
also manufactures engines for captive usage and supplies to Volvo for their global
range of trucks. VECV’s manufacturing plant is located in Pithampur, Madhya
Pradesh. Royal Enfield is the market leader in the leisure biking space, having a
market share in excess of 95%. Two-wheelers are currently manufactured at the
Chennai plant.
February 6, 2016
5
Eicher Motors | 4QFY2016 Result Update
Profit and loss statement (Consolidated)
Y/E December (` cr)
CY2011
CY2012
CY2013
CY2014 15MFY2016E
FY2017E
Total operating income
5,700
6,390
6,810
8,738
15,556
16,747
% chg
28.9
12.1
6.6
28.3
49.3
28.9
Total expenditure
5,110
5,841
6,097
7,624
13,146
13,844
Net raw material costs
4,135
4,585
4,639
5,766
10,011
10,673
Employee expenses
346
457
533
660
1,070
1,026
Other
629
798
925
1,198
2,066
2,145
EBITDA
590
549
713
1,115
2,410
2,903
% chg
54.7
(6.9)
29.9
56.3
88.1
42.0
(% of total op. income)
10.3
8.6
10.5
12.8
15.5
17.3
Depreciation & amort.
64
82
130
220
449
455
EBIT
666
603
678
1,002
2,035
2,615
% chg
55.9
(9.3)
12.4
47.8
78.5
44.5
(% of total op. income)
11.7
9.4
10.0
11.5
13.1
15.6
Interest and other charges
8
4
8
10
11
13
Other income
140
137
95
107
74
168
Recurring PBT
658
600
671
993
2,024
2,603
% chg
57.6
(8.9)
11.8
48.0
79.0
52.9
Extraordinary items
-
-
-
-
PBT (reported)
658
600
671
993
2,024
2,603
Tax
163
125
145
291
613
757
(% of PBT)
24.7
20.8
21.7
29.3
30.3
29.1
PAT before MI
496
475
525
702
1,411
1,845
% chg
61.9
1.6
10.6
33.6
71.4
54.5
(% of total op. income)
8.7
7.4
7.7
8.0
9.1
11.0
Minority Interest
189
151
131
86
149
223
Profit after MI
307
324
394
615
1,262
1,622
Basic EPS (`)
103.3
120.1
145.6
227.1
464.8
597.5
Adj. EPS (`)
103.3
120.1
145.6
227.1
464.8
597.5
% chg
46.6
16.3
21.2
55.9
77.0
52.1
February 6, 2016
6
Eicher Motors | 4QFY2016 Result Update
Balance sheet statement
Y/E December (` cr)
CY2011 CY2012 CY2013 CY2014 15MFY2016E FY2017E
SOURCES OF FUNDS
Equity share capital
27
27
27
27
27
27
Reserves & surplus
1,466
1,728
2,028
2,489
3,455
4,698
Shareholders’ Funds
1,493
1,755
2,055
2,516
3,482
4,725
Total loans
44
23
84
58
58
58
Minority Interest
838
948
1,040
1,085
1,234
1,424
Deferred tax liability
64
123
180
239
239
239
Other long term liabilities
28
18
14
17
17
17
Long term provisions
43
56
60
73
80
90
Total Liabilities
2,510
2,923
3,433
3,988
5,111
6,553
APPLICATION OF FUNDS
Gross block
989
1,526
2,299
3,137
4,337
5,337
Less: Acc. depreciation
484
534
643
828
1,277
1,732
Net Block
504
992
1,656
2,309
3,060
3,605
Capital work-in-progress
352
504
464
419
419
419
Investments
513
639
825
1,078
1,078
1,278
Long term loans and adv.
249
330
298
478
700
754
Other noncurrent assets
6
6
7
8
8
8
Current assets
2,169
2,000
2,086
2,116
3,330
4,209
Cash
1,192
804
683
481
188
839
Loans & advances
163
220
318
380
767
826
Other
815
977
1,085
1,256
2,375
2,545
Current liabilities
1,284
1,548
1,904
2,419
3,484
3,719
Net current assets
886
452
182
(303)
(153)
490
Total Assets
2,510
2,923
3,433
3,988
5,111
6,553
February 6, 2016
7
Eicher Motors | 4QFY2016 Result Update
Cash flow statement
Y/E December (` cr)
CY2011 CY2012 CY2013 CY2014 15MFY2016E FY2017E
Profit before tax
660
600
671
993
2,024
2,603
Depreciation
57
50
109
185
449
455
Change in working capital
177
46
149
283
(442)
7
Others
(196)
(58)
40
(145)
(215)
(77)
Direct taxes paid
(163)
(125)
(145)
(291)
(613)
(757)
Cash Flow from Operations
536
513
824
1,025
1,203
2,230
(Inc.)/Dec. in fixed assets
(463)
(689)
(733)
(793)
(1,200)
(1,000)
(Inc.)/Dec. in investments
(54)
(126)
(187)
(252)
-
(200)
Cash Flow from Investing
(517)
(815)
(919)
(1,046)
(1,200)
(1,200)
Issue of equity
-
-
-
-
-
-
Inc./(Dec.) in loans
(52)
(21)
61
(26)
-
-
Dividend paid (Incl. Tax)
(43)
(54)
(81)
(159)
(295)
(380)
Others
22
(10)
(5)
3
-
-
Cash Flow from Financing
(73)
(86)
(25)
(181)
(295)
(380)
Inc./(Dec.) in cash
(54)
(388)
(121)
(202)
(293)
651
Opening Cash balances
1,246
1,192
803
683
480
188
Closing Cash balances
1,192
803
683
480
188
839
February 6, 2016
8
Eicher Motors | 4QFY2016 Result Update
Key ratios
Y/E December
CY11
CY12
CY13
CY14
15MFY16E FY17E
Valuation Ratio (x)
P/E (on FDEPS)
153.7
132.2
109.0
69.9
39.0
30.3
P/CEPS
114.9
105.4
82.0
51.5
28.8
23.7
P/BV
29.2
24.8
21.2
17.3
14.2
10.5
Dividend yield (%)
0.1
0.1
0.2
0.3
0.5
0.7
EV/Sales
7.3
6.5
6.1
4.7
3.1
2.8
EV/EBITDA
70.1
75.6
58.2
37.2
19.8
16.2
EV / Total Assets
16.5
14.2
12.1
10.4
9.4
7.2
Per Share Data (`)
EPS (Basic)
103.3
120.1
145.6
227.1
464.8
597.5
EPS (fully diluted)
103.3
120.1
145.6
227.1
464.8
597.5
Cash EPS
138.2
150.6
193.7
308.2
630.2
765.1
DPS
16.0
20.0
30.0
50.0
93.0
119.5
Book Value
543.4
640.2
749.9
918.4
1,272.7
1,730.4
Returns (%)
ROCE (Pre-tax)
26.5
20.6
19.8
25.1
39.8
39.9
Angel ROIC (Pre-tax)
50.5
28.5
24.7
28.6
41.3
45.8
ROE
20.6
18.5
19.2
24.5
36.2
34.3
Turnover ratios (x)
Asset Turnover (Gross Block)
5.8
4.2
3.0
2.8
3.6
3.1
Inventory / Sales (days)
27
28
28
27
28
28
Receivables (days)
22
25
27
23
26
26
Payables (days)
76
82
94
91
71
70
WC cycle (ex-cash) (days)
(26)
(29)
(38)
(40)
(16)
(16)
Solvency ratios (x)
Net debt to equity
(0.8)
(0.4)
(0.3)
(0.2)
(0.0)
(0.2)
Net debt to EBITDA
(1.9)
(1.4)
(0.8)
(0.4)
(0.1)
(0.3)
Interest Coverage (EBIT / Int.)
86.8
159.2
86.1
102.5
184.0
209.2
February 6, 2016
9
Eicher Motors | 4QFY2016 Result Update
Research Team Tel: 022 - 39357800
DISCLAIMER
Angel Broking Private Limited (hereinafter referred to as “Angel”) is a registered Member of National Stock Exchange of India Limited,
Bombay Stock Exchange Limited and Metropolitan Stock Exchange of India Limited. It is also registered as a Depository Participant with
CDSL and Portfolio Manager with SEBI. It also has registration with AMFI as a Mutual Fund Distributor. Angel Broking Private Limited is
a registered entity with SEBI for Research Analyst in terms of SEBI (Research Analyst) Regulations, 2014 vide registration number
INH000000164. Angel or its associates has not been debarred/ suspended by SEBI or any other regulatory authority for accessing
/dealing in securities Market. Angel or its associates including its relatives/analyst do not hold any financial interest/beneficial
ownership of more than 1% in the company covered by Analyst. Angel or its associates/analyst has not received any compensation /
managed or co-managed public offering of securities of the company covered by Analyst during the past twelve months. Angel/analyst
has not served as an officer, director or employee of company covered by Analyst and has not been engaged in market making activity
of the company covered by Analyst.
This document is solely for the personal information of the recipient, and must not be singularly used as the basis of any investment
decision. Nothing in this document should be construed as investment or financial advice. Each recipient of this document should
make such investigations as they deem necessary to arrive at an independent evaluation of an investment in the securities of the
companies referred to in this document (including the merits and risks involved), and should consult their own advisors to determine
the merits and risks of such an investment.
Reports based on technical and derivative analysis center on studying charts of a stock's price movement, outstanding positions and
trading volume, as opposed to focusing on a company's fundamentals and, as such, may not match with a report on a company's
fundamentals.
The information in this document has been printed on the basis of publicly available information, internal data and other reliable
sources believed to be true, but we do not represent that it is accurate or complete and it should not be relied on as such, as this
document is for general guidance only. Angel Broking Pvt. Limited or any of its affiliates/ group companies shall not be in any way
responsible for any loss or damage that may arise to any person from any inadvertent error in the information contained in this report.
Angel Broking Pvt. Limited has not independently verified all the information contained within this document. Accordingly, we cannot
testify, nor make any representation or warranty, express or implied, to the accuracy, contents or data contained within this document.
While Angel Broking Pvt. Limited endeavors to update on a reasonable basis the information discussed in this material, there may be
regulatory, compliance, or other reasons that prevent us from doing so.
This document is being supplied to you solely for your information, and its contents, information or data may not be reproduced,
redistributed or passed on, directly or indirectly.
Neither Angel Broking Pvt. Limited, nor its directors, employees or affiliates shall be liable for any loss or damage that may arise from
or in connection with the use of this information.
Note: Please refer to the important ‘Stock Holding Disclosure' report on the Angel website (Research Section). Also, please refer to the
latest update on respective stocks for the disclosure status in respect of those stocks. Angel Broking Pvt. Limited and its affiliates may
have investment positions in the stocks recommended in this report.
Disclosure of Interest Statement
Eicher Motors
1. Analyst ownership of the stock
No
2. Angel and its Group companies ownership of the stock
No
3. Angel and its Group companies' Directors ownership of the stock
No
4. Broking relationship with company covered
No
Note: We have not considered any Exposure below ` 1 lakh for Angel, its Group companies and Directors
Ratings (Based on expected returns
Buy (> 15%)
Accumulate (5% to 15%)
Neutral (-5 to 5%)
over 12 months investment period):
Reduce (-5% to -15%)
Sell (< -15)
February 6, 2016
10