2QFY2016 Result Update | Pharmaceutical
November 16, 2015
Dr Reddy’s Laboratories
BUY
CMP
`3,384
Performance Highlights
Target Price
`3,933
Y/E March (` cr)
2QFY2016 1QFY2016
% chg (qoq) 2QFY2015
% chg (yoy)
Investment Period
12 Months
Net sales
3,989
3,758
6.2
3,588
11.2
Gross profit
2,674
2,522
6.0
2,286
17.0
Stock Info
Operating profit
1,121
986
13.7
807
38.8
Sector
Pharmaceutical
Adj. net profit
722
625
15.5
574
25.7
Market Cap (` cr)
57,735
Source: Company, Angel Research
Net Debt (` cr)
(396)
For 2QFY2016, Dr Reddy’s Laboratories (DRL) posted in line sales while the net
Beta
0.8
profit growth exceeded our estimates. The company posted an 11.2% yoy growth
52 Week High / Low
4,383/3,010
in sales to `3,989cr V/s `4,000cr expected and V/s `3,588cr in 2QFY2015,
Avg. Daily Volume
26,988
mainly driven by global generics. On the operating front, the EBIT margin came
Face Value (`)
5
in at 22.4% V/s 18.7% expected and V/s 17.3% in 2QFY2015, driven by the
BSE Sensex
25,611
expansion in gross margins (285bps) and SG&A and R&D expenditure growing
Nifty
7,762
only moderaly, which is by 3.6% and 8.8% yoy, respectively. Thus, the net profit
Reuters Code
REDY.BO
came in at `722cr V/s `631cr expected and V/s `574cr in 2QFY2015, a yoy growth
Bloomberg Code
DRRD@IN
of 25.7%. After the warning letters for its three facilities, the stock has corrected,
making valuations attractive. Thus we recommend a Buy rating on the stock.
Shareholding Pattern (%)
Results better on operating front: The company posted an 11.2% growth in sales
Promoters
25.5
to `3989cr V/s `4,000cr expected and V/s `3,588cr in 2QFY2015, mainly driven
MF / Banks / Indian Fls
8.8
by global generics. Global generics (`3,276.8cr) posted a growth of 15% yoy,
FII / NRIs / OCBs
58.0
while PSAI (`591.8cr) posted a dip of 7% yoy. In global generics, the key markets-
USA, Europe, India and Emerging markets, posted a growth of 32%, 65%, 14%
Indian Public / Others
7.7
and -22% yoy, respectively. On the operating front, the EBIT margin came in at
22.4% V/s 18.7% expected and V/s 17.3% in 2QFY2015, driven by expansion in
Abs. (%)
3m 1yr
3yr
gross margins (285bps) and moderate growth in SG&A and R&D expenditure,
Sensex
(7.0)
(8.3)
37.6
which rose by 3.6% and 8.8% yoy, respectively. Thus, the net profit came in at
Dr Reddy
(21.1)
(2.6)
92.8
`722cr V/s `631cr expected and V/s `574cr in 2QFY2015, a yoy growth of 25.7%.
Outlook and valuation: We expect net sales to grow at a CAGR of 14.9% to
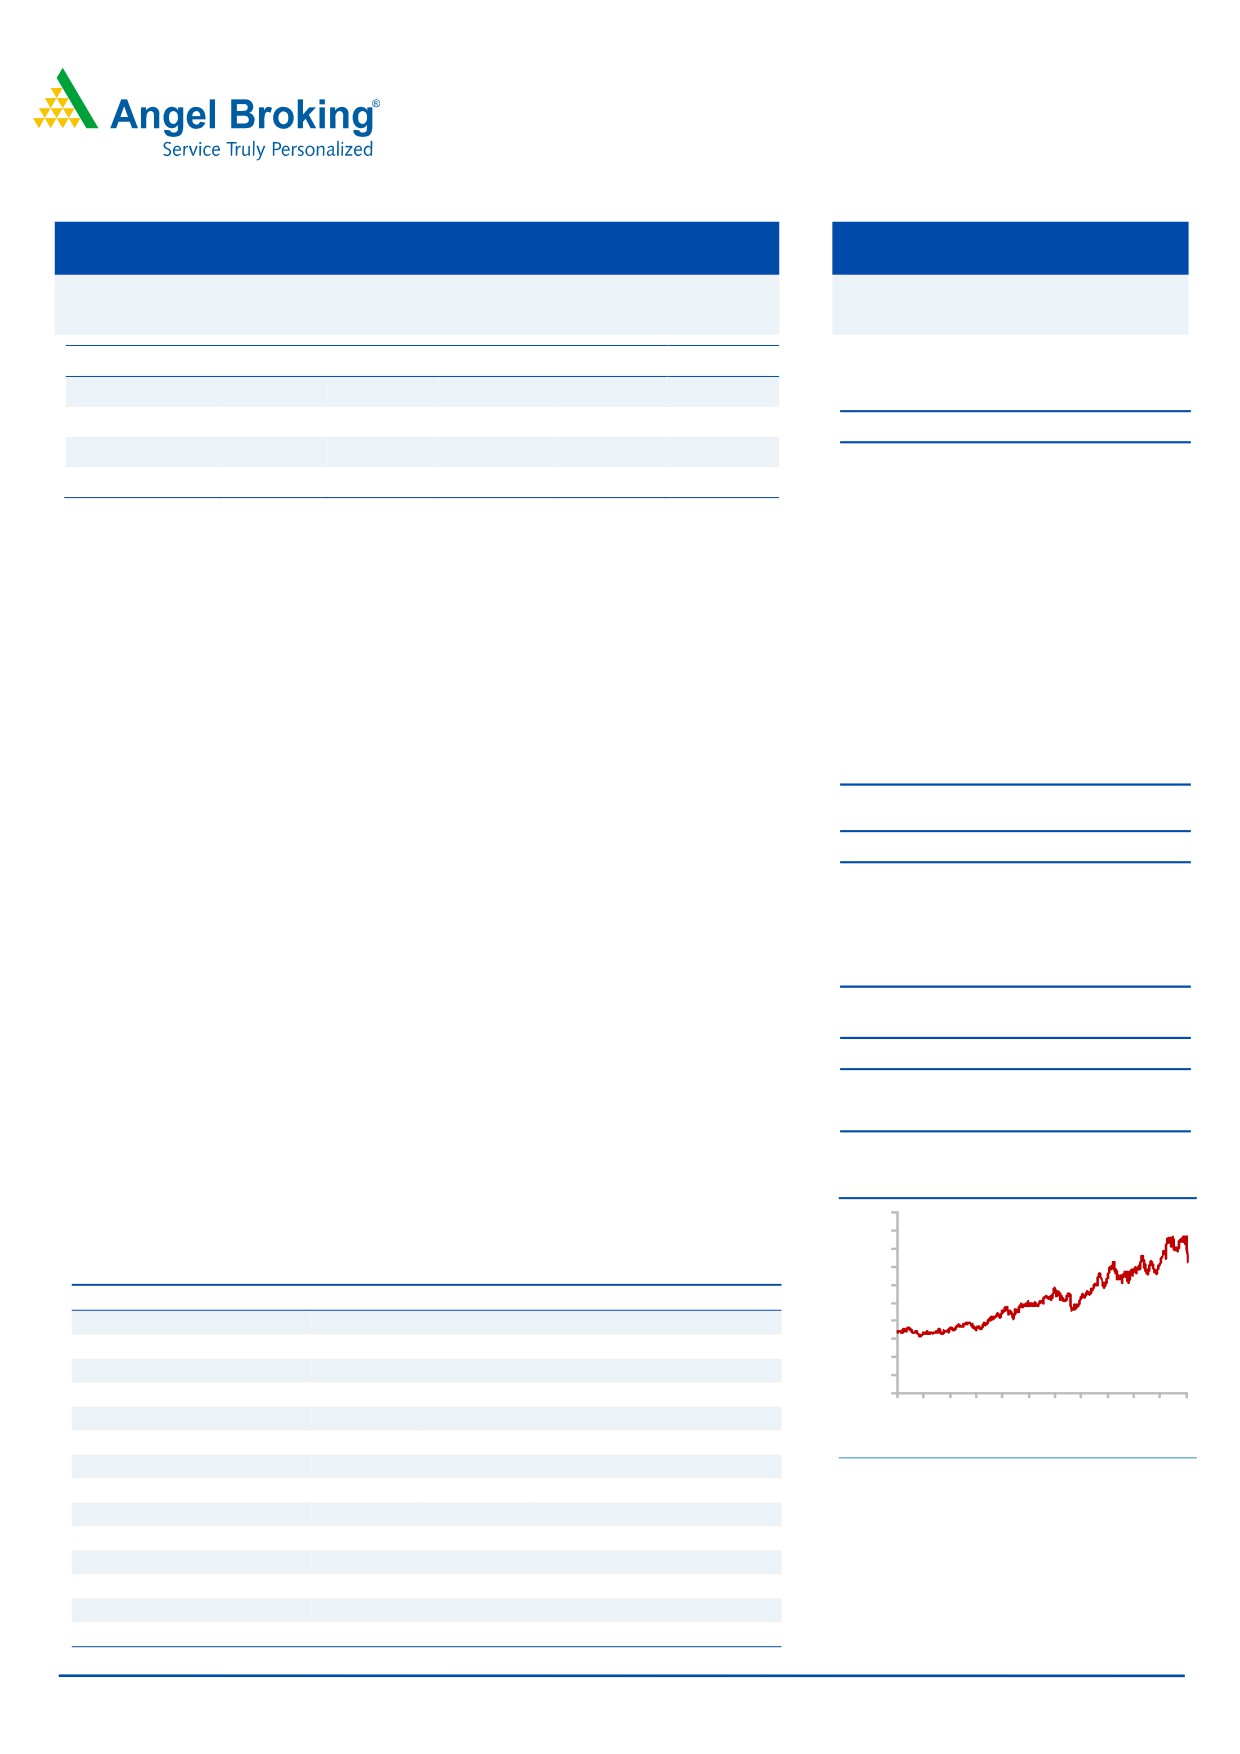
3-year Daily Price Chart
`19,575cr and adjusted EPS to record a
17.2% CAGR to
`178.8 over
5,000
FY2015-17E. On back of valuations, we recommend a Buy rating on the stock.
4,500
4,000
3,500
Key financials (IFRS Consolidated)
3,000
Y/E March (` cr)
FY2014
FY2015
FY2016E
FY2017E
2,500
2,000
Net sales
13,217
14,819
16,838
19,575
1,500
% chg
13.7
12.1
13.6
16.3
1,000
Net profit
2,151
2,218
2,585
3,046
500
% chg
28.2
3.1
16.5
17.9
0
2
2
2
3
3
3
4
4
4
5
5
5
1
1
1
1
Adj net profit
2,151
2,218
2,585
3,046
1r
-
1
r
1
-
1
r
1
-
1
r
1
-
1
a
u
v
a
u
v
a
u
v
a
u
v
J
o
J
o
J
o
J
o
% chg
22.9
3.1
16.5
17.9
M
N
M
N
M
N
M
N
Adj. EPS (`)
126.7
130.2
151.7
178.8
Source: Company, Angel Research
EBITDA margin (%)
23.6
22.2
23.0
23.1
P/E (x)
26.7
26.0
22.3
18.9
RoE (%)
26.3
21.9
21.1
20.8
RoCE (%)
20.2
18.1
18.8
19.5
P/BV (x)
6.3
5.2
4.3
3.6
Sarabjit Kour Nangra
EV/Sales (x)
4.4
3.9
3.4
2.8
+91 2 39357600 Ext: 6806
EV/EBITDA (x)
18.7
17.4
14.7
12.3
Source: Company, Angel Research; Note: CMP as of November 13, 2015
Please refer to important disclosures at the end of this report
1
Dr. Reddy’s Laboratories | 2QFY2016 Result Update
Exhibit 1: 2QFY2016 performance (IFRS, consolidated)
Y/E March (` cr)
2QFY2016
1QFY2016
% chg (qoq) 2QFY2015
% chg (yoy) 1HFY2016
1HFY2015
% chg
Net sales
3,989
3,758
6.2
3,588
11.2
7,747
7,105
9.0
Other income
10
34
(70)
69
(84.8)
45
135
(67.0)
Total income
3,999
3,792
5.5
3,657
9.4
7,791
7,240
7.6
Gross profit
2,694
2,522
6.8
2,286
17.8
5,215
4,566
14.2
Gross margin (%)
67.5
67.1
63.7
67.3
64.3
SG&A expenses
1,106
1,097
0.8
1,067
3.6
2,203
2,135
3.2
R&D expenses
447
439
2.0
411
8.8
886
799
10.9
EBDITA
1,140
986
15.7
807
41.3
2,126
1,632
30.3
EBDITA (%)
28.6
26.2
-
22.5
27.4
23.0
-
Depreciation
247
227
8.7
187.2
31.7
473.4
382.9
(51.1)
Interest
-
-
-
-
-
-
-
PBT
904
793
14.1
689
31.3
1,697
1,384
(50.2)
Tax
188
172
9.2
120
57.1
360
270
33.3
Net Profit
716
621
15.4
569
25.9
1,337
1,114
20.0
Share of profit/ (loss) in associates
4.4
4.4
0.0
5.1
8.8
10.6
Reported net profit before exceptional
722
626
15.4
574
25.7
1,348
1,125
19.8
Exceptional items (loss) /profit
-
-
-
-
-
Reported PAT
722
625
15.5
574
25.7
1,348
1,125
19.8
Adj.Net Profit
722
625
15.5
574
25.7
1,348
1,125
19.8
EPS (`)
42.5
36.8
33.8
79.4
66.2
Source: Company, Angel Research
Exhibit 2: Actual vs Estimates
(` cr)
Actual
Estimates
Variation (%)
Net sales
3,989
4,000
(0.3)
Other income
10
69
(84.8)
Operating profit
1,121
746
50.1
Tax
188
184
2.1
Adj. Net profit
722
631
14.4
Source: Company, Angel Research
Revenue just in line with expectation: The company posted an 11.2% growth in
sales to `3989cr V/s `4,000cr expected and V/s `3,588cr in 2QFY2015, mainly
driven by global generics. Global generics (`3,276.8cr) posted a growth of 15%
yoy, while PSAI (`591.8cr) posted a dip of 7% yoy. In global generics, the key
markets- USA, Europe, India and Emerging markets, posted a growth of 32%,
65%, 14% and -22% yoy, respectively.
In the generic segment (accounting for 82% of sales), the US (`1,856cr) grew by
32% yoy, Europe
(`212cr) grew by
65.0% yoy, India
(`546cr) grew by
14.0% yoy, while Emerging Markets (including Russia & CIS; `662cr) de-grew by
22% yoy. Russia & CIS (~`390cr) dipped by 18.6% yoy. Revenue from Russia
declined primarily on account of the Rouble’s depreciation. In constant currency
terms, the growth was of ~11% yoy for 2QFY2016. Revenue from Rest of the
World (RoW) territories, at ~`270cr, recorded a yoy de-growth of 24%.
November 16, 2015
2
Dr. Reddy’s Laboratories | 2QFY2016 Result Update
In the PSAI segment (15% of sales) - US de-grew by 47% and ROW grew by 26%.
Europe de-grew by 5% while India dipped by 19% yoy, during the quarter.
Proprietary Products & Others (`120cr) posted a yoy growth of 37%.
DRL filed 2 abbreviated new drug applications (ANDAs) during the quarter. The
company has 76 ANDAs pending for approval with the USFDA, of which, 50 are
Para IVs and 18 are FTFs.
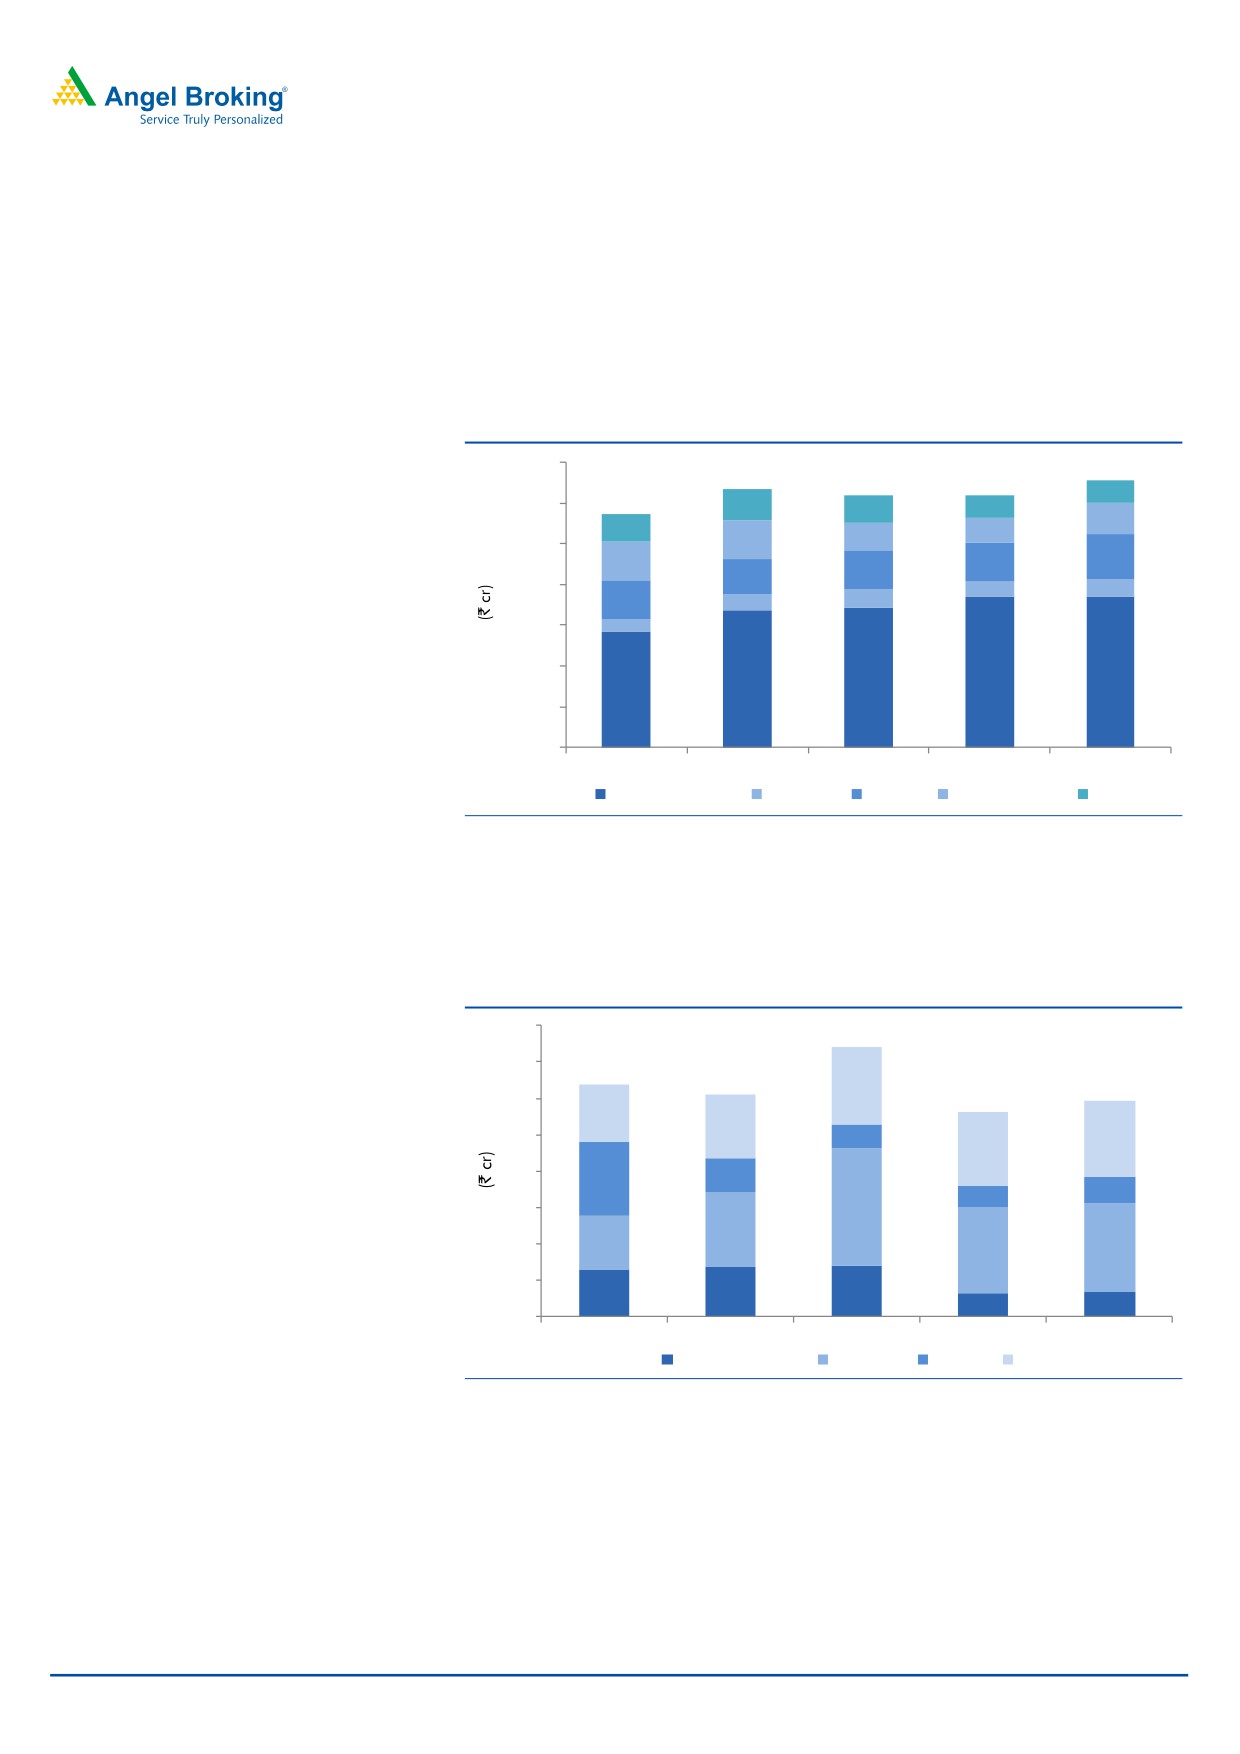
Exhibit 3: Trend in Global generics
3,500
272
3,000
383
347
270
390
329
310
478
329
2,500
479
476
546
474
433
2,000
191
212
480
195
234
1,500
143
1,000
1,852
1,856
1,682
1,715
1,429
500
0
2QFY2015
3QFY2015
4QFY2015
1QFY2016
2QFY2016
North America
Europe
India
Russia & CIS
Others
Source: Company, Angel Research
In the PSAI segment (15% of sales) - US de-grew by 47% and ROW grew by 26%.
Europe de-grew by 5% while India dipped by 19% yoy, during the quarter.
Proprietary Products & Others (`120cr) posted a yoy growth of 37%.
Exhibit 4: PSAI trend
800
700
212
600
158
175
500
66.8
208
201
400
202
95
72
59
300
322
206
200
149
235
243
100
130
136
140
66
69
0
2QFY2015
3QFY2015
4QFY2015
1QFY2016
2QFY2016
North America
Europe
India
Others
Source: Company, Angel Research
November 16, 2015
3
Dr. Reddy’s Laboratories | 2QFY2016 Result Update
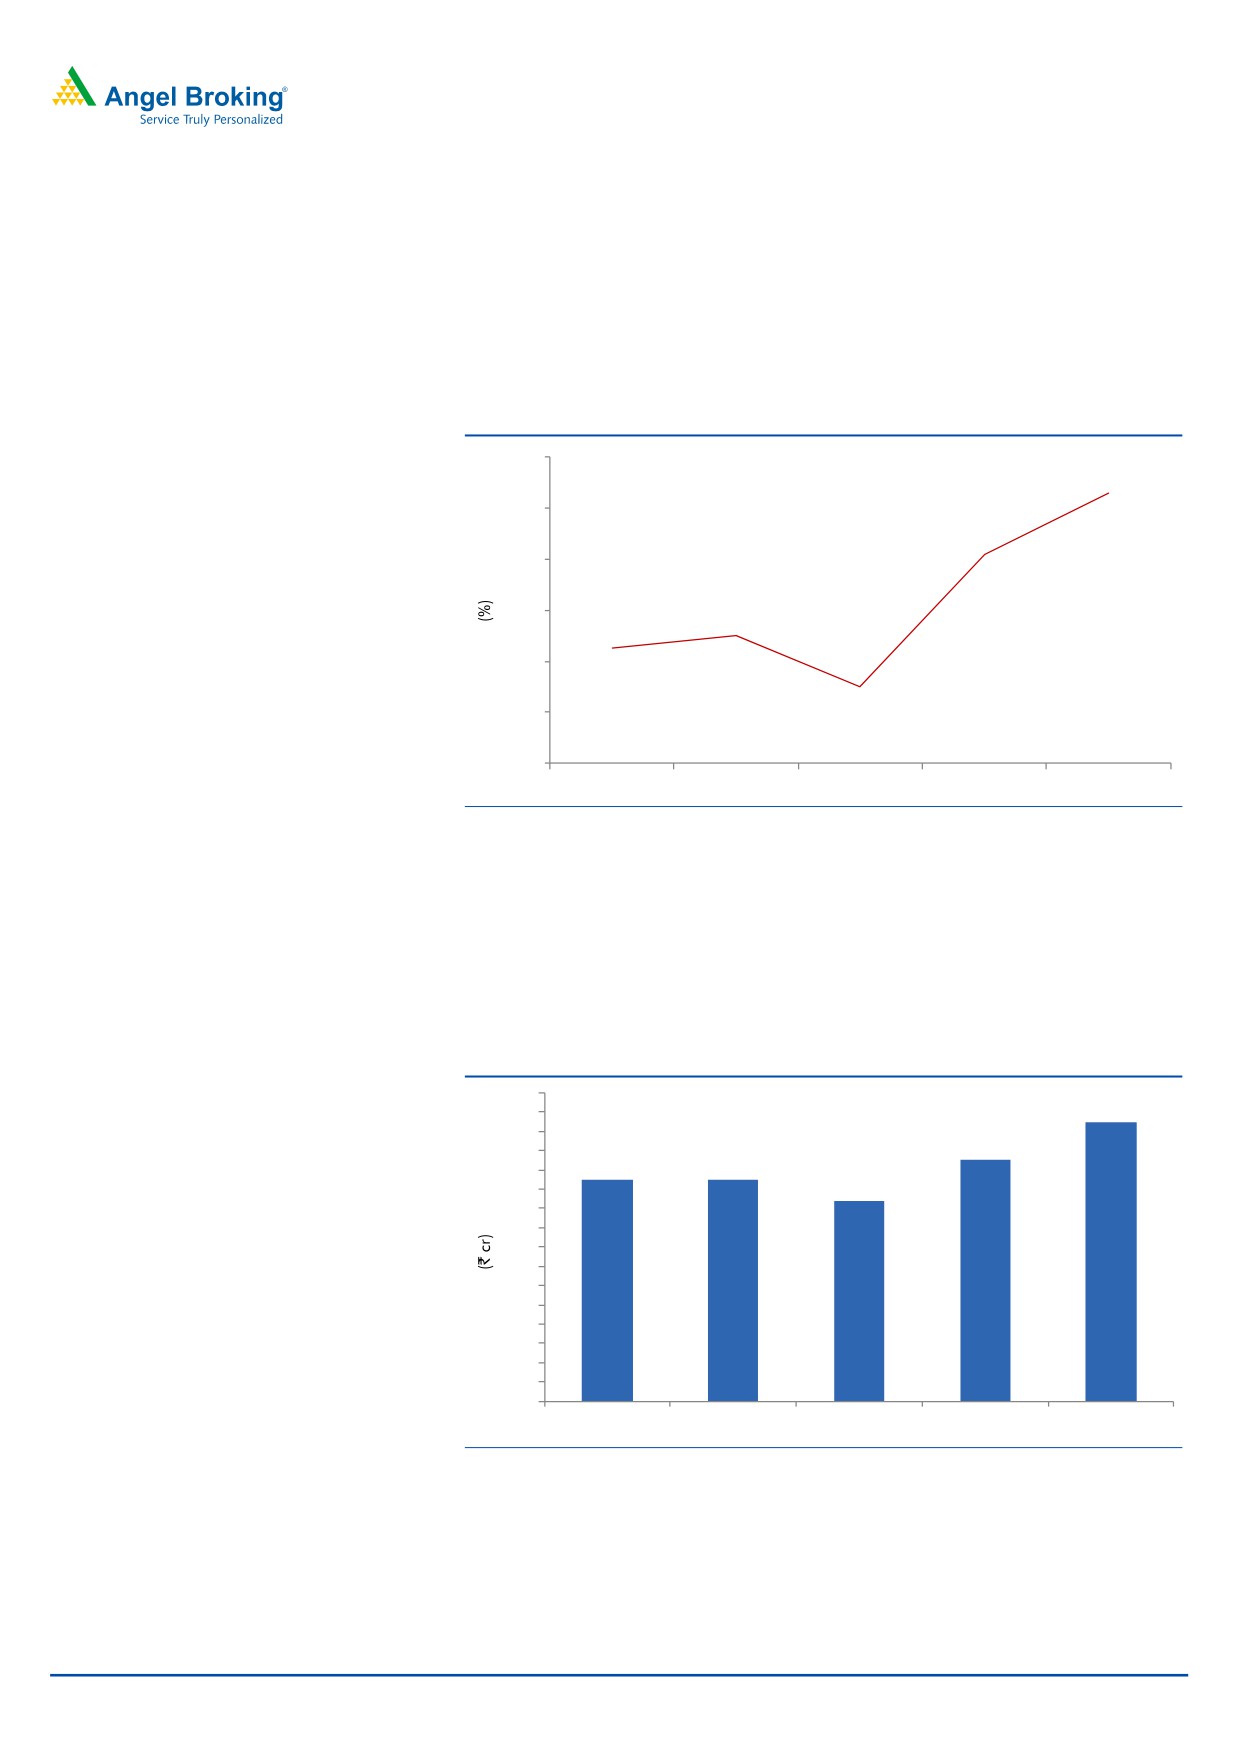
EBITDA expands yoy: On the operating front, the EBITDA margin came in at 28.6%
V/s 24.8% expected V/s 22.5% in 2QFY2015, driven by the expansion in gross
margins (285bps) and moderate growth in SG&A and R&D expenditure, which
rose by 3.6% and 8.8% yoy, respectively. The expansion in gross margins is on
back of improved sales mix (with formulations at 82% of sales in 2QFY2016 V/s
80% in 2QFY2015).
Exhibit 5: EBITDA margin trend (%)
30.0
28.6
28.0
26.2
26.0
24.0
23.0
22.5
22.0
21.0
20.0
18.0
2QFY2015
3QFY2015
4QFY2015
1QFY2016
2QFY2016
Source: Company, Angel Research
Net profit lower than expected: Consequently, the net profit came in at `722cr
V/s `631cr expected and V/s `574cr in 2QFY2015, a yoy growth of 25.7%.
Other income during the quarter came in at `10cr V/s `69cr in 2QFY2015,
which led the PAT to grow at a lower rate than the operating profit growth rate
during the period.
Exhibit 6: Adjusted net profit trend
800
722
750
700
626
650
574
575
600
519
550
500
450
400
350
300
250
200
150
100
50
0
2QFY2015
3QFY2015
4QFY2015
1QFY2016
2QFY2016
Source: Company, Angel Research
November 16, 2015
4
Dr. Reddy’s Laboratories | 2QFY2016 Result Update
Concall takeaways
DRL spends 12-15% of its R&D expenditure on biosimilars.
Russia business is to see revival in 2HFY2016.
Improvement in SG&A is likely to be sustainable.
Dr Reddy’s has received a warning letter issued by the USFDA, relating to its three
plants Srikakulam, and Miryalaguda, Telegana along with the oncology
formulation business at Duvvada. The company has said that these facilities
contribute around 10-12% of sales of the company. Though it cannot be ruled but
probability of adverse action at Bachupally plant (which got inspected by USFDA
in June 2015 with some 483 observations) is low now as it did not receive
warning letter along with above mentioned facilities. This is a key facility for DRRD
as it contributes >50% to current US sales. Moreover, these observations are
minor.
USFDA needs DRL to focus on third party verification and implementation across
the manufacturing network. The company has not done any third party verification
till date.
DRL plans to arrest the impact partially by initiating site transfers from its API
plants (though this may lead to delay of 6-9 months). DRL generates ~20% of its
US sales currently from Oncology segment but exposure to current sales from
Duvvada facility is limited. This is because most of the supply comes from third
party sources.
The Gleevec API is outsourced from the third party and the company is expected to
launch this product post Sun Pharma’s exclusivity.
Investment arguments
Robust growth in the US, going ahead: After attaining a critical mass
(US$1,113mn in FY2015), DRL aims to scale up its business to the next orbit in the
US market on the back of a strong product pipeline (76 ANDAs are pending
approval, of which, 50 are Para IVs and 18 are FTFs). The Management has
guided for a robust growth in the US over the medium term, driven by introduction
of new products, some of which are also Para IV opportunities. On back of the
import alert on the three facilities of the company, on worst case scenario, we
expect the ex-exclusivity US sales to post a CAGR of ~15.7% during FY2015-17E.
Domestic back in focus: DRL reported a 14.0% yoy growth in FY2015. The
Management expects the company’s performance to rebound and targets to
achieve an above industry growth rate going ahead, driven by a) field force
expansion and improvement in productivity, b) new product launches (including
biosimilars) and c) focus on brand building. In 4QFY2015, DRL had acquired
UCB’s India portfolio and has completed the integration process of these brands in
1QFY2016. UCB’s India business had registered ~`150cr sales in CY2014 and
has a branded portfolio of
21 products focusing on Allergy, Respiratory,
Dermatology and Pediatric space. Thus, we expect sales in India to post a CAGR of
~20.1% over FY2015-17E.
November 16, 2015
5
Dr. Reddy’s Laboratories | 2QFY2016 Result Update
Valuation: We expect net sales to grow at a CAGR of 14.9% to `19,575cr and
adjusted EPS to record a 17.2% CAGR to `178.8 over FY2015-17E. The stock has
seen severe beating post the import alert from the USFDA. Considering the
attractive valuations, we recommend a Buy rating on the stock.
Exhibit 7: Key assumptions
FY2016E
FY2017E
PSAI segment growth (%)
13.4
13.7
Generics segment growth (%)
26.4
18.2
Operating margin (%)
25.0
23.1
Capex (` cr)
1000
1000
Source: Company, Angel Research
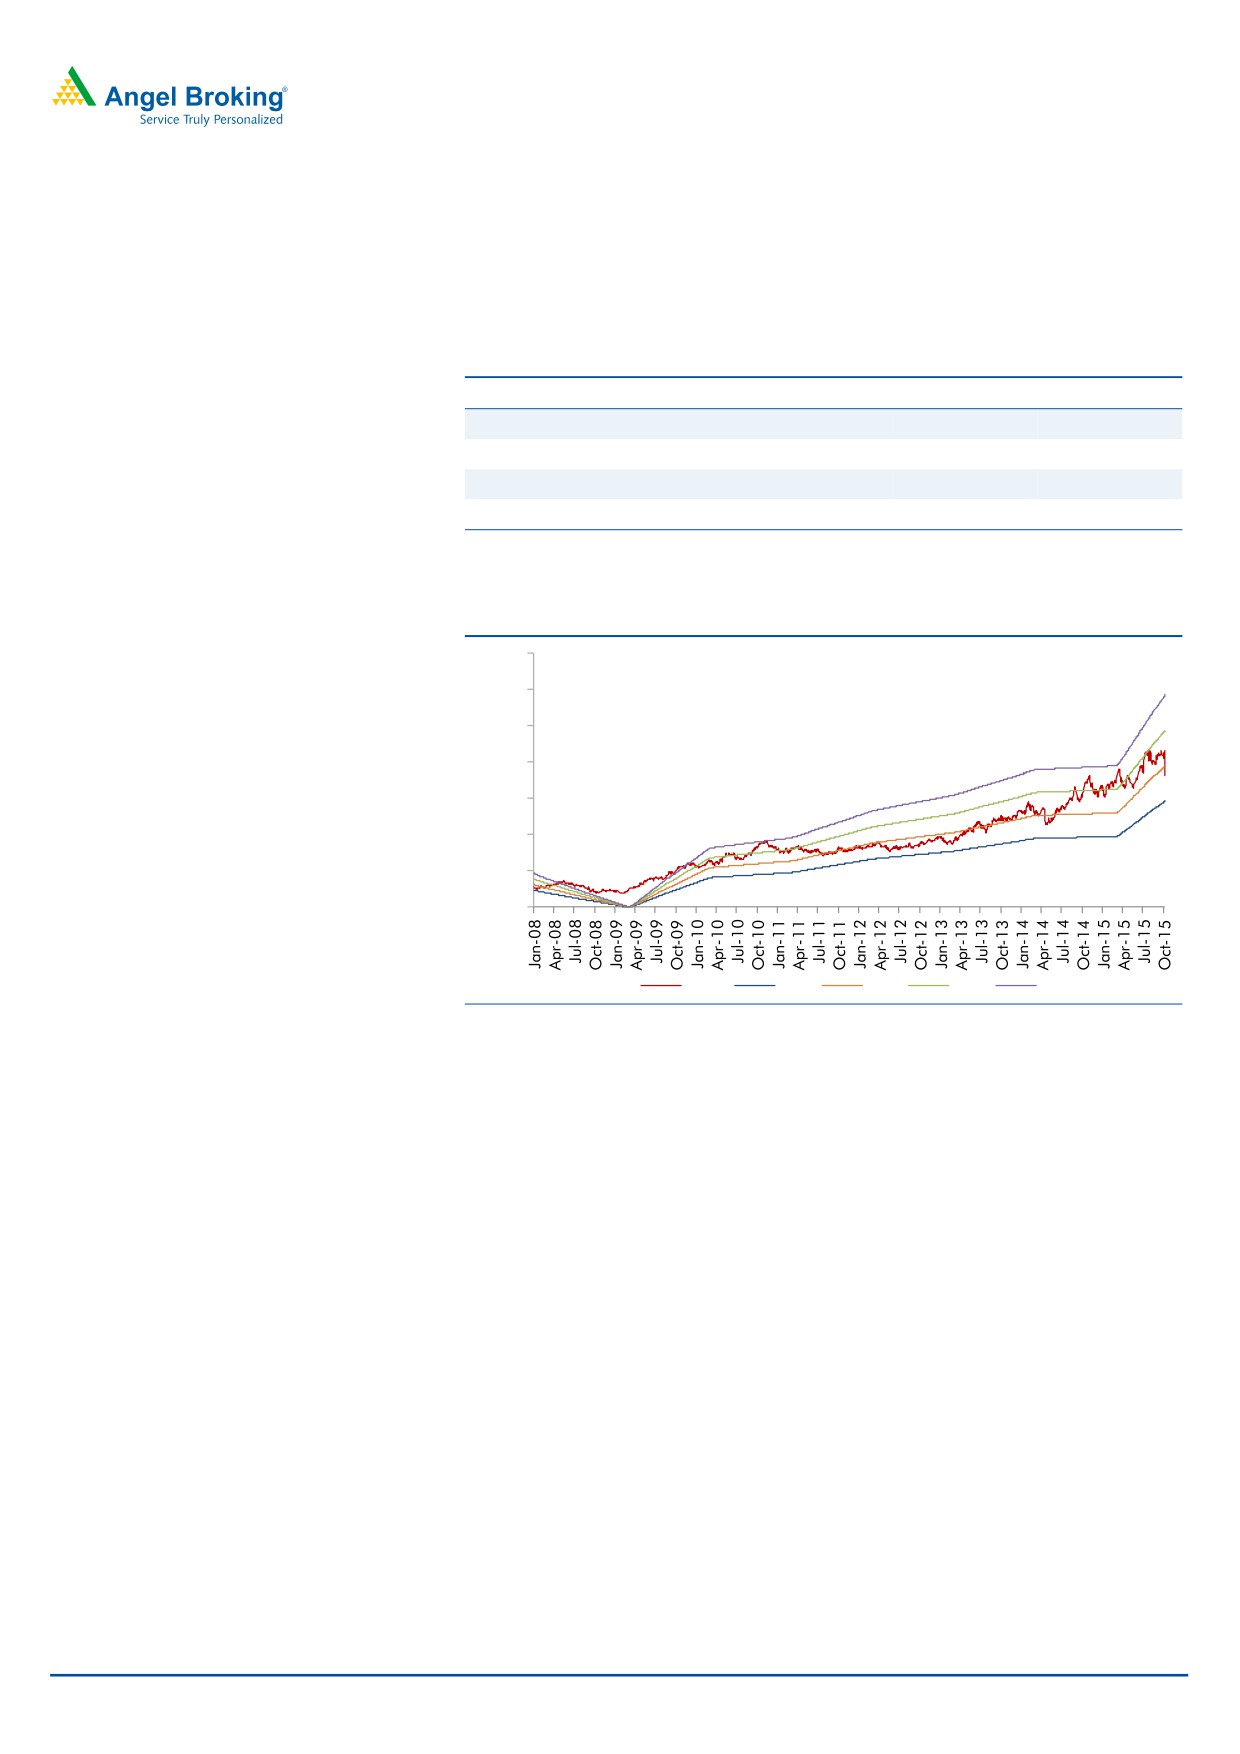
Exhibit 8: One-year forward PE chart
7,000
6,000
5,000
4,000
3,000
2,000
1,000
0
Price
15x
20x
25x
30x
Source: Company, Angel Research
November 16, 2015
6
Dr. Reddy’s Laboratories | 2QFY2016 Result Update
Exhibit 9: Recommendation summary
Company
Reco.
CMP Tgt Price Upside
FY2017E
FY15-17E
FY2017E
(`)
(`)
(%)
PE
EV/Sales
EV/EBITDA
CAGR in EPS
RoCE
RoE
(x)
(x)
(x)
(%)
(%)
(%)
Alembic Pharma
Neutral
662
-
-
27.7
3.9
19.5
26.1
30.3
30.2
Aurobindo Pharma Accumulate
830
872
5.1
19.0
3.1
13.3
16.3
23.4
30.2
Cadila Healthcare Neutral
413
-
-
23.5
3.5
16.1
24.6
25.2
29.0
Cipla
Neutral
619
-
-
21.4
2.9
15.3
21.4
17.1
16.8
Dr Reddy's
Buy
3,384
3,933
16.2
18.9
2.8
14.7
17.2
19.1
20.6
Dishman Pharma Neutral
381
-
-
17.6
1.7
8.2
20.4
11.7
11.7
GSK Pharma*
Neutral
3,152
-
-
46.2
8.0
36.4
6.6
33.7
34.3
Indoco Remedies
Neutral
300
-
-
22.1
2.4
13.1
23.0
19.7
19.7
Ipca labs
Buy
719
900
25.1
25.7
2.6
13.7
17.9
11.8
14.0
Lupin
Neutral
1,777
-
-
26.0
4.5
16.6
13.1
29.6
24.7
Sanofi India*
Neutral
4,586
-
-
30.3
4.0
19.0
33.1
27.9
25.5
Sun Pharma
Buy
742
950
28.1
27.6
4.8
15.6
8.4
15.8
16.6
Source: Company, Angel Research; Note: *December year ending
Company Background
Established in
1984, Dr Reddy's Laboratories is an integrated global
pharmaceutical company, through its three businesses - Pharmaceutical Services
and Active Ingredients, Global Generics and Proprietary Products. The key
therapeutic focus is on gastro-intestinal, cardiovascular, diabetology, oncology,
pain management, anti-infective and paediatrics. The key markets for DRL include
India, USA, Russia & CIS, and Germany.
November 16, 2015
7
Dr. Reddy’s Laboratories | 2QFY2016 Result Update
Profit & loss statement (IFRS Consolidated)
Y/E March (` cr)
FY2012
FY2013
FY2014
FY2015
FY2016E
FY2017E
Net sales
9,674
11,627
13,217
14,819
16,838
19,575
Other operating income
76.5
247.9
141.6
91.7
91.7
91.7
Total operating income
9,750
11,875
13,359
14,911
16,930
19,666
% chg
29.2
21.8
12.5
11.6
13.5
16.2
Total expenditure
7,076
8,951
10,096
11,535
12,627
15,061
Cost of revenues
3,598
4,825
4,977
5,531
5,808
7,133.31
SG&A expenses
2,887
3,358
3,878
4,259
4,833
5,618
R&D expenses
591.1
767.3
1,240.2
1,744.9
1,986.9
2,309.8
EBITDA
2,598
2,676
3,121
3,284
4,211
4,514
% chg
65.9
3.0
16.6
5.2
28.2
7.2
(% of Net Sales)
26.9
23.0
23.6
22.2
25.0
23.1
Depreciation & amortisation
745.4
743.7
659.8
747.4
927.4
990.1
EBIT
1,853
1,932
2,462
2,537
3,283
3,523
% chg
60.9
4.3
27.4
3.1
29.4
7.3
(% of Net Sales)
19.2
16.6
18.6
17.1
19.5
18.0
Interest & other charges
(16.0)
-
-
-
-
-
Other Income
-
46.0
40.0
168.2
168.2
168.2
(% of PBT)
-
2.1
1.5
6.0
4.7
4.4
Share in profit of associates
5.4
10.4
17.4
19.5
19.5
19.5
Recurring PBT
1,951
2,237
2,661
2,816
3,563
3,803
% chg
61.5
14.7
19.0
5.9
26.5
6.7
Extraordinary expense/(Inc.)
104.0
68.8
-
-
-
-
PBT (reported)
1,846.6
2,167.7
2,660.6
2,816.3
3,562.9
3,802.8
Tax
420.4
490.0
509.4
598.4
708.7
756.7
(% of PBT)
22.8
22.6
19.1
21.2
19.9
19.9
PAT (reported)
1,426.2
1,677.7
2,151.2
2,217.9
2,854.2
3,046.2
Add: Share of earnings of asso.
-
-
-
-
-
-
Less: Minority interest (MI)
-
-
-
-
-
-
Exceptional items
-
-
-
-
-
-
PAT after MI (reported)
1,426.2
1,677.7
2,151.2
2,217.9
2,854.2
3,046.2
ADJ. PAT
1,496.0
1,750.0
2,151.2
2,217.9
2,854.2
3,046.2
% chg
39.0
17.0
22.9
3.1
28.7
6.7
(% of Net Sales)
14.7
14.4
16.3
15.0
17.0
15.6
Basic EPS (`)
88.2
103.1
126.7
130.2
167.5
178.8
Fully Diluted EPS (`)
88.2
103.1
126.7
130.2
167.5
178.8
% chg
38.4
16.8
22.9
2.7
23.3
18.1
November 16, 2015
8
Dr. Reddy’s Laboratories | 2QFY2016 Result Update
Balance sheet (IFRS Consolidated)
Y/E March (` cr)
FY2012
FY2013
FY2014
FY2015
FY2016E FY2017E
SOURCES OF FUNDS
Equity share capital
84.8
84.9
84.9
85.2
85.2
85.2
Preference Capital
-
-
-
-
-
-
Reserves & surplus
5,660
7,224
8,995
11,045
13,500
16,148
Shareholders funds
5,744
7,309
9,080
11,130
13,586
16,233
Minority Interest
-
-
-
-
-
-
Total loans
4,831.2
3,676.0
4,474.2
3,954.3
3,954.3
3,954.3
Deferred tax liability
83.3
83.3
(192.9)
(401.3)
(401.3)
(401.3)
Total liabilities
10,659
11,068
13,361
14,683
17,139
19,786
APPLICATION OF FUNDS
Net fixed assets
3,325
3,781
3,945
4,314
5,314
6,314
Goodwill /other intangibles
1,353
1,402
1,470
1,643
1,643
1,643
Capital Work-in-Progress
520.8
495.2
495.2
495.2
495.2
495.2
Investments
1,077
1,764
2,589
3,811
3,811
3,811
Current Assets
6,995
6,875
7,866
8,558
10,511
12,909
Cash
737.9
513.6
845
539
1,427
2,355
Loans & Advances
580.4
697.6
793.0
889.1
1,010.3
1,174.5
Other
5,677
5,664
6,228
7,129
8,074
9,379
Current liabilities
2,613
3,252
3,006
4,214
4,639
5,389
Net Current Assets
4,382
3,623
4,860
4,344
5,873
7,520
Other Assets
-
-
76
Total Assets
10,659
11,068
13,361
14,683
17,139
19,786
November 16, 2015
9
Dr. Reddy’s Laboratories | 2QFY2016 Result Update
Cash flow statement (IFRS Consolidated)
Y/E March (` cr)
FY2012
FY2013
FY2014
FY2015
FY2016E FY2017E
Profit before tax
1,951
2,237
2,661
2,816
3,563
3,803
Depreciation
745
744
660
747
927
990
(Inc)/Dec in Working Capital
(1,661)
535
(906)
211
(641)
(719)
Less: Other income
-
46
40
168
168
168
Direct taxes paid
420
490
509
598
709
757
Cash Flow from Operations
614
2,980
1,865
3,008
2,973
3,149
(Inc.)/Dec.in Fixed Assets
(881)
(431)
(164)
(369)
(1,000)
(1,000)
(Inc.)/Dec. in Investments
(1,046)
687
824
1,222
-
-
Other income
-
46
40
168
168
168
Cash Flow from Investing
(1,928)
302
701
1,021
(832)
(832)
Issue of Equity
0
0
-
0
-
-
Inc./(Dec.) in loans
2,474
(1,155)
798
(520)
-
-
Dividend Paid (Incl. Tax)
259
298
358
399
399
399
Others
(1,255)
(2,649)
(3,390)
(4,214)
(1,652)
(1,788)
Cash Flow from Financing
1,478
(3,506)
(2,234)
(4,335)
(1,253)
(1,389)
Inc./(Dec.) in Cash
165
(224)
331
(306)
888
928
Opening Cash balances
573
738
514
845
539
1,427
Closing Cash balances
738
514
845
539
1,427
2,355
November 16, 2015
10
Dr. Reddy’s Laboratories | 2QFY2016 Result Update
Key ratios
Y/E March
FY2012
FY2013
FY2014
FY2015
FY2016E
FY2017E
Valuation Ratio (x)
P/E (on FDEPS)
38.4
32.8
26.7
26.0
20.2
18.9
P/CEPS
26.4
23.7
20.4
19.4
15.2
14.3
P/BV
10.0
7.9
6.3
5.2
4.2
3.6
Dividend yield (%)
0.4
0.4
0.4
0.4
0.4
0.4
EV/Sales
6.2
5.1
4.4
3.9
3.3
2.8
EV/EBITDA
23.3
22.0
18.7
17.4
13.4
12.3
EV / Total Assets
5.7
5.3
4.4
3.9
3.3
2.8
Per Share Data (`)
EPS (Basic)
88.2
103.1
126.7
130.2
167.5
178.8
EPS (fully diluted)
88.2
103.1
126.7
130.2
167.5
178.8
Cash EPS
128.0
142.6
165.5
174.0
222.0
236.9
DPS
14.0
15.0
15.0
15.0
15.0
15.0
Book Value
338.7
430.4
534.7
653.3
797.4
952.8
Dupont Analysis
EBIT margin
19.2
16.6
18.6
17.1
19.5
18.0
Tax retention ratio
77.2
77.4
80.9
78.8
80.1
80.1
Asset turnover (x)
1.2
1.2
1.2
1.1
1.1
1.2
ROIC (Post-tax)
17.5
14.9
17.4
15.1
17.7
17.1
Cost of Debt (Post Tax)
0.0
0.0
0.0
0.0
0.0
0.0
Leverage (x)
0.6
0.6
0.4
0.4
0.2
0.1
Operating ROE
27.2
23.5
24.7
20.4
22.1
19.5
Returns (%)
ROCE (Pre-tax)
20.9
17.8
20.2
18.1
20.6
19.1
Angel ROIC (Pre-tax)
29.6
23.1
25.6
22.5
25.7
24.4
ROE
28.9
26.8
26.3
21.9
23.1
20.4
Turnover ratios (x)
Asset Turnover (Gross Block)
3.4
3.3
3.5
3.6
3.5
3.4
Inventory / Sales (days)
66
63
62
61
66
69
Receivables (days)
80
88
89
90
95
101
Payables (days)
46
44
40
43
43
42
WC cycle (ex-cash) (days)
105
104
97
96
89
89
Solvency ratios (x)
Net debt to equity
0.7
0.4
0.4
0.3
0.2
0.1
Net debt to EBITDA
1.6
1.2
1.2
1.0
0.6
0.4
Interest Coverage (EBIT / Int.)
-
-
-
-
-
-
November 16, 2015
11
Dr. Reddy’s Laboratories | 2QFY2016 Result Update
Research Team Tel: 022 - 39357800
DISCLAIMER
Angel Broking Private Limited (hereinafter referred to as “Angel”) is a registered Member of National Stock Exchange of India Limited,
Bombay Stock Exchange Limited and Metropolitan Stock Exchange of India Limited. It is also registered as a Depository Participant with
CDSL and Portfolio Manager with SEBI. It also has registration with AMFI as a Mutual Fund Distributor. Angel Broking Private Limited is
a registered entity with SEBI for Research Analyst in terms of SEBI (Research Analyst) Regulations, 2014 vide registration number
INH000000164. Angel or its associates has not been debarred/ suspended by SEBI or any other regulatory authority for accessing
/dealing in securities Market. Angel or its associates including its relatives/analyst do not hold any financial interest/beneficial
ownership of more than 1% in the company covered by Analyst. Angel or its associates/analyst has not received any compensation /
managed or co-managed public offering of securities of the company covered by Analyst during the past twelve months. Angel/analyst
has not served as an officer, director or employee of company covered by Analyst and has not been engaged in market making activity
of the company covered by Analyst.
This document is solely for the personal information of the recipient, and must not be singularly used as the basis of any investment
decision. Nothing in this document should be construed as investment or financial advice. Each recipient of this document should
make such investigations as they deem necessary to arrive at an independent evaluation of an investment in the securities of the
companies referred to in this document (including the merits and risks involved), and should consult their own advisors to determine
the merits and risks of such an investment.
Reports based on technical and derivative analysis center on studying charts of a stock's price movement, outstanding positions and
trading volume, as opposed to focusing on a company's fundamentals and, as such, may not match with a report on a company's
fundamentals.
The information in this document has been printed on the basis of publicly available information, internal data and other reliable
sources believed to be true, but we do not represent that it is accurate or complete and it should not be relied on as such, as this
document is for general guidance only. Angel Broking Pvt. Limited or any of its affiliates/ group companies shall not be in any way
responsible for any loss or damage that may arise to any person from any inadvertent error in the information contained in this report.
Angel Broking Pvt. Limited has not independently verified all the information contained within this document. Accordingly, we cannot
testify, nor make any representation or warranty, express or implied, to the accuracy, contents or data contained within this document.
While Angel Broking Pvt. Limited endeavors to update on a reasonable basis the information discussed in this material, there may be
regulatory, compliance, or other reasons that prevent us from doing so.
This document is being supplied to you solely for your information, and its contents, information or data may not be reproduced,
redistributed or passed on, directly or indirectly.
Neither Angel Broking Pvt. Limited, nor its directors, employees or affiliates shall be liable for any loss or damage that may arise from
or in connection with the use of this information.
Note: Please refer to the important ‘Stock Holding Disclosure' report on the Angel website (Research Section). Also, please refer to the
latest update on respective stocks for the disclosure status in respect of those stocks. Angel Broking Pvt. Limited and its affiliates may
have investment positions in the stocks recommended in this report.
Disclosure of Interest Statement
Dr. Reddy’s Laboratories
1. Analyst ownership of the stock
No
2. Angel and its Group companies ownership of the stock
No
3. Angel and its Group companies' Directors ownership of the stock
No
4. Broking relationship with company covered
No
Note: We have not considered any Exposure below ` 1 lakh for Angel, its Group companies and Directors
Ratings (Based on expected returns
Buy (> 15%)
Accumulate (5% to 15%)
Neutral (-5 to 5%)
over 12 months investment period):
Reduce (-5% to -15%)
Sell (< -15%)
November 16, 2015
12