1QFY2017 Result Update | Pharmaceutical
August 17, 2016
Dishman Pharmaceuticals
SELL
CMP
`170
Performance Highlights
Target Price
`45
Y/E March (` cr)
1QFY2017 4QFY2016
% chg qoq 1QFY2016
% chg yoy
Investment Period
-
Net sales
366
406
(9.8)
400
(8.5)
Other income
17
29
(43.8)
5
257.2
Stock Info
Operating profit
93
88
5.1
104
(10.8)
Sector
Pharmaceutical
Interest
22
20
9.7
32
(29.5)
Market Cap (` cr)
2,746
Net profit/(loss)
46
50
(8.9)
40
13.7
Net Debt (` cr)
845
Source: Company, Angel Research
Beta
1.3
52 Week High / Low
210 / 87
The company posted better than expected results for 1QFY2017 with sales at
Avg. Daily Volume
307,512
`366cr V/s `350cr expected and V/s `400cr in 1QFY2016, a yoy de-growth of
Face Value (`)
2
8.5%. CRAMS (`258cr) posted a growth of 2.3% yoy and the Market Molecules
BSE Sensex
28,065
other segment (`108cr) posted de-growth of 26.9% yoy. On the operating front,
Nifty
8,643
the EBITDA margin came in at 25.3% V/s 20.9% expected and V/s 25.4% in
Reuters Code
DISH.BO
1QFY2016. Thus, the Adj. net profit came in at `46cr V/s `32cr expected and V/s
`40cr in 1QFY2016, a yoy growth of 13.7%. We recommend a SELL.
Bloomberg Code
DISH@IN
Results better than expected on all fronts: Company posted better than expected
results for 1QFY2017 with sales at `366cr V/s `350cr expected and V/s `400cr
Shareholding Pattern (%)
in 1QFY2016, a yoy de-growth of 8.5%. CRAMS (`258cr) posted a growth of
Promoters
61.4
2.3% yoy and Market Molecules (`108cr) posted de-growth of 26.9% yoy. Within
MF / Banks / Indian Fls
6.4
CRAMS, Carbogen Amcis (`202.3cr) posted a yoy growth of 14.3%, CRAMS India
FII / NRIs / OCBs
19.9
(`42.1cr) posted de-growth of 37.0% and CRAMS UK (`13.5cr) posted a yoy
Indian Public / Others
12.3
growth of 62.4%. Market Molecules declined on back of Vitamin D (`62.6cr; a
yoy de-growth of 28.4%), while the other segment (`45.7cr) posted a yoy de-
growth of 24.8%. On the operating front, the EBITDA margin came in at 25.3%
Abs. (%)
3m 1yr 3yr
V/s 20.9% expected and V/s 25.4% in 1QFY2016. Thus, the Adj. net profit came
Sensex
9.4
(0.0)
50.9
in at `46cr V/s `32cr expected and V/s `40cr in 1QFY2016, a yoy growth of
Dishman
(1.9)
(12.9)
44.5
13.7%
Outlook and valuation: We expect Dishman’s net sales and net profit to grow at a
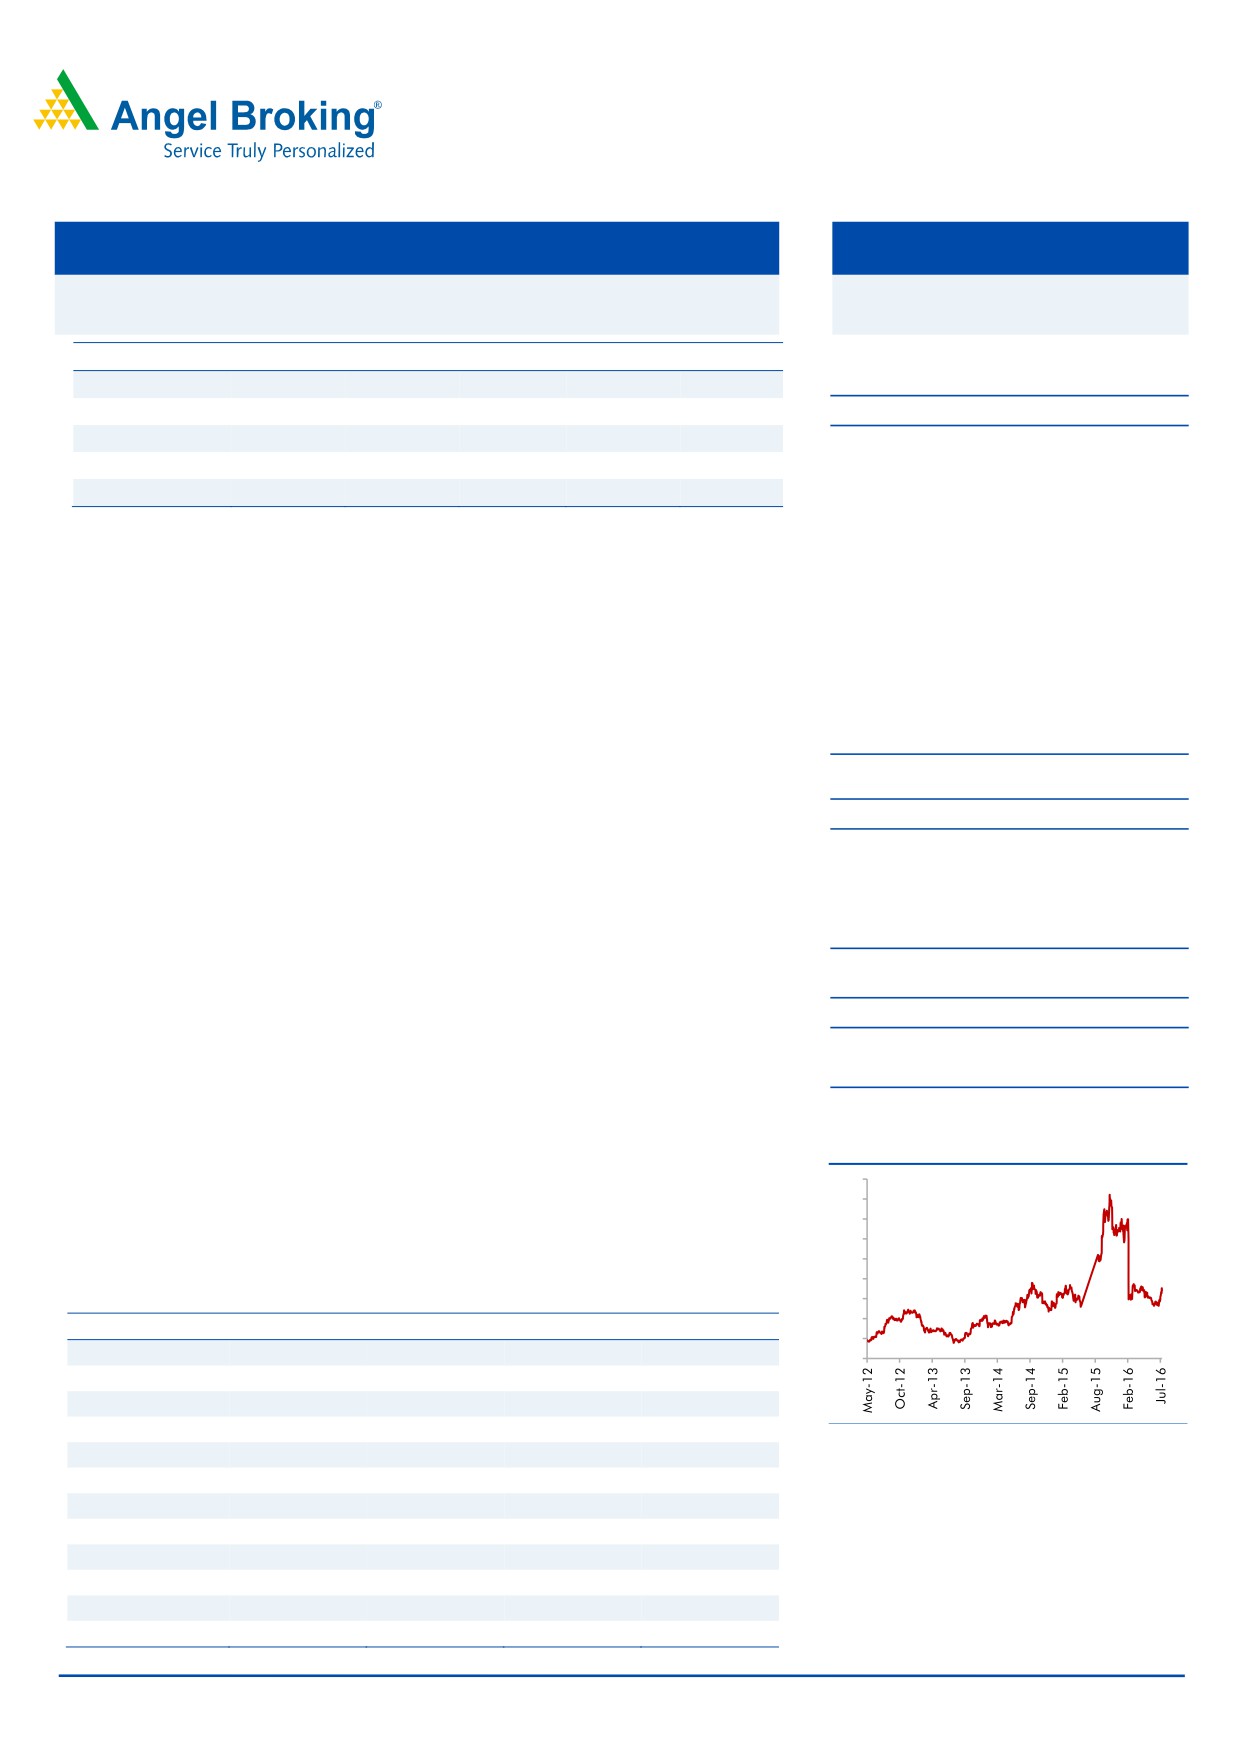
3-year price chart
CAGR of 10.0% and 3.1%, respectively, over FY2016-18E. At current levels,
450
400
Dishman is trading at 15.1x its FY2018E earnings. We believe the current
350
valuations are expensive, given the restrained growth and low profitability; hence,
300
we maintain our SELL rating on the stock.
250
200
Key financials (Consolidated)
150
100
Y/E March (` cr)
FY2015
FY2016
FY2017E
FY2018E
50
Net sales
1,575
1,562
1,718
1,890
0
% chg
14.7
(0.8)
10.0
10.0
Net profit
119.8
171.0
154.0
181.7
% chg
9.6
42.8
(9.9)
18.0
Source: Company, Angel Research
EPS (`)
7.4
10.6
9.5
11.3
EBITDA margin (%)
19.9
24.1
22.7
22.8
P/E (x)
22.9
16.1
17.8
15.1
RoE (%)
9.9
12.7
10.1
10.9
RoCE (%)
7.2
11.2
9.4
10.3
P/BV (x)
2.2
1.9
1.7
1.6
Sarabjit Kour Nangra
EV/Sales (x)
1.4
1.4
2.0
1.7
+91 22 3935 7800 Ext: 6806
EV/EBITDA (x)
6.9
5.7
8.9
7.7
Source: Company, Angel Research; Note: CMP as of August 16, 2016
Please refer to important disclosures at the end of this report
1
Dishman Pharmaceuticals | 1QFY2017 Result Update
Exhibit 1: 1QFY2017 performance (Consolidated)
Y/E March (` cr)
1QFY2017
4QFY2016
% chg QoQ 1QFY2016
% chg YoY
FY2016
FY2015
% chg
Net sales
366
406
(9.8)
400
(8.5)
1,562
1,560
0.1
Other income
17
29
(43.8)
5
257.2
61
101
(39.9)
Total income
382
435
(12.1)
405
(5.5)
1,623
1,661
(2.3)
Gross profit
312
330
(5.6)
318
(1.9)
1,226
1,025
19.6
Gross margins
85.2
81.4
79.4
78.5
65.7
Operating profit
93
88
5.1
104
(10.8)
376
299
25.8
OPM (%)
25.3
21.7
26.0
24.1
19.2
Interest
22
20
9.7
32
(29.5)
94
90
4.9
Dep & amortisation
28
30
(4.7)
26
9.8
109
151
(27.8)
PBT
58
67
(13.3)
51
14.8
233
159
46.8
Provision for taxation
13
17
(26.6)
12
8.7
62
39
59.9
Reported net profit
46
50
(8.6)
40
13.7
171
120
42.5
Less : Exceptional items
-
-
-
-
-
-
Minority interest
0
0
0
-
0
PAT after exceptional items
46
50
(8.9)
40
13.7
171
120
42.8
Adj. PAT
46
50
(8.9)
40
13.7
171
120
42.8
EPS (`)
5.6
6.2
5.0
21.2
14.8
Source: Company, Angel Research
Exhibit 2: 1QFY2017 - Actual Vs Angel estimates
(` cr)
Actual
Estimates
Variation
Net sales
382
350
9.3
Other income
17
29
(43.8)
Operating profit
46
84
(46.1)
Interest
22
21
9.6
Tax
13
17
(26.8)
Net profit
46
32
44.0
Source: Company, Angel Research
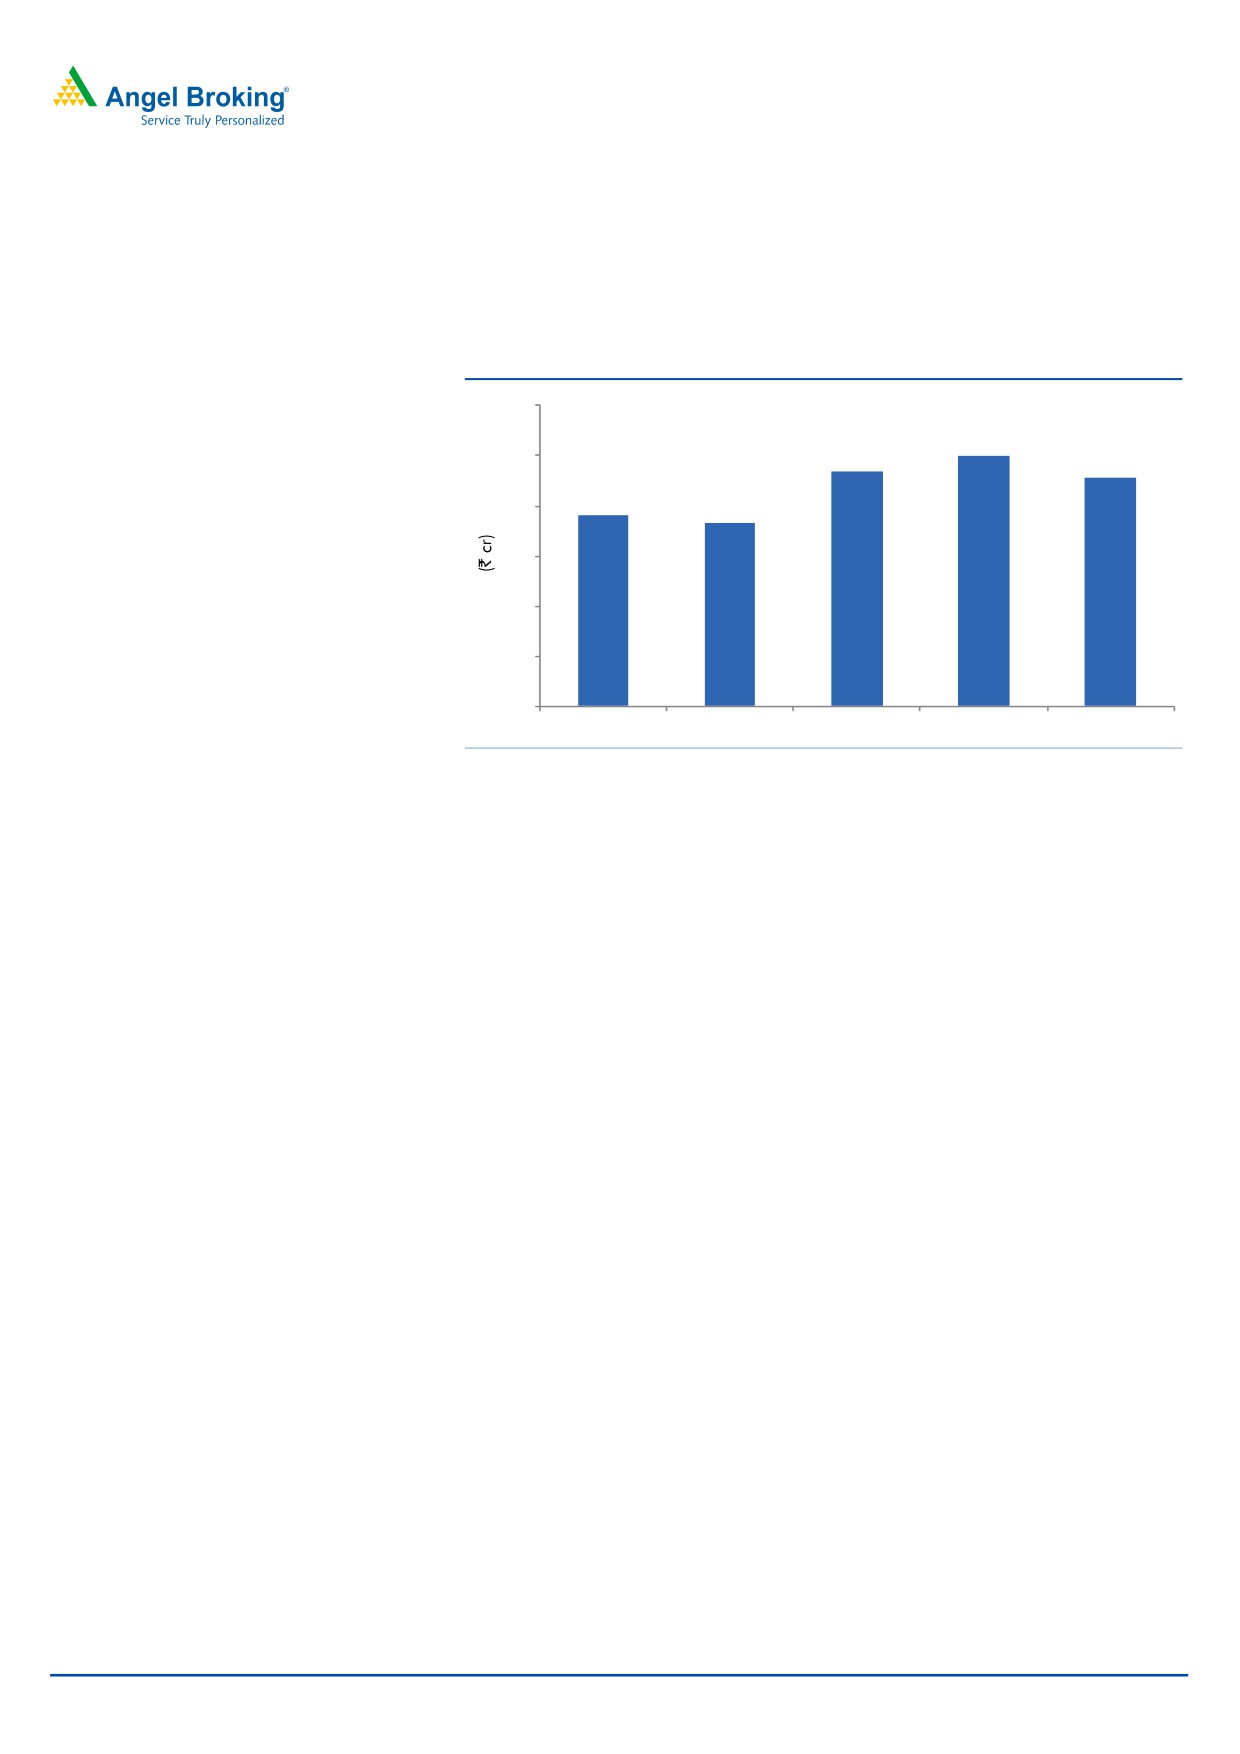
Revenue above expectation: Sales came in at `366cr V/s `350cr expected and V/s
`400cr in 1QFY2016, a yoy de-growth of 8.5%. CRAMS (`258cr) posted a growth
of 2.3% yoy and Market Molecules (`108cr) posted de-growth of 26.9% yoy.
Within CRAMS, Carbogen Amcis (`202.3cr) posted a yoy growth of 14.3%, CRAMS
India (`42.1cr) posted de-growth of 37.0% and CRAMS UK (`13.5cr) posted a yoy
growth of 62.4%. Market Molecules declined on back of Vitamin D (`62.6cr; a yoy
de-growth of 28.4%), while the other Marketable Molecules segment (`45.7cr)
posted a yoy de-growth of 24.8%.
CRAMS-India’s revenues declined by 37.0% yoy as the corresponding quarter last
year had a higher base due to spill over of few commercial orders for a specific
customer from 4QFY2015 to 1QFY2016 and higher supply requirement of the
customer in 1QFY2016. The orders received in FY2017 are to be supplied over the
next three quarters.
Carbogen Amcis’ revenues were higher by 14.3% yoy due to higher share of high
margin commercial orders as against development orders. Vitamin D revenues
declined 28.4% yoy as the company discontinued supply of certain lower margin
orders to China and continued to consolidate its focus on high margin Vitamin D
analogues and cholesterol business.
August 17, 2016
2
Dishman Pharmaceuticals | 1QFY2017 Result Update
Exhibit 3: Sales trend
410
406
400
400
390
382
380
374
370
366
360
350
340
1QFY2016
2QFY2016
3QFY2016
4QFY2016
1QFY2017
Source: Company, Angel Research
OPM above expectation: On the operating front, EBITDA margin came in at 25.3%
V/s 20.9% expected V/s 25.4% in 1QFY2016. The GPM came in at 85.2% V/s
81.3% expected and V/s 79.4% in 1QFY2016. Margin improvement was on the
back of an improved sales mix.
CRAMS - Carbogen Amcis posted an OPM of 19.9% in 1QFY2017 V/s 17.2% in
1QFY2016, CRAMS - India posted an OPM of 56.5% in 1QFY2017 V/s 49.5% in
1QFY2016 and CRAMS - UK posted an OPM of 24.2% in 1QFY2017 V/s 16.9%
in 1QFY2016. In Market Molecules segment, Vitamin D posted an OPM of 34.0%
in 1QFY2017 V/s 30.5% in 1QFY2016.
CRAMS - Carbogen Amcis’ OPM improved by ~220bp due to higher revenue
contribution from the high margin “commercial production” work. CRAMS India’s
OPM improved by ~700bp due to execution of high margin commercial and
development orders, process improvement and a better product mix. In Vitamin D,
the focus is on high value products like certain Vitamin D analogues and direct
selling of cholesterol medications to end customers. Further the segment also
benefitted from bulk purchase of raw materials at lower prices.
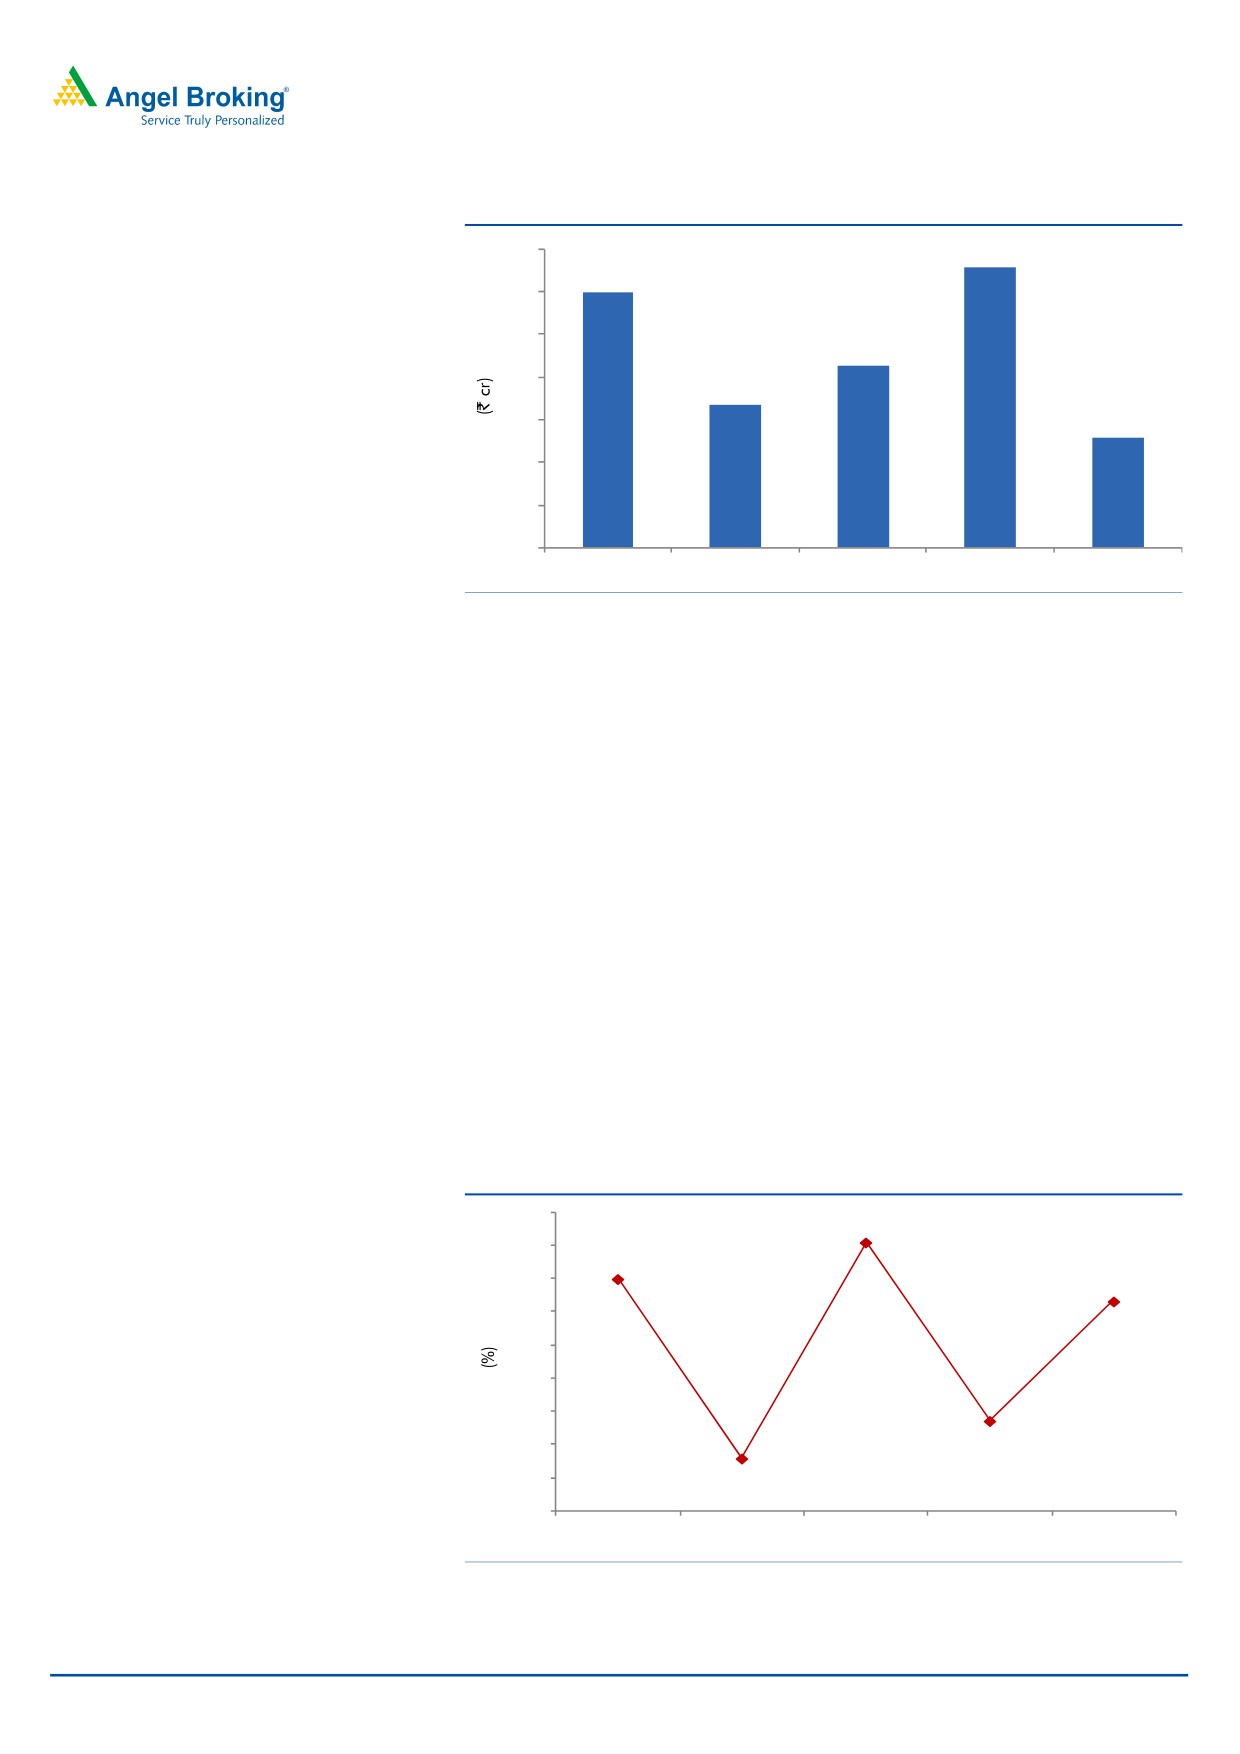
Exhibit 4: OPM trend (%)
28.0
27.1
27.0
26.0
26.0
25.3
25.0
24.0
23.0
21.7
22.0
20.6
21.0
20.0
19.0
1QFY2016
2QFY2016
3QFY2016
4QFY2016
1QFY2017
Source: Company, Angel Research
August 17, 2016
3
Dishman Pharmaceuticals | 1QFY2017 Result Update
Net profit higher than expectation: Thus, the Adj. net profit came in at `45.5cr V/s
`32cr expected and V/s `41cr in 1QFY2016, a yoy growth of 13.7%. Apart from
the OPM expansion, the other income came in at `17cr V/s `5cr during the
corresponding period of last year.
Exhibit 5: Net profit trend
60
50
50
47
46
38
40
37
30
20
10
0
1QFY2016
2QFY2016
3QFY2016
4QFY2016
1QFY2017
Source: Company, Angel Research
Investment arguments
Focus on profitability: Dishman has been incurring a capex of around
~`100cr on an annual basis over the last couple of years. With the major
capex out, the company is now focused on improving the overall profitability
of the business. The same is evident in the improvement in OPM from 16.4%
in FY2011 to 23.3% in FY2014, thereby improving the overall profitability of
the company. The RoCE of the company improved from 5.5% in FY2011 to
10.2% in FY2014. Going forward, with focus on profitability, the company has
reduced its capex plans (~`30-50cr in FY2015) and lays focus on sweating its
assets and restructuring the business, which will lead to improvement in
profitability over the medium term. We expect the ROCE to improve to 10.9%
in FY2017E from 7.7% in FY2012.
CRAMS stabilizing: CRAMS, which contributes by around 65.1% to the overall
business has stabilised over the last two years, after a lull, posting a robust
growth of 14% in FY2012-14. As of March 2015, Carbogen Amcis has a
budgeted total order book of over `673cr for FY2016 and a part of the same
is in hands. In its Oncology Hippo Unit 9, the Management expects to book
more incremental revenues, where EBITDA margins are high at 40-50%. As
regards the Vitamin-D business, the Management expects to scale it up to
`300cr with a 20% EBITDA margin.
Outlook and valuation
We expect Dishman’s net sales and net profit top post a CAGR of 10.0% and 3.1%
respectively over FY2016-18E. At current levels, Dishman is trading at 15.1x its
FY2018E earnings. We believe the current valuations are expensive, given the
restrained growth and low ROE. We maintain SELL, with a price target of `45.
August 17, 2016
4
Dishman Pharmaceuticals | 1QFY2017 Result Update
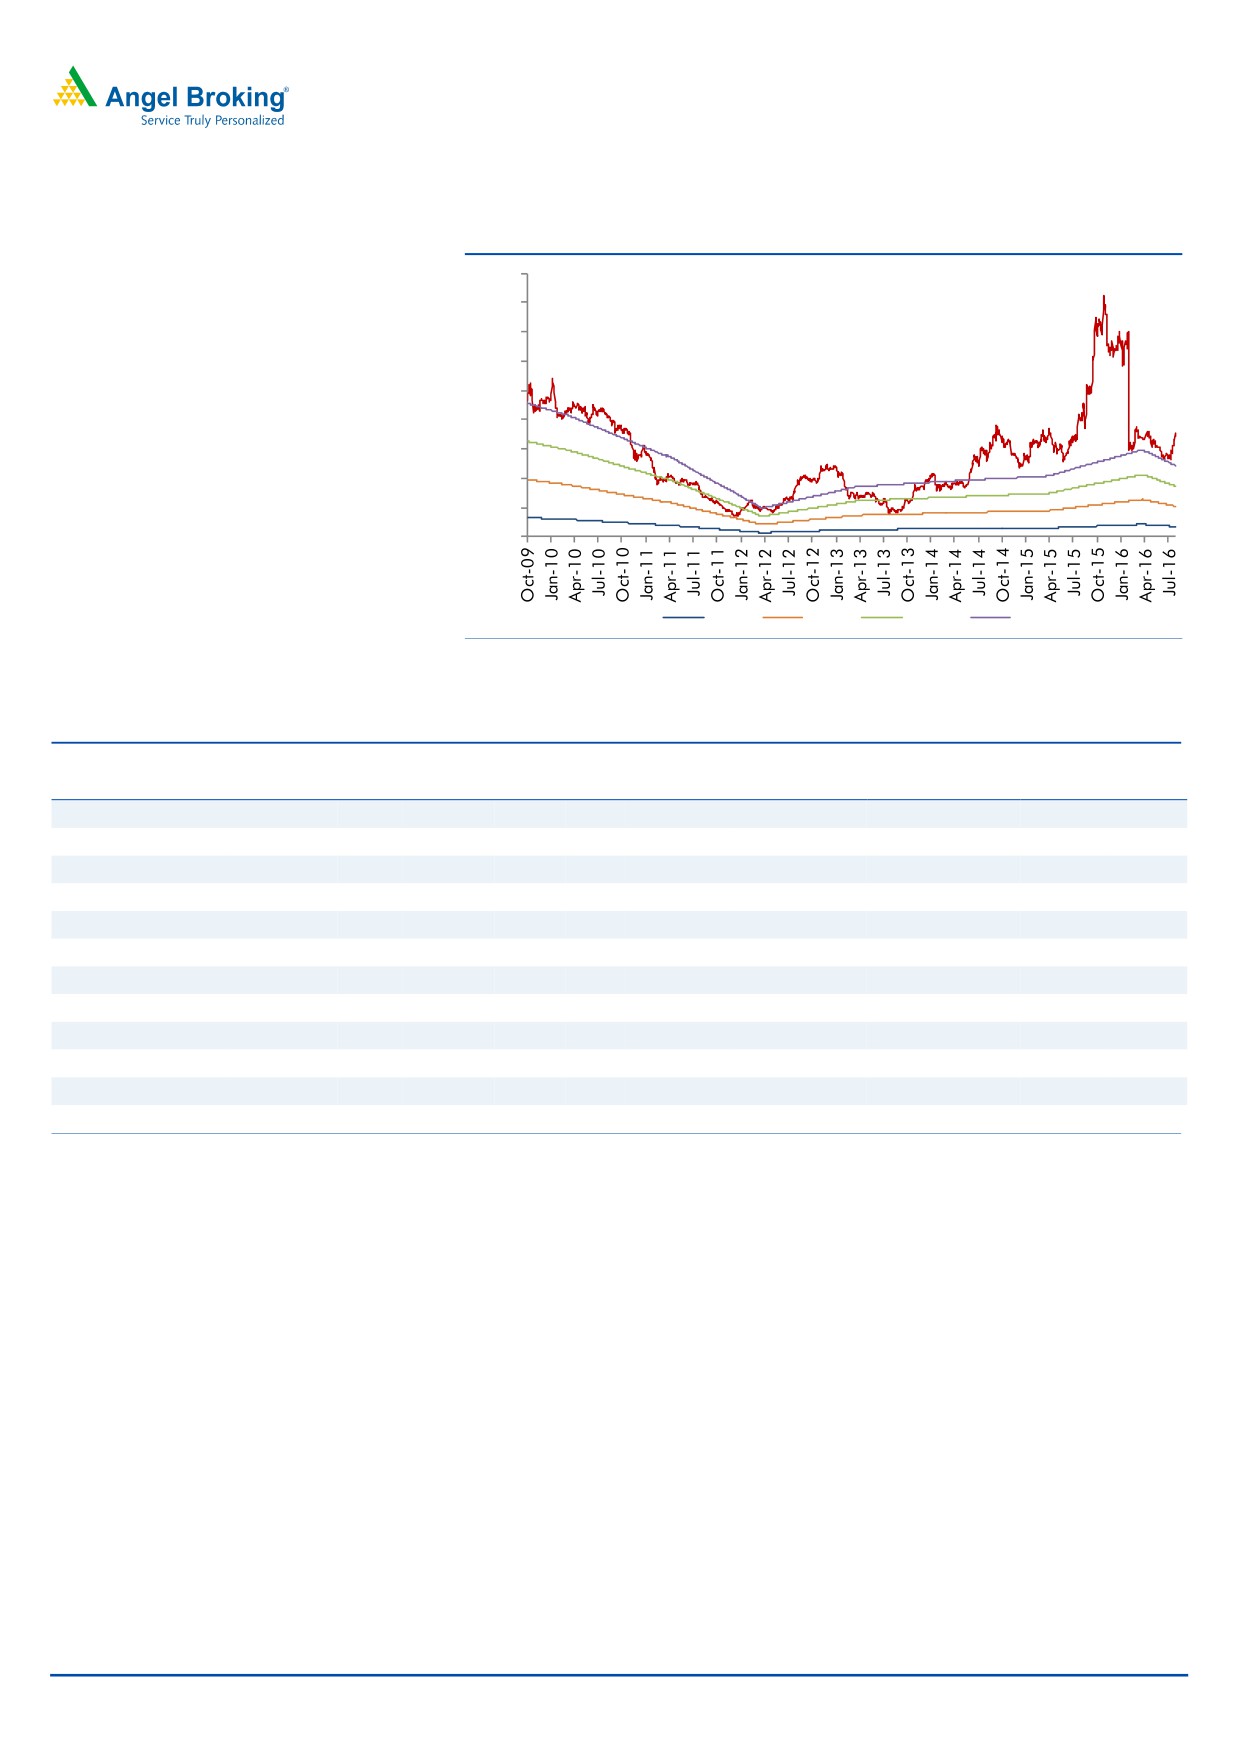
Exhibit 6: One-year forward PE
450
400
350
300
250
200
150
100
50
-
2x
6x
10x
14x
Source: Company, Angel Research
Exhibit 7: Recommendation summary
Company
Reco
CMP Tgt. price Upside
FY2018E
FY16-18E
FY2018E
(`)
(`)
% PE (x) EV/Sales (x) EV/EBITDA (x) CAGR in EPS (%) RoCE (%) RoE (%)
Alembic Pharma
Neutral
647
-
-
21.3
2.8
13.3
(10.8)
27.5
25.3
Aurobindo Pharma Buy
735
877
19.3
15.5
2.6
10.8
18.1
22.5
26.1
Cadila Healthcare
Accumulate
364
400
9.9
18.2
2.7
12.4
15.8
24.3
26.6
Cipla
Reduce
554
490
(11.5)
20.4
2.6
14.0
20.4
13.5
15.2
Dr Reddy's
Neutral
3,008
-
-
19.1
2.8
11.2
6.9
18.1
17.1
Dishman Pharma
Sell
170
45
(73.6)
15.1
1.8
7.7
3.1
10.3
10.9
GSK Pharma*
Neutral
3,049
-
-
51.3
6.6
35.1
15.9
35.8
31.8
Indoco Remedies
Sell
306
225
(26.5)
19.6
2.3
12.5
31.5
19.1
19.2
Ipca labs
Buy
517
613
18.6
26.2
1.8
11.9
36.5
8.8
9.4
Lupin
Accumulate
1,590
1,809
13.8
22.9
3.8
14.1
17.2
24.4
20.9
Sanofi India
Neutral
4,343
-
-
25.7
3.2
18.5
21.2
24.9
28.4
Sun Pharma
Buy
783
944
20.6
23.9
4.8
15.5
22.0
33.1
18.9
Source: Company, Angel Research; Note: *December year ending
Background
Dishman commenced business in
1983 as a QUAT (Speciality Chemicals)
company and has since emerged to be a global leader in the segment. Since
1997, Dishman has diversified its interests towards the CRAMS segment. The
company has now established itself as a respected and preferred outsourcing
partner to various pharma majors, offering a portfolio of development, scale-up
and manufacturing services. The company caters to the customers' needs ranging
from chemical development to commercial manufacture and supply of APIs.
Dishman has large scale manufacturing facilities in India and China.
August 17, 2016
5
Dishman Pharmaceuticals | 1QFY2017 Result Update
Profit & Loss Statement (Consolidated)
Y/E March (` cr)
FY2013
FY2014
FY2015
FY2016
FY2017E
FY2018E
Gross sales
1,273
1,387
1,582
1,577
1,735
1,909
Less: Excise duty
6
14
7
16
17
19
Net sales
1,268
1,373
1,575
1,562
1,718
1,890
Other operating income
5
12
44
34
34
34
Total operating income
1,272
1,385
1,619
1,596
1,752
1,924
% chg
13.2
8.9
16.9
(1.4)
9.8
9.8
Total expenditure
982
1,053
1,262
1,186
1,328
1,459
Net raw materials
376
373
535
336
464
510
Other mfg costs
95
103
77
117
129
142
Personnel
351
412
423
535
526
577
Other
161
164
227
197
210
230
EBITDA
285
320
314
376
390
430
% chg
28.7
12.2
(2.1)
19.9
3.7
10.4
(% of Net Sales)
22.5
23.3
19.9
24.1
22.7
22.8
Depreciation & amortisation
84
109
151
109
153
156
EBIT
202
212
163
267
237
274
% chg
38.8
5.0
(23.0)
63.9
(11.2)
15.6
(% of Net Sales)
15.9
15.4
10.3
17.1
13.8
14.5
Interest & other charges
79
92
90
94
93
93
Other Income
15
25
42
27
27
27
(% of PBT)
10.8
15.8
26.5
11.4
12.9
11.0
Share in profit of associates
-
-
-
-
-
-
Recurring PBT
143
156
159
233
205
242
% chg
61.4
9.5
1.8
46.6
(12.0)
18.0
Extraordinary expense/(Inc.)
(2.4)
0.2
PBT (reported)
145
156
159
233
205
242
Tax
45.0
47.1
39.4
62.4
51.3
60.6
(% of PBT)
31.0
30.1
24.8
26.7
25.0
25.0
PAT (reported)
100
109
120
171
154
182
Add: Share of earnings of asso.
0
0
-
-
-
-
Less: Minority interest (MI)
-
-
-
-
-
-
Prior period items
-
-
-
-
-
-
PAT after MI (reported)
100
109
120
171
154
182
ADJ. PAT
99
109
120
171
154
182
% chg
73.1
10.7
9.6
42.8
(9.9)
18.0
(% of Net Sales)
7.9
8.0
7.6
10.9
9.0
9.6
Basic EPS (`)
6.1
6.8
7.4
10.6
9.5
11.3
Fully Diluted EPS (`)
6.1
6.8
7.4
10.6
9.5
11.3
% chg
73.1
10.7
9.6
42.8
(9.9)
18.0
August 17, 2016
6
Dishman Pharmaceuticals | 1QFY2017 Result Update
Balance Sheet (Consolidated)
Y/E March (` cr)
FY2013
FY2014
FY2015
FY2016
FY2017E
FY2018E
SOURCES OF FUNDS
Equity share capital
16
16
16
16
32
32
Share application money
4
4
-
-
-
-
Reserves & surplus
1,026
1,161
1,222
1,435
1,555
1,717
Shareholders funds
1,046
1,181
1,238
1,452
1,587
1,750
Minority interest
-
-
-
0
-
-
Total loans
800
880
836
841
841
841
Other Long Term Liabilities
10
0
73
-
-
-
Long Term Provisions
43
64
97
81
81
81
Deferred tax liability
58
68
63
77
77
77
Total liabilities
1,956
2,193
2,307
2,451
2,586
2,749
APPLICATION OF FUNDS
Gross block
1,686
1,946
2,019
2,158
2,208
2,258
Less: Acc. depreciation
524
688
813
923
1,075
1,232
Net block
1,162
1,258
1,206
1,235
1,133
1,026
Capital work-in-progress
97
79
142
142
142
142
Goodwill
211
247
235
253
253
253
Long-Term Loans and Adv.
25
25
38
25
25
25
Investments
123
182
188
223
228
251
Current Assets
673
760
1,000
1,102
1,256
1,548
Cash
21
35
36
62
107
284
Loans & Advances
241
269
299
295
325
357
Other
581
457
665
744
825
907
Current liabilities
335
361
502
529
452
496
Net Current Assets
338
399
498
572
805
1,052
Non CA
-
2
-
-
-
-
Total Assets
1,956
2,193
2,307
2,451
2,586
2,749
August 17, 2016
7
Dishman Pharmaceuticals | 1QFY2017 Result Update
Cash Flow Statement (Consolidated)
Y/E March (` cr)
FY2013 FY2014 FY2015 FY2016 FY2017E FY2018E
Profit before tax
145
156
159
233
205
242
Depreciation
84
109
151
109
153
156
(Inc)/Dec in Working Capital
(178)
63
(103)
(84)
(192)
(93)
Less: Other income
15
25
42
27
27
27
Direct taxes paid
(45)
(47)
(39)
(62)
(51)
(61)
Cash Flow from Operations
144
179
180
181
182
183
(Inc.)/Dec.in Fixed Assets
(101)
(242)
(136)
(139)
(50)
(50)
(Inc.)/Dec. in Investments
-
-
-
-
-
-
Other income
15
25
42
27
27
27
Cash Flow from Investing
(85)
(217)
(94)
(112)
(23)
(23)
Issue of Equity
-
-
-
-
-
-
Inc./(Dec.) in loans
(105)
92
62
(84)
-
-
Dividend Paid (Incl. Tax)
(11)
(11)
(19)
(19)
(19)
(19)
Others
54
312
-
-
-
-
Cash Flow from Financing
(62)
393
43
(103)
(19)
(19)
Inc./(Dec.) in Cash
(3)
354
129
(34)
140
141
Opening Cash balances
24
21
35
36
62
107
Closing Cash balances
21
35
36
62
107
284
August 17, 2016
8
Dishman Pharmaceuticals | 1QFY2017 Result Update
Key Ratio
Y/E March
FY2013
FY2014
FY2015
FY2016
FY2017E
FY2018E
Valuation Ratio (x)
P/E (on FDEPS)
27.8
25.1
22.9
16.1
17.8
15.1
P/CEPS
7.5
6.3
5.1
4.9
9.0
8.1
P/BV
2.6
2.3
2.2
1.9
1.7
1.6
Dividend yield (%)
0.7
0.6
1.2
1.2
1.2
1.2
EV/Sales
1.7
1.6
1.4
1.4
2.0
1.7
EV/EBITDA
7.5
6.9
6.9
5.7
8.9
7.7
EV / Total Assets
1.1
1.0
0.9
0.9
1.3
1.2
Per Share Data (`)
EPS (Basic)
6.1
6.8
7.4
10.6
9.5
11.3
EPS (fully diluted)
6.1
6.8
7.4
10.6
9.5
11.3
Cash EPS
22.8
27.0
33.5
34.7
19.0
20.9
DPS
1.2
1.0
2.0
2.0
2.0
2.0
Book Value
64.8
73.2
76.7
89.9
98.3
108.4
Dupont Analysis
EBIT margin
15.9
15.4
10.3
17.1
13.8
14.5
Tax retention ratio
69.0
69.9
75.2
73.3
75.0
75.0
Asset turnover (x)
0.7
0.7
0.7
0.7
0.7
0.8
ROIC (Post-tax)
7.3
7.3
5.7
8.6
7.5
8.5
Cost of Debt (Post Tax)
6.6
7.7
7.9
8.3
8.3
8.3
Leverage (x)
0.8
0.7
0.7
0.6
0.5
0.4
Operating ROE
7.8
7.0
4.2
8.8
7.1
8.6
Returns (%)
ROCE (Pre-tax)
10.4
10.2
7.2
11.2
9.4
10.3
Angel ROIC (Pre-tax)
13.9
12.2
8.7
13.7
11.6
13.2
ROE
10.0
9.8
9.9
12.7
10.1
10.9
Turnover ratios (x)
Asset Turnover (Gross Block)
0.9
0.8
0.8
0.8
0.8
0.9
Inventory / Sales (days)
99
100
106
106
123
138
Receivables (days)
47
20
21
42
25
28
Payables (days)
46
34
36
49
37
30
WC cycle (ex-cash) (days)
85
90
93
111
126
139
Solvency ratios (x)
Net debt to equity
0.7
0.7
0.6
0.5
0.5
0.3
Net debt to EBITDA
2.7
2.6
2.5
2.1
1.9
1.3
Interest Coverage (EBIT / Int.)
2.6
2.3
1.8
2.8
2.6
3.0
August 17, 2016
9
Dishman Pharmaceuticals | 1QFY2017 Result Update
Research Team Tel: 022 - 39357800
DISCLAIMER
Angel Broking Private Limited (hereinafter referred to as “Angel”) is a registered Member of National Stock Exchange of India Limited,
Bombay Stock Exchange Limited and Metropolitan Stock Exchange Limited. It is also registered as a Depository Participant with CDSL
and Portfolio Manager with SEBI. It also has registration with AMFI as a Mutual Fund Distributor. Angel Broking Private Limited is a
registered entity with SEBI for Research Analyst in terms of SEBI (Research Analyst) Regulations, 2014 vide registration number
INH000000164. Angel or its associates has not been debarred/ suspended by SEBI or any other regulatory authority for accessing
/dealing in securities Market. Angel or its associates/analyst has not received any compensation / managed or co-managed public
offering of securities of the company covered by Analyst during the past twelve months.
This document is solely for the personal information of the recipient, and must not be singularly used as the basis of any investment
decision. Nothing in this document should be construed as investment or financial advice. Each recipient of this document should
make such investigations as they deem necessary to arrive at an independent evaluation of an investment in the securities of the
companies referred to in this document (including the merits and risks involved), and should consult their own advisors to determine
the merits and risks of such an investment.
Reports based on technical and derivative analysis center on studying charts of a stock's price movement, outstanding positions and
trading volume, as opposed to focusing on a company's fundamentals and, as such, may not match with a report on a company's
fundamentals. Investors are advised to refer the Fundamental and Technical Research Reports available on our website to evaluate the
contrary view, if any.
The information in this document has been printed on the basis of publicly available information, internal data and other reliable
sources believed to be true, but we do not represent that it is accurate or complete and it should not be relied on as such, as this
document is for general guidance only. Angel Broking Pvt. Limited or any of its affiliates/ group companies shall not be in any way
responsible for any loss or damage that may arise to any person from any inadvertent error in the information contained in this report.
Angel Broking Pvt. Limited has not independently verified all the information contained within this document. Accordingly, we cannot
testify, nor make any representation or warranty, express or implied, to the accuracy, contents or data contained within this document.
While Angel Broking Pvt. Limited endeavors to update on a reasonable basis the information discussed in this material, there may be
regulatory, compliance, or other reasons that prevent us from doing so.
This document is being supplied to you solely for your information, and its contents, information or data may not be reproduced,
redistributed or passed on, directly or indirectly.
Neither Angel Broking Pvt. Limited, nor its directors, employees or affiliates shall be liable for any loss or damage that may arise from
or in connection with the use of this information.
Disclosure of Interest Statement
Dishman Pharmaceuticals
1. Financial interest of research analyst or Angel or his Associate or his relative
No
2. Ownership of 1% or more of the stock by research analyst or Angel or associates or relatives
No
3. Served as an officer, director or employee of the company covered under Research
No
4. Broking relationship with company covered under Research
No
Ratings (Based on expected returns
Buy (> 15%)
Accumulate (5% to 15%)
Neutral (-5 to 5%)
over 12 months investment period):
Reduce (-5% to -15%)
Sell (< -15)
August 17, 2016
10