IPO note | Infrastructure
July 29, 2016
Dilip Buildcon
SUBSCRIBE
sue Open: August 01, 2016
Is
A differentiated and potentially remunerative business…
Issue Close: August 03, 2016
IPO note
Company background: Dilip Buildcon Ltd (DBL) is a Bhopal based infra player
Issue Details
focused on (1) Roads & Highways construction (85% of Order Book [OB]), (2)
Face Value: `10
Irrigation (6% of OB), (3) Bridge (5% of OB) and (4) Urban Development (3% of
OB). In November 2007 it forayed into BOT-Toll & Annuity projects. Currently, it’s
Present Eq. Paid up Capital: `117.1cr
executing 64+ EPC projects and 18 BOT projects; 12 (including 11 Annuity/
Fresh Issue: 2.01 cr Shares
Annuity+Toll projects) of the 18 BOT projects are already operational.
Offer for Sale: 1.02cr Shares
Pros: (1) OB to FY2016 sales (for the standalone entity) stands at 2.6x, which
gives good revenue visibility, (2) strong NHAI and MoRTH Roads & Highways bid-
Post Eq. Paid up Capital: `136.8cr
pipeline suggests scope for OB growth, (3) superior margin profile and better
Issue size (amount): `649*-654cr**
return ratios, (4) strong earnings growth potential, (5) scope for improvement in
Price Band: `214-219
the Free Cash Flows (FCF).
Lot Size: 65 shares
Risks & Concerns: (1) Delays in execution of projects out of its home state Madhya
Post-issue implied mkt. cap:
Pradesh (MP) (accounts for 60% of its OB), (2) higher dependency on debt to fund
`2,926cr- 2,995cr
upcoming BOT projects, (3) any negative outcome of legal proceedings against
Promoters holding Pre-Issue: 90.2%
the company’s promoters.
Promoters holding Post-Issue: 75.6%
Valuation: DBL is poised to deliver healthy growth on the top-line as well as the
*At Lower end of the price band; ** At Upper end of
the price band
bottom-line front on the back of its strong order book (FY2016 OB/LTM ratio
stands at 2.6x). On the valuation front, at the higher-end of the issue price band,
Book Building
the company is available at a slight discount to its other listed road focused EPC
QIBs
50% of issue
peers on an Adj. P/E basis (on FY2016E EPS). The company reported a RoE of
22.4% in FY2016, which is among the best in the industry. Given the growth
Non-Institutional
15% of issue
prospects and the likelihood of strong FCF generation (supported by WC cycle
Retail
35% of issue
compression), this issue has the potential to deliver good returns for investors in
the near-to-medium term. Accordingly, we advise investors to SUBSCRIBE to the
issue.
Post Issue Shareholding Pattern
Key Financials (Standalone)
Promoters Group
75.6
Y/E March (` cr)
FY11
FY12
FY13
FY14
FY15
FY16
Net Sales
437
1,190
1,919
2,384
2,762
4,315
DIIs/FIIs/Public & Others
24.4
% chg
172.3
61.3
24.2
15.9
56.2
Net Profit
39
108
241
186
88
197
% chg
275.0
222.2
76.0
46.2
223.3
EBITDA (%)
21.2
22.2
24.7
22.0
24.9
23.1
EPS (`)
11
18
41
31
7
17
P/E (x)
19.7
12.0
5.4
7.0
29.3
13.0
P/BV (x)
22.7
8.7
4.8
3.6
0.0
0.0
RoE (%)
41.7
53.0
58.2
29.6
11.5
21.8
RoCE (%)
35.7
40.8
33.6
22.0
15.7
18.7
Yellapu Santosh
EV/Sales (x)
6.1
2.5
1.8
1.8
1.9
1.4
022 - 3935 7800 Ext: 6811
EV/EBITDA (x)
28.7
11.4
7.5
8.1
7.6
6.1
Source: Company, Angel Research; Note: Valuation multiples at higher- end of the price band
Please refer to important disclosures at the end of this report
1
Dilip Buildcon | IPO note
Issue Details
DBL is offering 2.99cr equity shares of `10 each via the book building route in a
price band of `214-219, consisting of fresh equity issue of 1.96cr shares and offer
for sale by Promoters and PE firm (Banyan Tree Growth Capital LLC) of 1.02cr
equity shares.
Exhibit 1: Shareholding Pattern
Pre-Issue
Post-Issue
Particulars
No. of Shares
(%)
No. of Shares
(%)
Promoter Group
10,57,14,087
90.2
10,34,41,359
75.6
Retail & HNI Investors
34,66,424
3.0
139,18,116
10.2
Institutional Investors
79,54,545
6.8
1,94,10,285
14.2
Source: Company, Angel Research
Objects of the Offer
`202cr to be utilized to pre-pay or schedule repayment of a portion of the
term loans availed.
`200cr to be utilized for funding WC requirements, and
General corporate purposes.
July 29, 201
2
Dilip Buildcon | IPO note
Company details
DBL is M.P. based Road EPC contractor focused in building Roads & Highways,
Bridges, Dams, Canals, & Water Supply Projects. Currently DBL is working on 64+
sites across 12 states with aggregate length of 8,421 lane kms. At FY2016-end,
Order book stands at `10,779cr.
In addition to EPC works, DBL also has portfolio of 18 BOT projects. Of these 12
are operational (totaling 1,683 lane kms, from Gujarat and Madhya Pradesh) and
6 are under construction stages. Notably, 16 of the 18 BOT projects are Annuity/
Annuity+Toll based projects, whereas remaining 2 are pure Toll based projects.
Exhibit 2: List of some of the large ticket projects being executed
Total Length in
Total Length of
Project
TPC
O/s OB
Appointment
Completion
Project Name
Single Lane (km)
the Road (km)
Type
(` in cr)
(` in cr)
Date
Date
(where applicable)
(where applicable)
Gwalior- Shivpuri
Road
962.9
395.8
Feb-2012
Jun-2016
125.3
501.2
Vijayawada-
Road
740.7
740.7
Jan-2016
Jan-2018
64.6
258.4
Machilipatnam
Mahulia- Baharagora
Road
674.1
674.1
Feb-2016
Feb-2018
71.6
286.4
Amritsar- Taran-taran-
Road
558.0
479.7
Sep-2015
Sep-2017
45.9
183.7
Harike section
Goa-Zuari Cable-Stayed
Bridge
545.4
545.4
Feb-2016
Feb-2019
Not applicable
Not applicable
Bridge
Kerala Border to Kollegal Road
419.4
129.3
May-2014
Jun-2016
129.3
258.6
Mohanpura Major
Irrigation
415.8
195.7
Mar-2014
Mar-2018
-
-
Multipurpose
Source: Company, Angel Research
July 29, 201
3
Dilip Buildcon | IPO note
Investment rationale
Order book/LTM sales at 2.6x… gives strong revenue visibility…
DBL has grown its order book from `2,601cr in FY12 to `10,779cr in FY2016,
mainly led by order wins from the Road segment. Till FY2012, DBL was pre-
dominantly MP-based road EPC player. In last 4 years, DBL diversified and is now
present across 12 states. In last 3 years, NHAI and MoRTH order wins helped DBL
grow its order book.
Dilip Buildcon at FY2016-end is sitting on order book of `10,779cr, which is 2.6x
its FY2016 revenues (LTM). Given that road projects awarded by NHAI and MoRTH
have 2-2.5 year’s execution, OB of DBL gives strong near-to-medium term revenue
growth visibility.
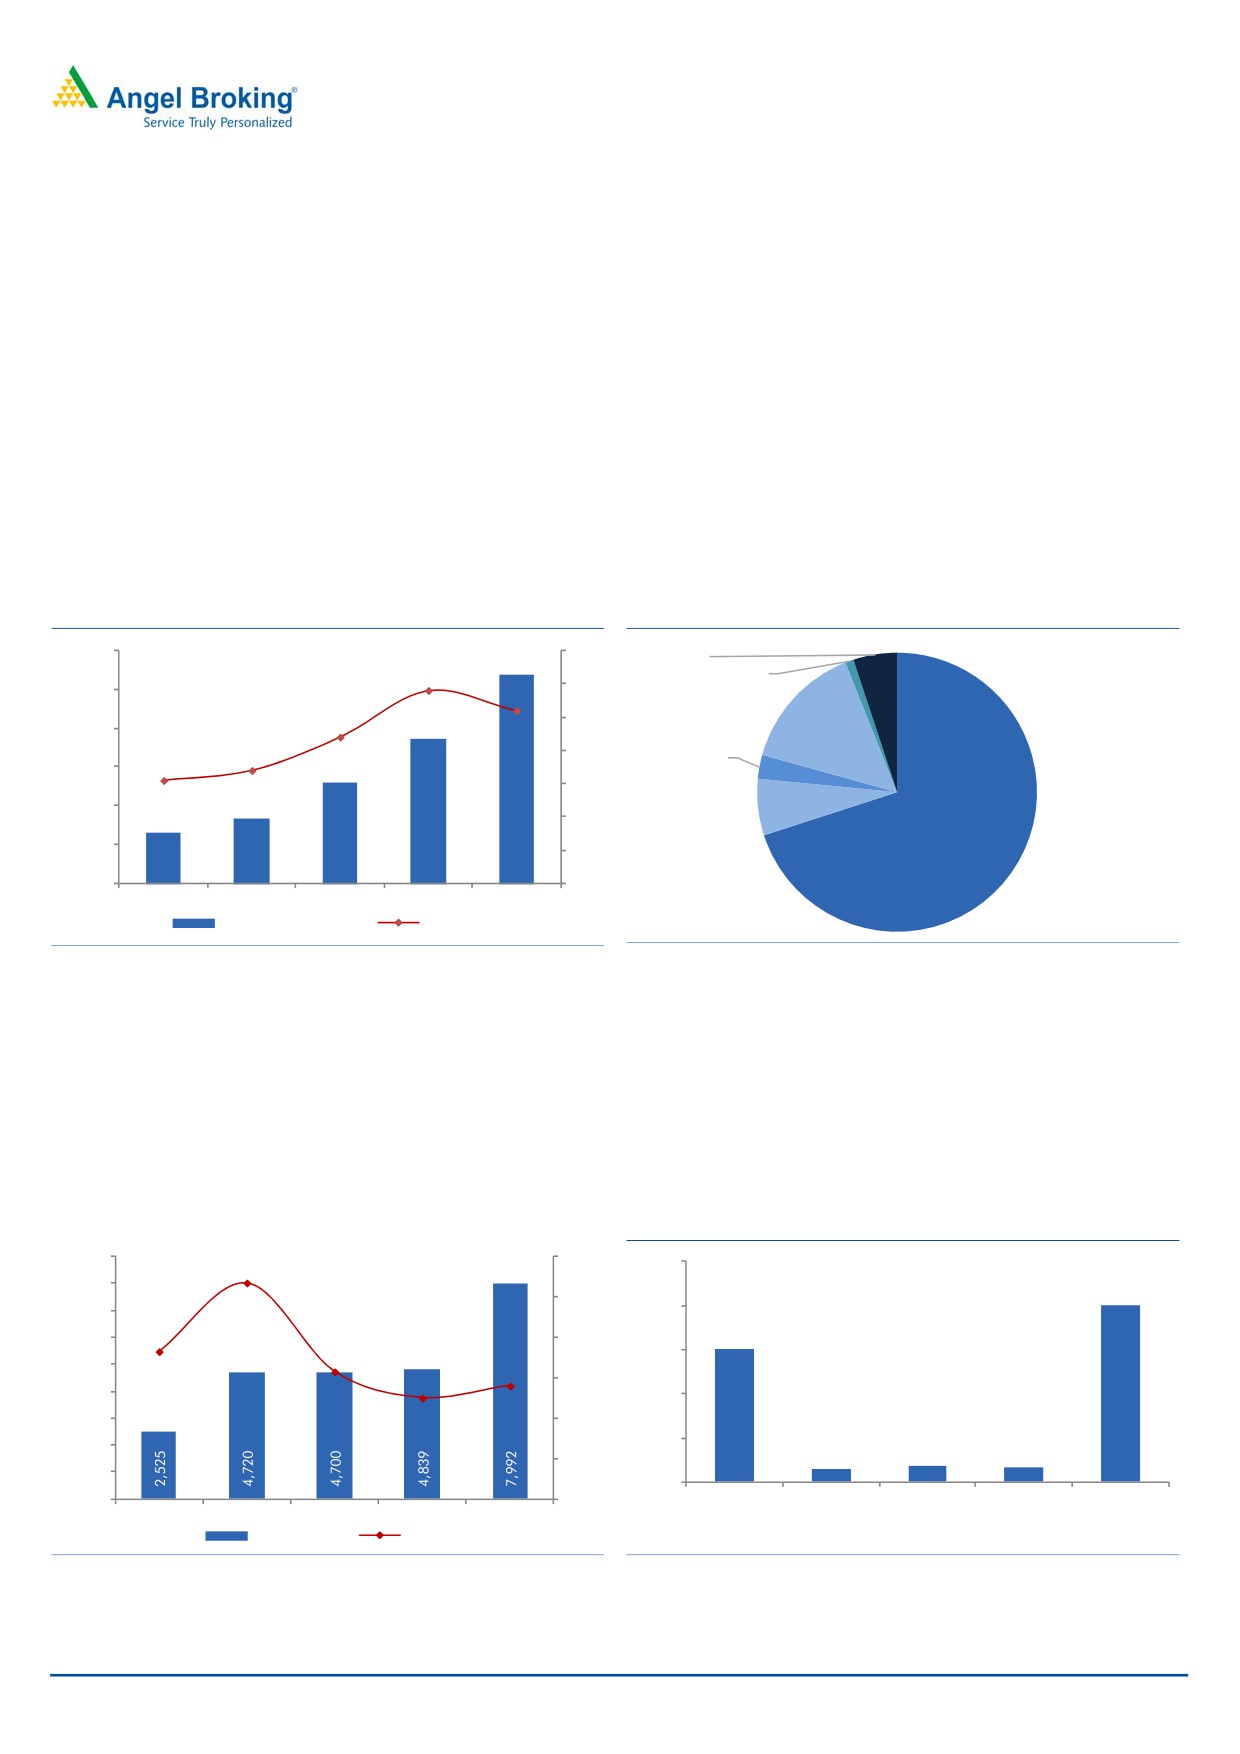
Exhibit 3: OB grows 4.1x during FY2012-16
Exhibit 4: Segment-wise Order book split
12,000
3.5x
Bridge
10,779
2.9x
5%
Mining
3.0x
1%
10,000
2.6x
BOT
2.2x
7,475
2.5x
8,000
15%
1.7x
2.0x
Urban Dev.
1.6x
6,000
5,161
3%
1.5x
Irrrigation
4,000
3,320
2,601
1.0x
6%
EPC - Road
2,000
0.5x
70%
0
0.0x
FY2012
FY2013
FY2014
FY2015
FY2016
Order Book (` in cr)
OB/LTM sales (x)
Source: Company, Angel Research
Source: Company, Angel Research
Notably, 63% of the current Order book is from the Road EPC works awarded by
NHAI and MoRTH.
EPC business enjoys strong Margin profile & better Return ratios
DBL follows differentiated approach towards its EPC business, which resulted in the
company reporting superior margins vs. its peers.
Exhibit 5: Reported strong EBITDA% during FY2012-16
Exhibit 6: Industry vs. DBL % reconciliation...
9,000
26.0
24.7
25%
8,000
20.0%
24.0
7,000
20%
21.3
15.0%
6,000
22.0
20.3
15%
5,000
19.6
19.0
20.0
4,000
10%
3,000
18.0
5%
2,000
1.6%
1.8%
1.7%
16.0
1,000
+
+
+
=
0%
0
14.0
Ind. Peer %
Sub-Cont.
Early Bonus
Opr. Levers
DBL %
2012
2013
2014
2015
2016
(RM, Equip.
EBITDA (` in cr)
EBITDA %
Fleet)
Source: Company, Angel Research
Source: Company, Angel Research
July 29, 201
4
Dilip Buildcon | IPO note
DBL historically has reported above industry average EBITDA margins of
19.0-24.7% during FY2012-16. Proper due-diligence, well defined systems in
place, has helped DBL historically complete many of its projects ahead of
schedule. As a result, DBL received 1.8% of total sales during FY2012-16 as early
completion bonus. DBL does not follow the strategy of sub-contracting as a result it
leads to cost savings thereby adding ~1.5-1.6% to margins. In absence of sub-
contracting strategy, DBL follows the strategy of using its in-house efficient
Equipments fleet, rather than depending on ‘leasing of equipments’ strategy. Also,
DBL resorts to bulk purchase of raw materials, taking nearby quarries on lease
from medium term perspective. All these initiatives help DBL save 4.8-5.0% on
EBITDA margins. This explains for the superior EBITDA margins of the company vs.
its peers.
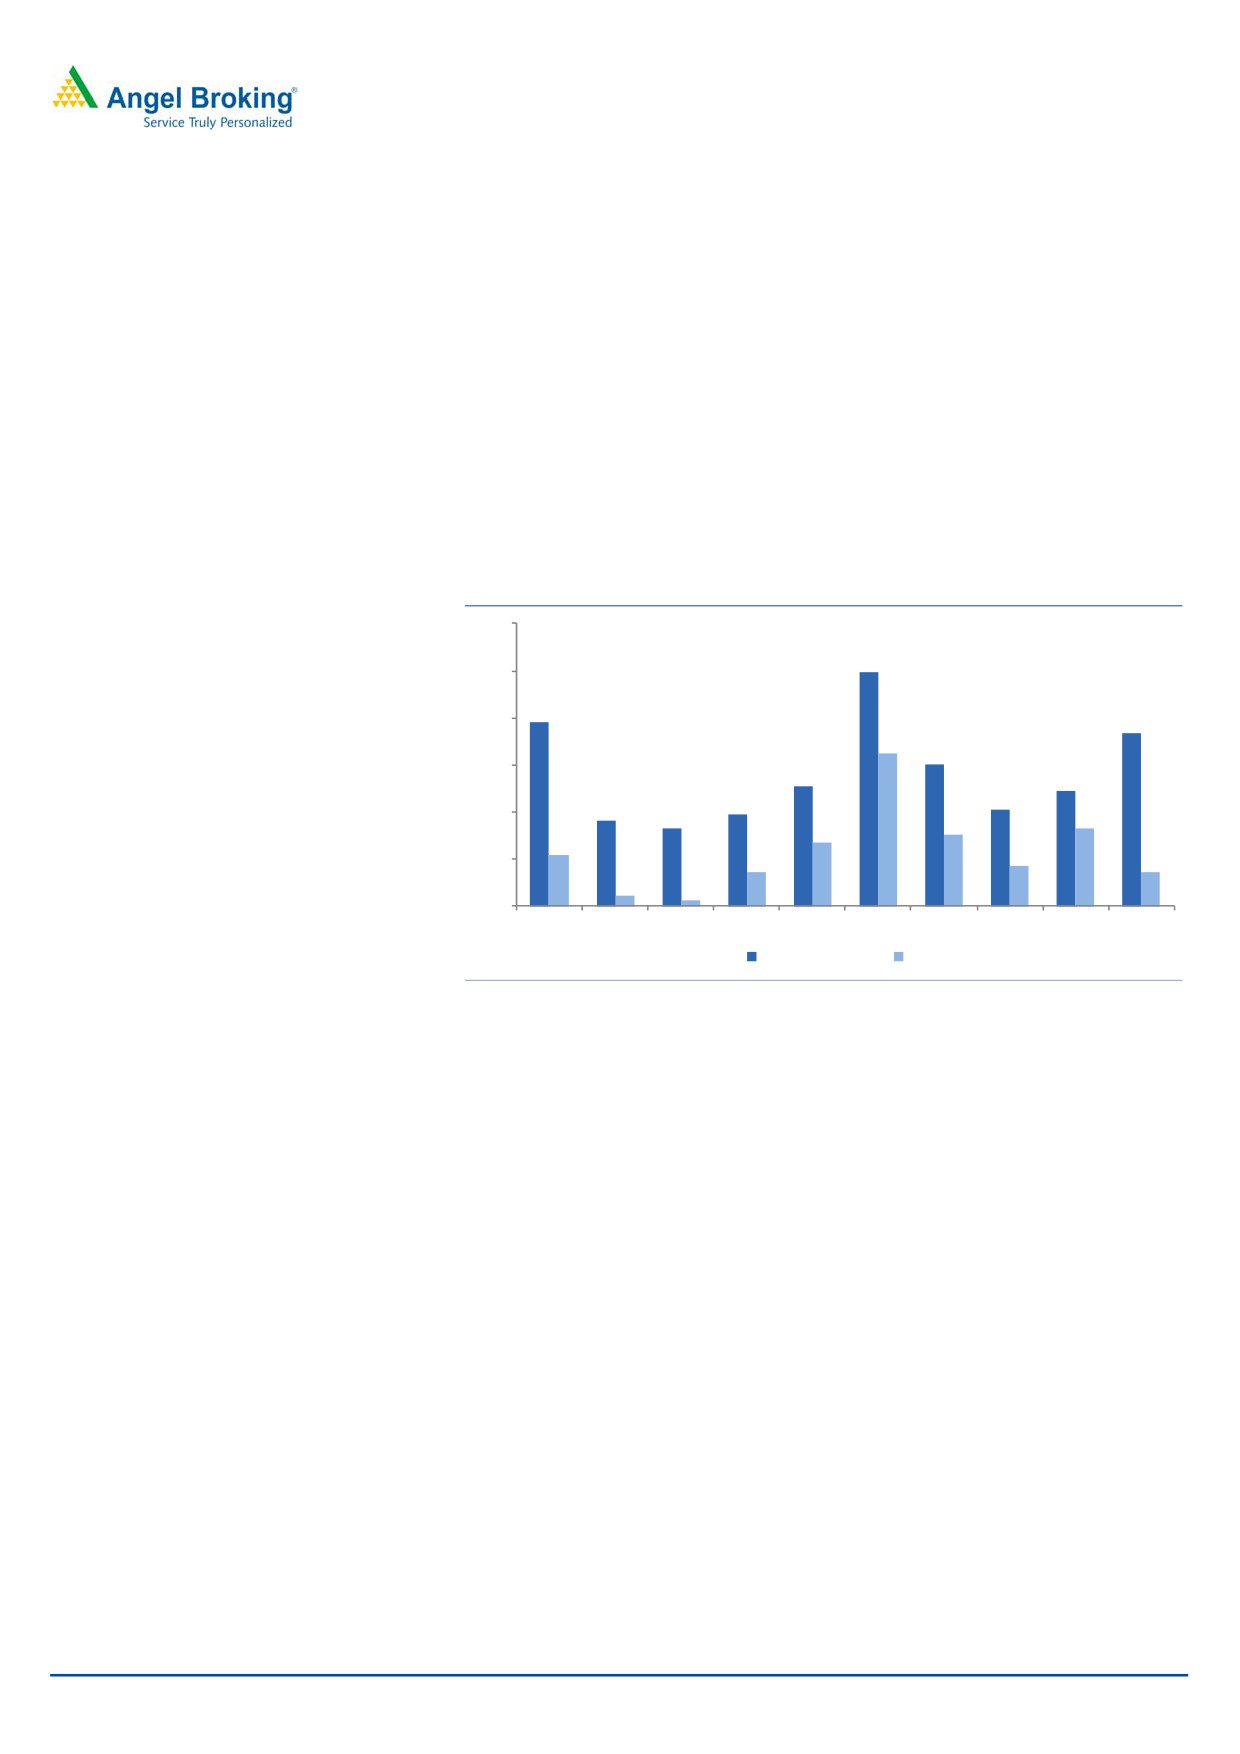
Exhibit 7: Enjoys superior margin profile to most of its peers...
30
24.8
25
19.6
20
18.4
16.2
15.1
15
12.7
12.3
9.7
10.2
9.1
10
8.2
8.3
7.6
6.8
5.4
4.2
3.7
3.6
5
1.1
0.7
0
DBL
Simplex
NCC MBL Infra. Ahluwalia KNR Con. J Kumar Sadbhav ABL (std.) ITNL (std.)
Infra.
FY2016 EBITDA %
FY2016 PAT %
Source: Company, Angel Research
Large fleet size of 7,345 vehicles held by DBL resulted in higher depreciation. As a
result, PAT margins of the company are lower than peers, despite the strong
EBITDA margin profile. DBL reported PAT margin of 5.4% in FY2016.
Scope for earnings growth potential during FY2016-18E…
We see multiple levers for DBL (standalone), which could help it report strong
earnings growth during FY2016-18E. DBL is currently having an Order Book of
`10,779cr (OB to LTM sales ratio stands at 2.6x). Considering 2-3 years for
execution of these road projects, we expect DBL to report ~20% top-line CAGR
during FY2016-18E.
On lowering EBITDA margin assumptions (to factor non-receipt of early completion
bonus), we expect DBL to report 15.7% EBITDA CAGR during FY2016-18E.
DBL at FY2016-end invested `1,465cr towards Plant & Machinery. With sales
growth outpacing incremental capex growth (`100cr for FY2017-18 each), there
exists scope for improvement in the asset leverage.
DBL at FY2016-end reported WC as % of sales ratio at 37.6%. DBL is expected to
use `200cr raised from IPO proceeds towards working capital funding. Stretch in
WC cycle for most of the BOT players is owing to SPV funding through short-term
loans and advances, whereas, DBL’s working capital stretch is owing to funding of
July 29, 201
5
Dilip Buildcon | IPO note
Inventory and Accounts Receivable. With improvement in collections cycle, we
expect 200-300 bps improvement in WC as % of sales ratio, going forward. DBL is
expected to use `202cr of IPO proceeds towards re-payment of term loans. We
expect future growth to be partly funded by debt, which on the back of improved
credit rating would be at cheaper rates. On a whole, we expect DBL to re-finance
its high cost debt with low cost debt. Accordingly, we see yearly `2cr of savings for
every 1% reduction in interest rate.
Scope for improvement in the Free Cash Flows…
Even though DBL (standalone) has generated healthy margins in the past, Free
Cash Flows (FCF) have been negative during FY2012-FY16, reflecting continuous
increase in the working capital requirements, higher interest costs (due to increase
in debt) and additions to gross block. Interestingly, DBL has been able to reduce
the Receivable days from 167 days in FY2015 to 111 days in FY2016, on the back
of (1) improvement in collection cycle for government orders and (2) resumption of
works at 2 of the delayed projects. Also, improvement in (1) government order
collection’s cycle and (2) inventory days should help in release of over `1,000cr in
FY2017E. Improved Cash flow from Operations (CFO) when coupled with lower
estimated capex of `100cr for FY2017-18, each should lead to improvement in
FCF during FY2017-18E. Strong FCF potential should help DBL in funding equity
requirement of its upcoming BOT projects (`650cr equity is required for next 3
years).
Exhibit 8: Working Capital Cycle to improve...
Exhibit 9: Cash Flow from Operations (` cr)
180
167
7,000
6,510
162
160
140
6,000
136
140
120
119
113
111
5,000
120
105
100
90
4,000
80
70
3,000
53
60
2,000
40
1,000
427
20
220
0
0
FY13
FY14
FY15
FY16
FY13
FY14
FY15
FY16
Inventory days
Receivables days
Payables days
(1,000)
(53)
Source: Company, Angel Research
Source: Company, Angel Research
Consol. D/E Ratio to decline post the IPO…
DBL (consol.) at FY2016 had debt of `3,221cr, reflecting D/E ratio of 3.2x. DBL is
expected to use `200cr of the IPO proceeds towards Working capital funding and
remaining `202cr towards Term loan repayments. Accordingly, consol. D/E ratio
would decline to ~2.0x.
Currently 12 of 18 BOT projects are operational (11 being Annuity/Annuity+Toll;
all 12 of them are 100% owned). Debt o/s at FY2016-end, towards these project
stands at `1,150cr. These projects reported FY2016 Annuity income of `207cr and
~`20cr of Toll Income. With ~90% EBITDA margins across these projects, there
exists strong case for the SPVs to repay ~`200cr yearly towards debt and interest
re-payments.
July 29, 201
6
Dilip Buildcon | IPO note
With equity raised from IPO being used to lower debt, when coupled with SPV level
debt repayments should lead to consol. Level D/E ratio declining, in the near-term.
However, with funding of BOT projects in the pipeline, should lead to gradual
increase in the consol. D/E ratio.
Mature Annuity Portfolio…augurs well for DBL
DBL entered the BOT space in Nov-2007, and currently has 18 BOT projects in its
portfolio. Of this 12 are already operational (with total investments of `1,571cr)
and 6 are under construction. 11 of 12 BOT projects have Annuity/ Annuity+Toll
model. Again 11 of these operational projects are awarded by Madhya Pradesh
Road Development Corporation (MPRDC). DBL recently won `1,012.9cr Guna-
Biora BOT project, first large ticket project from NHAI.
The Annuity portfolio gives assured cash flows and insulates the business from any
traffic related risks. Further, we are of view that the operational BOT projects have
reasonable IRRs. To-date, DBL has invested `370cr equity towards these 12 BOT
projects (accounts for 37% of consol. networth). These assets in FY2016 earned
Annual Income of `370cr and Toll income of `20cr. Notably, weighted average
Residual life of operational BOT projects is 12.1 years. This indicates that DBL’s
(current) operational Annuity projects have potential to collect yearly Annuity
Income of `2,500cr and Toll Income of `250+cr for remaining life of the asset.
July 29, 201
7
Dilip Buildcon | IPO note
Exhibit 10: BOT Projects Operational
Annual
Capital
Concession
TPC Length COD/ Residual
Project Company
Project
Type
Counterparty
Annuity
Inv.
period
(` in cr)
(km) PCOD Life (Yrs)
(` in cr)
(` in cr)
(Yrs)
DBL Nadiad Modasa
R & BD
Nadiad- Modasa
Annuity
35
29
14
208
108 Dec-13
10.3
Tollways Ltd.
GOG
DBL Bankhlafata
Bankhlafatta-
Dogawa Tollways
Annuity
MPRDC
20
16
15
116
65 Mar-14
12.4
Dogawa
Ltd.
DBL Jaora-Sailana
Jaora-Piploda
Annuity
MPRDC
24
20
15
134
88 May-14
12.3
Tollways Ltd
Suryavanshi
Infrastructure Private
Mandsaur- Sitamau Toll
MPRDC
-
6
25
35
44 Feb-09
16.6
Ltd.
DBL Sardarpur
Sardarpur-
Annuity
Badnawar Tollways
MPRDC
9
10
15
98
43 Jun-12
10.7
Badnawar
+ Toll
Ltd.
DBL Silwani
Annuity
Sultanganj Tollways
Silwani- Sultanganj
MPRDC
19
21
15
129
76 Mar-13
10.9
+ Toll
Ltd
DBL Sitamau-
Annuity
Suwasara Tollways
Sitamau- Suwasara
MPRDC
7
8
15
60
35 Mar-13
11.1
+ Toll
Ltd
DBL Mundi-
Annuity
Sanawad Tollways
Mundi- Sanawad
MPRDC
17
21
15
141
68 May-13
11.0
+ Toll
Ltd.
DBL Uchera- Nagod
Annuity
Uchera- Nagod
MPRDC
17
32
15
114
56 May-14
11.7
Tollways Ltd.
+ Toll
DBL Ashoknagar-
Annuity
Ashoknagar- Vidisha
MPRDC
10
20
15
85
36
Jul-14
12.6
Vidisha Tollways Ltd.
+ Toll
DBL Tikamgarh-
Tikamgarh (Dhajrai)
Annuity
Nowgaon Tollways
Jatara-Palera
MPRDC
18
26
15
130
76 May-15
13.4
+ Toll
Ltd.
Nowgaon
DBL Betul- Sarni
Betul Sarni
Annuity
MPRDC
31
81
15
322
124 May-15
13.0
Tollways Ltd.
Junnardeo- Parasia
+ Toll
Source: Company, Angel Research
Another `650cr of equity investments is
required for 6 BOT projects under
construction phase in the next 3 years.
Exhibit 11: BOT Projects Under Construction
Annual
Concession
TPC
Length
Counter-
Scheduled Residual
Project Company
Project
Type
Annuity
period
(` in
(km)
party
COD#
Life
(` in cr)
(Yrs)
cr)
(approx)
DBL Hata-Dargawan
Annuity +
Hata Fatehpur
MPRDC
14
15
87
64
Apr-18
15
Tollways Ltd.
Toll
Jalpa Devi
Guna-Biora
Toll
NHAI
Nil
26
715
94
Awaited
Awaited
Tollways Ltd.
DBL Patan Rehli
Annuity +
Patan-Tendukeda- Rehli
MPRDC
35
15
225
87
Apr-18
15
Tollways Ltd.
Toll
DBL Mundargi
Mundargi - Hadagali -
Harapanahalli
Annuity
KRDCL
35
10
157
51
Awaited
Awaited
Harapanahalli
Tollways Ltd.
DBL Hassan
Hassan - Ramanathapura -
Periyapatna
Annuity
KRDCL
53
10
220
74
Awaited
Awaited
Periyapatna
Tollways Ltd.
DBL Hirekerur
Ranibennur
Hirekerur - Ranibennur
Annuity
KRDCL
39
10
174
56
Awaited
Awaited
Tollways Ltd.
Source: Company, Angel Research
July 29, 201
8
Dilip Buildcon | IPO note
Risks & Concerns
1. DBL has entered 12 states and is executing 64+ projects in different states.
Madhya Pradesh currently accounts for 40% of its Order Book. With major
chunk of orders being executed outside the state, there exists scope for decline
in the margins on account of project execution delays.
2. DBL has guided for equity commitment of `650cr over the next 3 years for
construction of 6 BOT projects. We expect this requirement to be met by
internal accruals. Any inability to improve its free cash flow generation
potential could lead to increased dependency on the debt funding, which
in-turn could lead to Balance Sheet pressure.
3. There are few legal proceedings outstanding against DBL’s promoters, some
of the directors. Any negative outcome of these legal proceedings could affect
the growth prospects of the company.
July 29, 201
9
Dilip Buildcon | IPO note
Outlook and Valuation
During FY2012-16, DBL (standalone entity) reported 36.2% top-line and 22.1%
bottom-line CAGR, respectively. PAT CAGR during the same period was restricted
on account of higher depreciation and interest expenses. In order to grow its
financials during the same period, DBL built EPC order book by taking up NHAI,
MoRTH EPC projects and other state govt. BOT projects in its portfolio. With huge
pipeline of NHAI & MoRTH projects likely to be awarded in FY2017-18E, there
exists scope for new order inflows.
We expect the OB of DBL to report healthy 15.5% CAGR during FY2016-18E, from
the current level of `10,779cr. The Management has indicated that all projects are
running as per schedule while some of these are even ahead of schedule. On a
conservative basis, we are not factoring in any early project completion bonus for
the company going forward and hence expect FY2017-18E EBITDA margins to be
at ~18% levels. Further with improving fixed asset leverage, we expect the
standalone entity to report a 23.4% CAGR in profitability during FY2016-18E.
Considering DBL’s higher dependency on the Roads & Highways vertical, and
given its business mix and balance sheet size, we are considering 6 EPC players for
the purpose of peer group comparison.
To value the EPC business (capturing standalone business) on FY2016E numbers,
we adjusted the value of BOT projects from their current market price.
Exhibit 12: Peer group comparison
Particulars
FY16
Revenues
EBITDA Adj. PAT EBITDA (%) PAT (%) OB/LTM RoE (%)
Adj. P/E
CMP
M-Cap
(` in cr)
D/E (x)
FY16
FY16
FY16
FY16
FY16
(x)
FY16
FY16 (x)
DBL
219
1,327
2.0
4,085
799
220
19.6
5.4
2.6
22.4
7.8
Simplex Infra.
306
1,515
2.1
5,773
528
66
9.1
1.1
2.4
10.9
22.9
MBL Infra.
135
560
1.2
2,314
225
85
9.7
3.7
1.8
12.9
3.4
Ahluwalia Cont.
290
1,943
0.3
1,247
158
84
12.7
6.8
3.3
11.9
23.1
KNR Const.
592
1,666
0.2
993
246
161
24.8
16.2
3.5
22.2
8.1
J Kumar Infra.
218
1,647
0.3
1,366
206
103
15.1
7.6
2.3
8.0
15.9
PNC Infra.
563
2,885
0.0
2,014
266
243
13.2
12.1
2.9
17.8
9.9
Average
0.7
14.1
7.9
2.7
14.0
13.9
Source: Company, Angel Research; Note: Valued PowerMech is valued using post IPO shares o/s
At FY2016E EPS, DBL would trade at 7.8x its Adj. P/E multiple assuming that it lists
at the higher end of the issue price band. In our view, at such a valuation DBL
would trade at a discount to some of its peers and also lower than the peer
group’s average of 13.9x.
Considering the standalone entity’s attractive valuation and adding-up value of 12
operational BOT projects (valued at BV of 1.0x, adds up to `27/share), the issue
leaves space for an upside in the stock price, once listed. On looking at possible
catalysts, like (1) standalone entity’s growth potential (higher awarding from the
NHAI and MoRTH), and (2) the company’s strong margin and return profile, the
issue has the potential to generate good returns in the near-to-medium term.
Accordingly, we recommend SUBSCRIBE to the IPO.
July 29, 201
10
Dilip Buildcon | IPO note
Profit & Loss Statement (Consolidated)
Y/E March (` cr)
FY11
FY12
FY13
FY14
FY15
FY16
Net Sales
437
1,190
1,919
2,384
2,762
4,315
% Chg
172.3
61.3
24.2
15.9
56.2
Total Expenditure
344
926
1,446
1,859
2,075
3,320
Cost of Raw Materials Consumed
252
593
840
1,097
1,271
2,060
Change in Inventories of WIP
78
313
523
659
675
984
Employee benefits Expense
8
11
22
25
38
73
Other Expenses
6
9
61
77
91
203
EBITDA
93
264
473
525
687
996
% Chg
283.8
178.3
109.9
129.8
144.0
EBIDTA %
21.2
22.2
24.7
22.0
24.9
23.1
Depreciation
19
44
76
100
206
284
EBIT
76
223
405
442
487
745
% Chg
292.0
180.5
108.2
109.1
151.9
Interest and Financial Charges
17
59
115
201
354
514
Other Income
2
3
7
18
7
34
PBT
59
164
290
242
133
231
Tax
20
56
48
56
46
34
% of PBT
33.5
34.2
16.7
23.2
34.2
14.8
PAT before Exceptional item
39
108
241
186
88
197
Exceptional item
0
0
0
0
0
0
PAT
39
108
241
186
88
197
Minority Interest
(0)
(0)
0
0
0
0
PAT after Minority Interest
39
108
241
186
88
197
% Chg
275.0
222.2
76.0
46.2
223.3
PAT %
9.0
9.1
12.6
7.8
3.2
4.6
EPS (on pre-IPO shares o/s)
11.11
18.25
40.73
31.35
7.48
16.79
% Chg
163.3
222.2
76.0
22.9
223.3
July 29, 201
11
Dilip Buildcon | IPO note
Balance Sheet (Consolidated)
Y/E March (` cr)
FY11
FY12
FY13
FY14
FY15
FY16
Sources of Funds
Equity Capital
35
59
59
59
117
117
Reserves Total & Minority Int.
78
236
476
660
688
884
Networth
113
295
535
719
805
1,001
Total Debt
139
547
1,035
1,741
2,950
3,221
Other Long-term Liabilities
65
52
134
198
224
238
Deferred Tax Liability
6
14
15
36
75
101
Total Liabilities
323
908
1,718
2,694
4,054
4,562
Application of Funds
Net Block & Capital WIP
261
691
1,204
1,772
2,608
2,773
Goodwill
0
0
0
0
0
0
Current Assets
Inventories
64
197
363
522
948
1,580
Sundry Debtors
118
261
573
1,002
1,263
1,262
Cash and Bank Balance
48
96
55
73
267
116
Loans & Advances
55
66
130
103
197
366
Other Current Asset
0
0
0
0
0
0
Current Liabilities
224
497
677
874
1,538
1,825
Net Current Assets
62
123
444
826
1,136
1,499
Other Assets & Loans & Adv.
0
93
70
96
310
289
Total Assets
323
908
1,718
2,694
4,054
4,562
July 29, 201
12
Dilip Buildcon | IPO note
Cash Flow Statement (Consolidated)
Y/E March (` cr)
FY11
FY12
FY13
FY14
FY15
FY16
Profit before tax
59
164
290
242
133
231
Dep. & Other Non-cash Charges
19
43
75
98
212
287
Change in Working Capital
61
(138)
(262)
(281)
(255)
(430)
Interest & Financial Charges (net)
15
56
113
198
351
493
Direct taxes paid
(20)
(29)
(44)
(80)
(65)
(59)
Cash Flow from Operations
134
96
172
177
376
522
(Inc)/ Dec in Fixed Assets
(126)
(474)
(588)
(668)
(1,042)
(450)
(Inc)/ Dec in Investments
2
3
3
4
3
21
Cash Flow from Investing
(125)
(472)
(586)
(664)
(1,038)
(429)
Issue/ (Buy Back) of Equity
0
75
0
0
0
0
Inc./ (Dec.) in Loans
38
408
488
706
1,209
271
Dividend Paid (Incl. Tax)
(18)
(60)
(115)
(201)
(353)
(515)
Net Interest Expenses
0
0
0
0
0
0
Cash Flow from Financing
20
423
373
505
856
(244)
Inc./(Dec.) in Cash
30
48
(41)
18
194
(151)
Opening Cash balances
19
48
96
55
73
267
Closing Cash balances
48
96
55
73
267
116
July 29, 201
13
Dilip Buildcon | IPO note
Ratio Analysis (Consolidated)
Valuation Ratio (x) (on higher-band)
FY11
FY12
FY13
FY14
FY15
FY16
P/E (on FDEPS)
19.7
12.0
5.4
7.0
29.3
13.0
P/CEPS
44.2
16.9
8.1
9.0
8.7
5.3
Dividend yield (%)
0.0
0.0
0.0
0.0
0.0
0.0
EV/Sales
6.1
2.5
1.8
1.8
1.9
1.4
EV/EBITDA
28.7
11.4
7.5
8.1
7.6
6.1
EV/Total Assets
4.9
2.1
1.5
1.2
0.9
1.0
Per Share Data (`)
EPS (Adj.)
0.0
0.0
0.0
0.0
0.0
14.4
Cash EPS
5.0
13.0
27.1
24.4
25.1
41.0
DPS
0.0
0.1
0.1
0.1
0.1
0.0
Book Value
10
25
46
61
69
85
Returns (%)
RoCE (Pre-tax)
35.7
40.8
33.6
22.0
15.7
18.7
Angel RoIC (Pre-tax)
42.3
47.0
35.8
22.7
16.6
19.6
RoE
41.7
53.0
58.2
29.6
11.5
21.8
Turnover ratios (x)
Asset Turnover (Gross Block) (x)
1.1
1.2
1.0
0.8
0.6
0.7
Inventory (days)
27
40
53
68
97
107
Receivables (days)
74
58
79
121
150
107
Payables (days)
106
111
112
119
159
142
Leverage Ratios (x)
D/E ratio (x)
1.2
1.9
1.9
2.4
3.7
3.2
Interest Coverage Ratio (x)
4.4
3.8
3.5
2.2
1.4
1.4
July 29, 201
14
Dilip Buildcon | IPO note
Research Team Tel: 022 - 39357800
DISCLAIMER
Angel Broking Private Limited (hereinafter referred to as “Angel”) is a registered Member of National Stock Exchange of India Limited,
Bombay Stock Exchange Limited and Metropolitan Stock Exchange Limited. It is also registered as a Depository Participant with CDSL
and Portfolio Manager with SEBI. It also has registration with AMFI as a Mutual Fund Distributor. Angel Broking Private Limited is a
registered entity with SEBI for Research Analyst in terms of SEBI (Research Analyst) Regulations, 2014 vide registration number
INH000000164. Angel or its associates has not been debarred/ suspended by SEBI or any other regulatory authority for accessing
/dealing in securities Market. Angel or its associates/analyst has not received any compensation / managed or co-managed public
offering of securities of the company covered by Analyst during the past twelve months.
This document is solely for the personal information of the recipient, and must not be singularly used as the basis of any investment
decision. Nothing in this document should be construed as investment or financial advice. Each recipient of this document should
make such investigations as they deem necessary to arrive at an independent evaluation of an investment in the securities of the
companies referred to in this document (including the merits and risks involved), and should consult their own advisors to determine
the merits and risks of such an investment.
Reports based on technical and derivative analysis center on studying charts of a stock's price movement, outstanding positions and
trading volume, as opposed to focusing on a company's fundamentals and, as such, may not match with a report on a company's
fundamentals. Investors are advised to refer the Fundamental and Technical Research Reports available on our website to evaluate the
contrary view, if any.
The information in this document has been printed on the basis of publicly available information, internal data and other reliable
sources believed to be true, but we do not represent that it is accurate or complete and it should not be relied on as such, as this
document is for general guidance only. Angel Broking Pvt. Limited or any of its affiliates/ group companies shall not be in any way
responsible for any loss or damage that may arise to any person from any inadvertent error in the information contained in this report.
Angel Broking Pvt. Limited has not independently verified all the information contained within this document. Accordingly, we cannot
testify, nor make any representation or warranty, express or implied, to the accuracy, contents or data contained within this document.
While Angel Broking Pvt. Limited endeavors to update on a reasonable basis the information discussed in this material, there may be
regulatory, compliance, or other reasons that prevent us from doing so.
This document is being supplied to you solely for your information, and its contents, information or data may not be reproduced,
redistributed or passed on, directly or indirectly.
Neither Angel Broking Pvt. Limited, nor its directors, employees or affiliates shall be liable for any loss or damage that may arise from
or in connection with the use of this information.
July 29, 201
15