2QFY2016 Result Update | Pharmaceutical
November 9, 2015
Cipla
NEUTRAL
CMP
`658
Performance Highlights
Target Price
-
Y/E March (` cr)
2QFY2016 1QFY2016
% chg qoq 2QFY2015
% chg yoy
Investment Period
-
Net sales
3,362
3,777
(11.0)
2,630
27.8
Other income
117
125
(6.4)
161
(27.5)
Gross profit
2,145
2,525
(15.1)
1,614
32.9
Stock Info
Operating profit
699
963
(27.4)
421
66.0
Sector
Pharmaceutical
Adj. Net profit
431
651
(33.7)
299
44.4
Market Cap (` cr)
52,840
Source: Company, Angel Research
Net Debt (` cr)
498
For 2QFY2016, Cipla posted numbers more or less in line with our expectations
Beta
1.1
on the sales and net profit front while beating our estimates on the OPM front.
52 Week High / Low
752/572
The company posted sales of `3,362cr V/s `3,343cr expected and V/s `2,630cr
Avg. Daily Volume
181,233
in 2QFY2015, a yoy growth of 27.8%. On the operating front, the OPM came in
Face Value (`)
2
at 20.8% V/s 16.0% in 2QFY2015 and V/s an expected 19.7%, driven by gross
BSE Sensex
26,265
margin expansion and higher sales growth. Thus, the Net Profit came in at
Nifty
7,954
`432cr V/s an expected `458cr and V/s `299cr in 2QFY2015, a yoy growth of
Reuters Code
CIPL.BO
44.4%. The Management reiterated its guidance of sales growth of 22% in
FY2016 and EBDITA margin improvement of 100-150bp. We currently have a
Bloomberg Code
CIPLA@IN
Neutral rating on the stock.
Results better than expectations on the OPM front: The company posted sales of
Shareholding Pattern (%)
`3,362cr V/s `3,343cr expected and V/s `2,630cr in 2QFY2015, a yoy growth
Promoters
36.8
of 27.8%. The growth on the top-line came through a 52.3% yoy growth in
MF / Banks / Indian Fls
16.3
exports driven by formulation exports (on back of generic Nexium). Export API,
FII / NRIs / OCBs
28.3
on the other hand posted a 61.4% yoy growth during the quarter. Domestic
Indian Public / Others
18.6
formulation (`1,262cr) posted a flat growth of 0.9% yoy. On the operating front,
the gross margins came in at 63.8% V/s 61.4% in 2QFY2015, leading to margin
expansion. The OPM came in at 20.8% V/s 16.0% in 2QFY2015 and V/s an
Abs. (%)
3m 1yr
3yr
expected 19.7%, driven by gross margin expansion and higher sales growth.
Sensex
(7.2)
(5.9)
39.6
However, inspite of a 66.0% rise in operating profit, the PAT rose only by 44.4% yoy,
Cipla
(9.0)
0.1
66.0
on back of an 80.0% yoy rise in tax expenses. Thus, the net profit came in at `432cr
V/s `458cr expected and V/s `299cr in 2QFY2015, a yoy growth of 44.4%.
3-Year Daily Price Chart
Outlook and valuation: We expect the company to post a 19.2% CAGR in net
800
700
sales to `16,611cr and EPS to record a 21.4% CAGR to `28.9 over FY2015-
600
17E. The growth in the top-line would be driven by domestic formulation sales
500
400
and exports. We maintain our Neutral stance on the stock.
300
Key financials (Consolidated)
200
100
Y/E March (` cr)
FY2014
FY2015
FY2016E
FY2017E
0
Net sales
9,753
11,681
14,121
16,611
% chg
20.6
19.8
20.9
17.6
Adj. Net profit
1,388
1,578
2,172
2,324
% chg
(8.9)
13.6
37.7
7.0
Source: Company, Angel Research
EPS (`)
17.3
19.6
27.0
28.9
EBITDA margin (%)
18.3
17.7
20.6
19.0
P/E (x)
38.1
33.5
24.4
22.8
RoE (%)
14.6
15.1
18.4
16.8
RoCE (%)
12.8
12.9
17.6
17.1
P/BV (x)
5.3
4.9
4.1
3.5
Sarabjit Kour Nangra
EV/Sales (x)
5.5
4.6
3.7
3.1
+91 22 3935 7600 Ext: 6806
EV/EBITDA (x)
30.1
26.0
18.2
16.4
Source: Company, Angel Research; Note: CMP as of November 6, 2015
Please refer to important disclosures at the end of this report
1
Cipla | 2QFY2016 Result Update
Exhibit 1: 2QFY2016 ( Consolidated) performance
Y/E March (` cr)
2QFY2016
1QFY2016
% chg qoq 2QFY2015
% chg yoy 1HFY2016 1HFY2015
% chg yoy
Net sales
3,362
3,777
(11.0)
2,630
27.8
7,139
5,277
35.3
Other income
116.6
124.6
(6.4)
160.8
(27.5)
241.2
274.0
(12.0)
Total income
3,479
3,902
(10.8)
2,791
24.6
7,380
5,551
33.0
Gross profit
2145
2525
(15.1)
1614
32.9
4670
3236
44.3
Gross margin
63.8
66.9
61.4
65.4
61.3
Operating profit
699
963
(27.4)
421
66.0
1662
891
86.5
OPM (%)
20.8
25.5
16.0
23.3
16.9
Interest
50.3
51.4
(2.1)
46.9
7.2
102
80.0
27.0
Depreciation
134
129
4.0
122
9.8
263
247
6.4
PBT
631
908
(30.4)
413
52.9
1,539
838
83.6
Provision for taxation
181
250
(27.6)
101
80.0
432
203
112.6
PAT before extra-ordinary item
450
657
(31.5)
312
44.1
1,107
635
74.4
Share of Profit /( loss ) of asso.
(19)
(6)
(13)
(25)
(40)
Extra-ordinary items/(income)
0
1
0
0
0
PAT after extra-ordinary item
431
651
(33.7)
299
44.4
1,082
593
82.4
Adj. PAT
431
651
(33.7)
299
44.4
1,082
593
82.4
EPS (`)
5.4
8.1
3.7
13.5
7.4
Source: Company, Angel Research
Exhibit 2: 2QFY2016 - Actual vs. Angel estimates
(` cr)
Actual
Estimates
Variance
Net sales
3,362
3,343
0.6
Other income
117
125
(6.4)
Operating profit
699
658
6.3
Tax
181
131
38.4
Net profit
431
458
(5.8)
Source: Company, Angel Research
Top-line growth almost in line with expectation
The company posted sales of `3,362cr V/s `3,343cr expected and V/s `2630cr in
2QFY2015, a yoy growth of 27.8%. The growth in top-line came through a 52.3%
yoy growth in exports (`2100cr) driven by formulation exports (on back of generic
nexium). Export API, on the other hand posted a 61.4% yoy growth during the
quarter. Domestic formulation (`1,262cr) posted a flat growth of 0.9% yoy.
Domestic sales grew 0.9% yoy to `1,262cr, which is in line with industry growth.
The India business contributed 37.5% to overall sales. Export formulations posted a
growth of 51.3% yoy to `1,874cr, while API exports posted a growth of 61.4% to
`226cr V/s `140cr in the corresponding period of last year. Formulations now
constitute 84.8% of sales of the company.
Overall, exports contributed 62.5% to overall sales (V/s 52.4% in 2QFY2015),
while domestic sales contributed the rest.
November 9, 2015
2
Cipla | 2QFY2016 Result Update
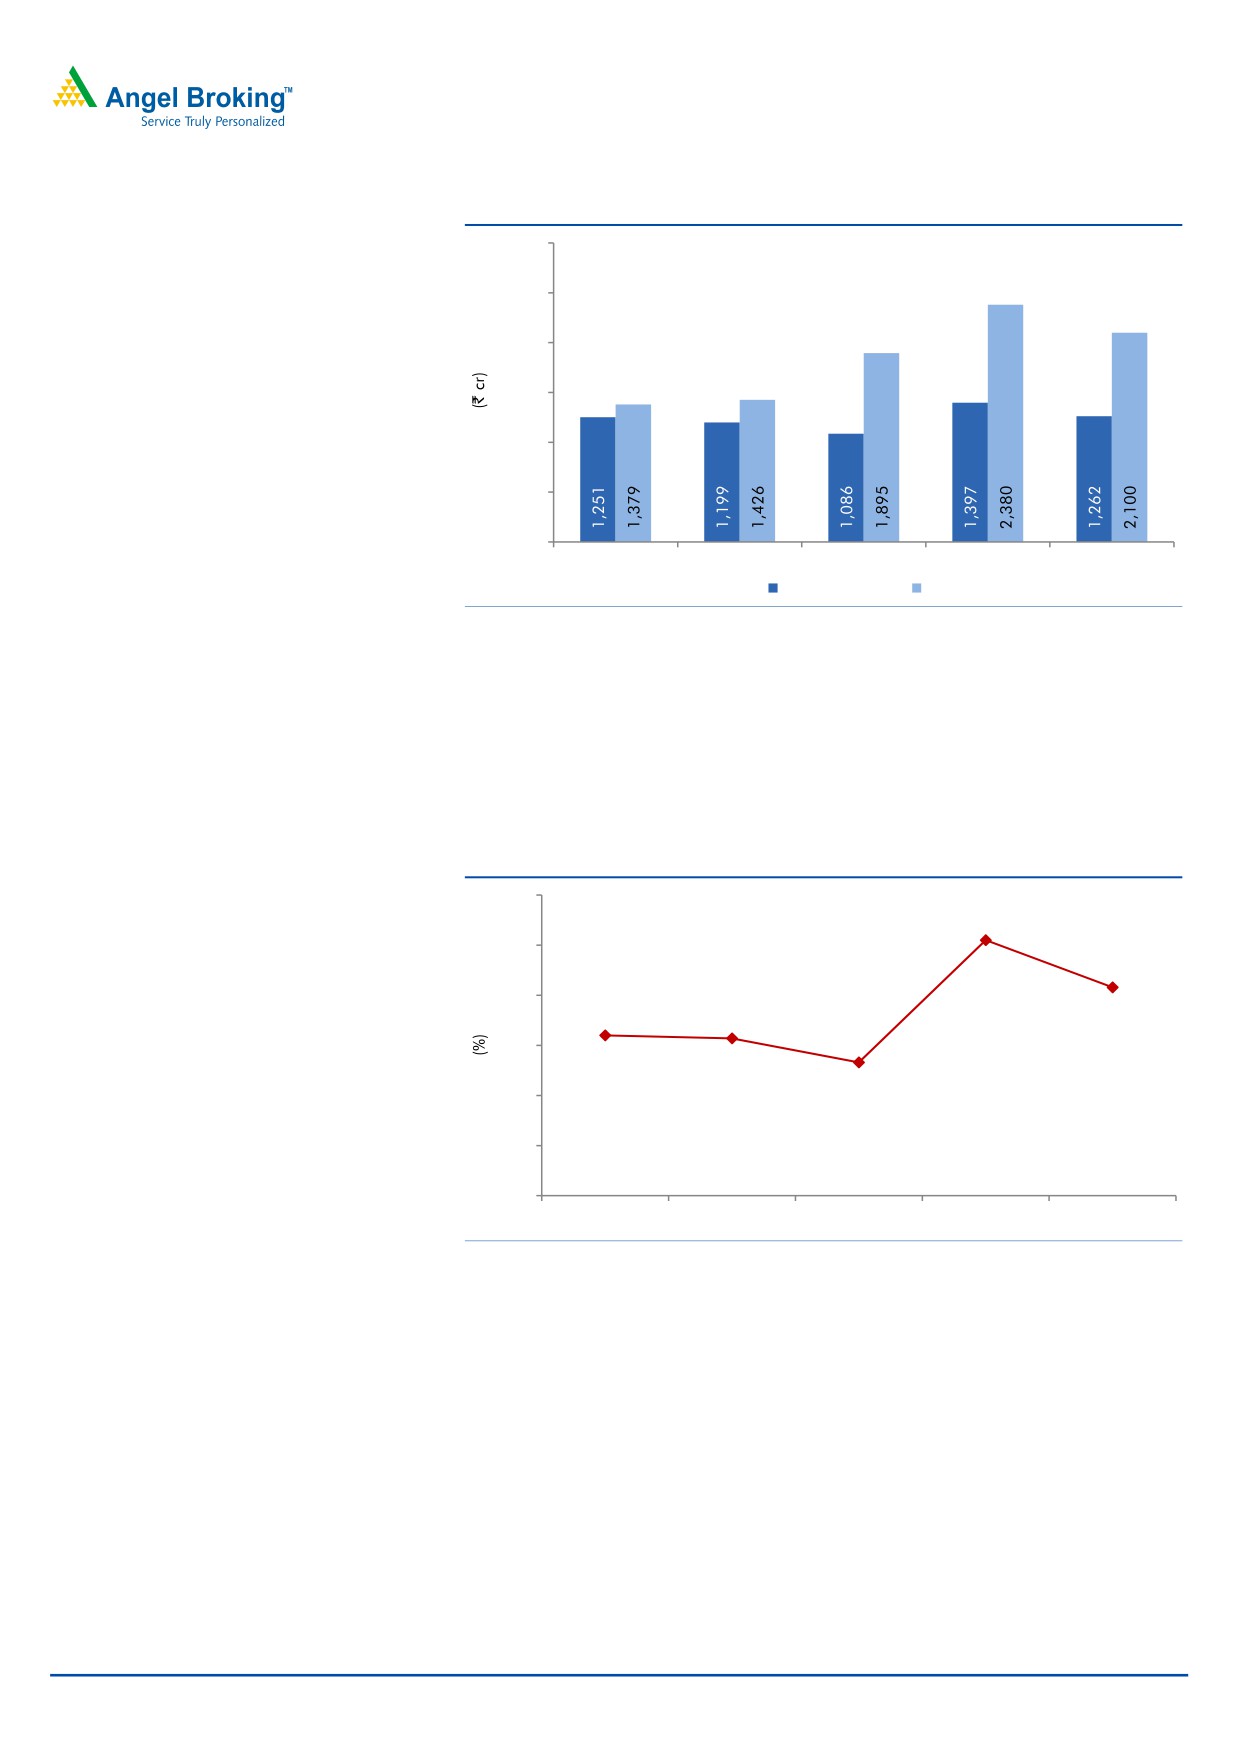
Exhibit 3: Sales Trend
3,000
2,500
2,000
1,500
1,000
500
0
2QFY2015
3QFY2015
4QFY2015
1QFY2016
2QFY2016
Domestic
Export
Source: Company
Operating profit margin better than expected
On the operating front, the gross margins came in at 63.8% V/s 61.4% in
2QFY2015, leading to margin expansion. The OPM came in at 20.8% V/s 16.0%
in 2QFY2015 and V/s an expected 19.7%, driven by gross margin expansion and
higher sales growth.
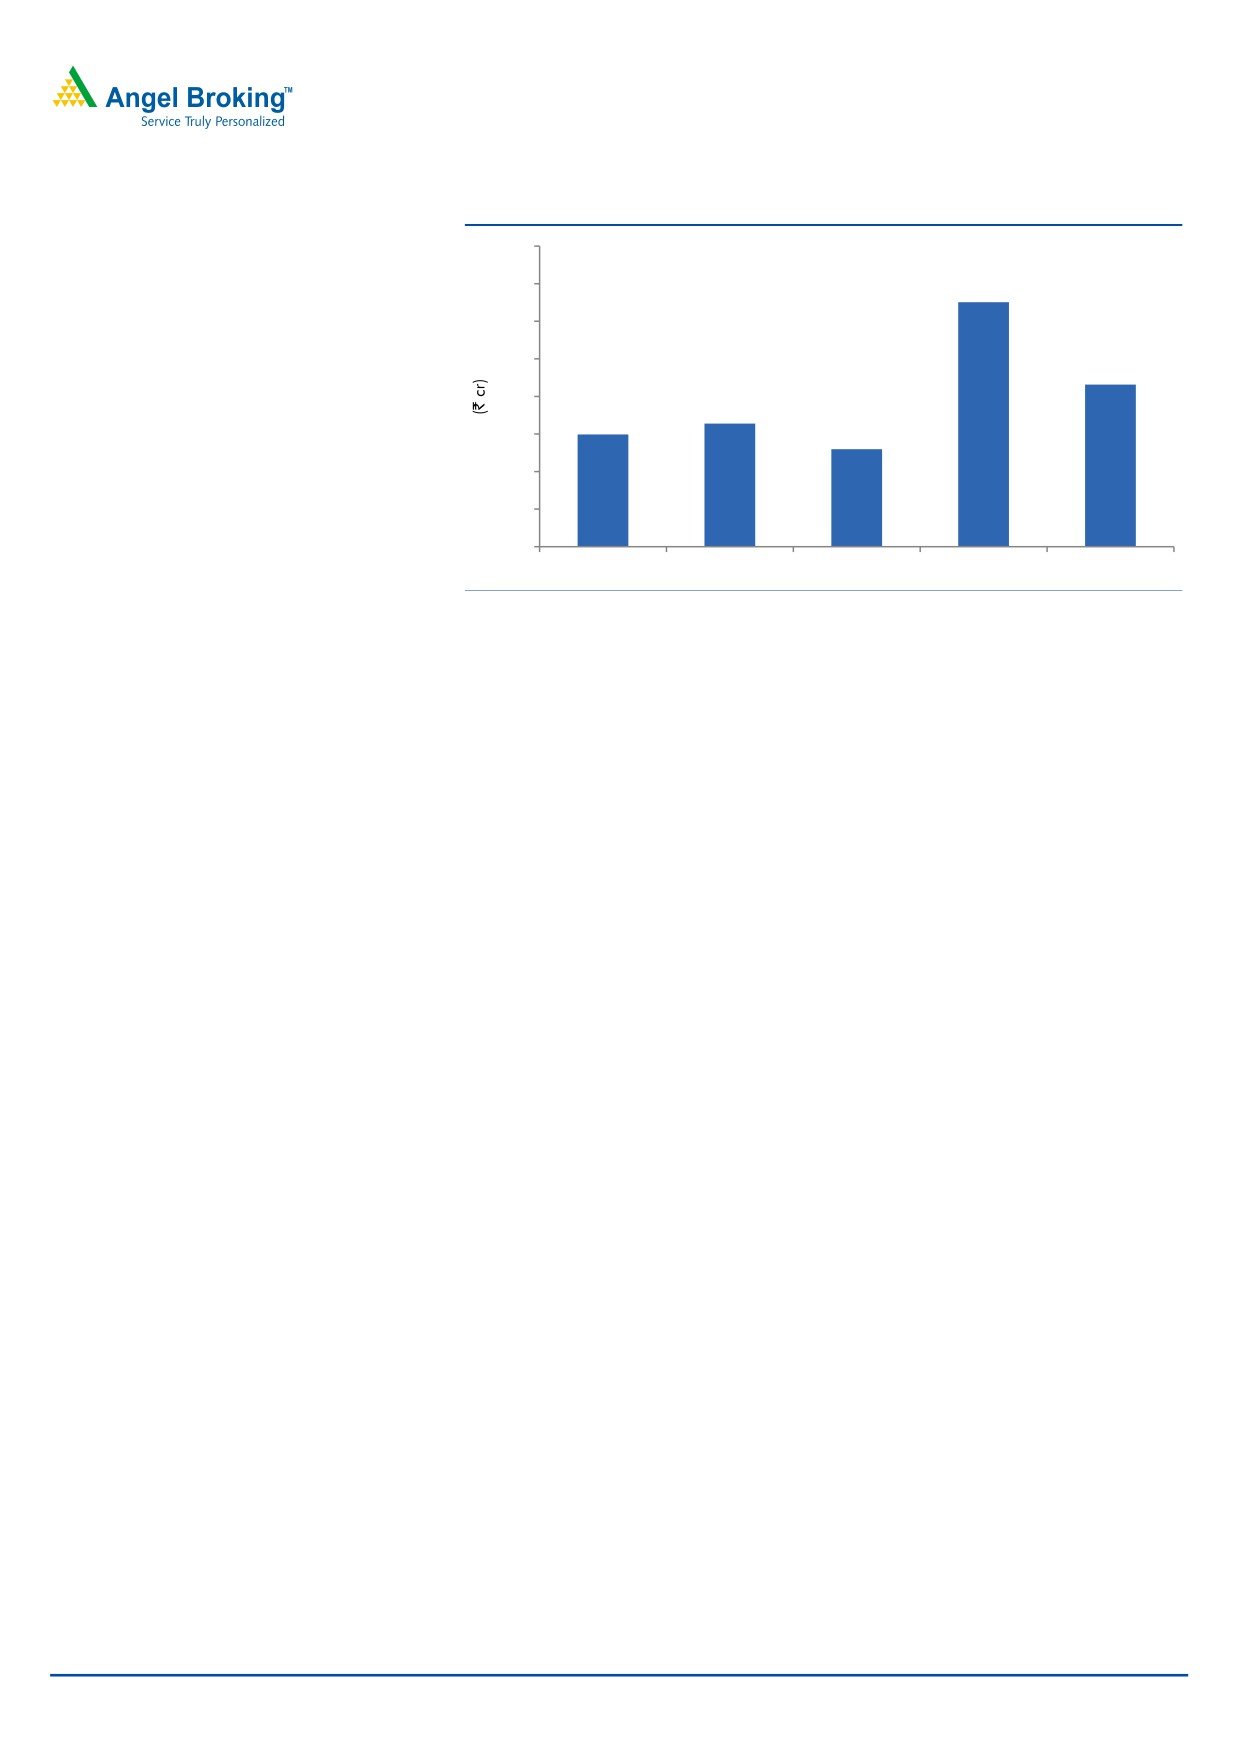
Exhibit 4: OPM Trend
30.0
25.5
25.0
20.8
20.0
16.0
15.0
15.7
13.3
10.0
5.0
0.0
2QFY2015
3QFY2015
4QFY2015
1QFY2016
2QFY2016
Source: Company
Net profit lower than expectation
However, inspite of a 66.0% rise in operating profit, the PAT rose only by 44.5%
yoy, on back of an 80.0% yoy rise in tax expenses. Thus, the Net Profit came in at
`432cr V/s `458cr expected and V/s `299cr in 2QFY2015, a yoy growth of
44.4%.
November 9, 2015
3
Cipla | 2QFY2016 Result Update
Exhibit 5: Net Profit Trend
800
700
651
600
500
431
400
328
299
300
260
200
100
0
2QFY2015
3QFY2015
4QFY2015
1QFY2016
2QFY2016
Source: Company
Concall takeaways
The Management reiterated its guidance of sales growth of 22% in FY2016
and EBDITA improvement of 100-150bps.
The Management guided for at least 10 products; combination of genericized
and first time launches in the US over the next 12-18 months via its own front
end in addition to undisclosed launches with partners.
Domestic sales declined due to rationalization of generic portfolio which
constitutes around 20% of the domestic business. As per the Management, the
prescription business witnessed growth in mid-teens and expects it to grow by
16% in 2HFY2016.
Recommendation rationale
Export segment to be the growth driver: Cipla exports to more than 180 countries,
with growth coming through marketing alliances and distribution tie-ups in various
markets. Exports contributed 53% to the total turnover in FY2015, with Africa, US
and Latin America constituting more than ~60% of total exports. In the US, Cipla
has a strong product pipeline of 147 ANDAs, out of which, 79 are approved.
Another long term growth driver for the company is the launch of the CFC-free
inhalers in the regulated markets. CFC-free inhalers in Europe and US address a
potential market size of more than US$3bn.
During the quarter, the company strengthened its foothold in the US through the
acquisition of InvaGen Pharma and Exelan Pharma. The companies added a
pipeline of ~70 ANDAs, of which 40 are approved (32 marketed) and 30
awaiting approval. The company is likely to add over USD250mn in FY2017. The
deal is expected to conclude by December 2015. It will also provide manufacturing
capabilities in the US. Overall, we expect the company’s exports to grow at a
CAGR of 23.5% during FY2015-17E.
Increasing penetration in the domestic market: Cipla is one of the largest players
in the domestic formulation market, with a market share of around
5.3%.
Domestic formulations contributed 43% to the company’s total turnover in FY2015.
November 9, 2015
4
Cipla | 2QFY2016 Result Update
The company is the market leader in key therapeutic areas such as respiratory
care, anti-viral and urological. Cipla’s distribution network in India consists of a
field force of around 7,000-8,000 employees. The company plans to increase its
focus on domestic markets with new therapies such as oncology and neuro-
psychiatry in the offing. The company plans to focus on growing its market share
and sales by increasing penetration in the Indian market, especially in rural areas,
and plans to expand its product portfolio by launching biosimilars, particularly
relating to the oncology, anti-asthmatic and anti-arthritis categories. Overall we
expect the company’s domestic formulation business to post a CAGR of 12.5%
over FY2015-17E, on back of muted 1HFY2016 performance.
Valuation: We expect the company to post a 19.2% CAGR in net sales to
`16,611cr and EPS to record a 21.4% CAGR to `28.9 over FY2015-17E. The
growth in the top-line would be driven by domestic formulation sales and exports.
We maintain our Neutral stance on the stock.
Exhibit 6: Key assumptions
Key assumptions
FY2016E
FY2017E
Domestic growth (%)
10.0
15.0
Exports growth (%)
28.0
19.2
Growth in employee expenses (%)
20.0
22.0
Operating margins (excl tech. know-how fees) (%)
20.6
19.0
Source: Company, Angel Research
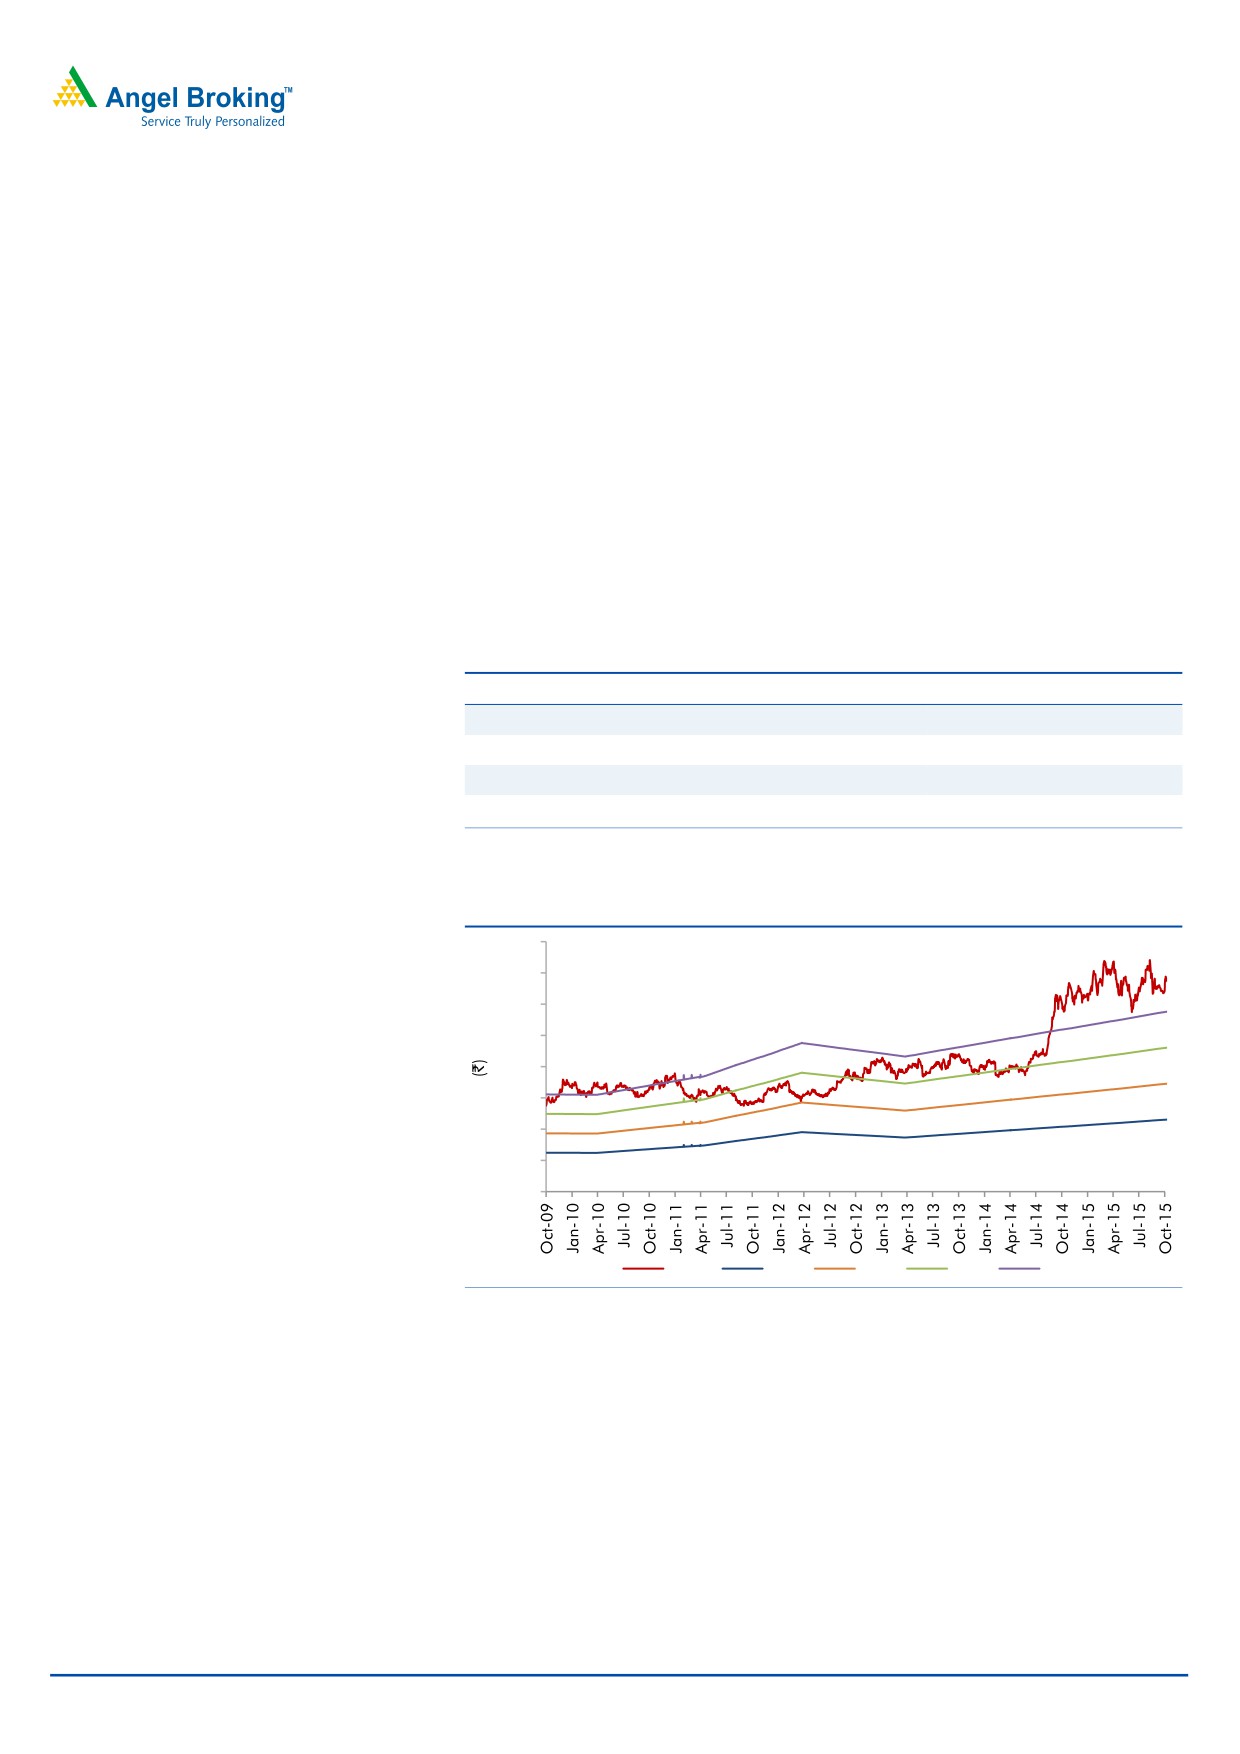
Exhibit 7: One-year forward PE band
800
700
600
500
400
300
200
100
-
Price
10x
15x
20x
25x
Source: Company, Angel Research
November 9, 2015
5
Cipla | 2QFY2016 Result Update
Exhibit 8: Recommendation Summary
Company
Reco
CMP Tgt. price Upside
FY2017E
FY15-17E
FY2017E
(`)
(`)
% PE (x) EV/Sales (x) EV/EBITDA (x) CAGR in EPS (%) RoCE (%) RoE (%)
Alembic Pharma
Neutral
675
-
-
28.3
4.0
20.0
26.2
31.5
31.8
Aurobindo Pharma Accumulate
820
872
6.3
18.8
3.0
13.2
16.3
23.4
30.2
Cadila Healthcare Neutral
429
-
-
24.4
3.7
16.7
24.6
25.2
29.0
Cipla
Neutral
659
-
-
22.8
3.1
16.4
21.4
17.1
16.8
Dr Reddy's
Neutral
4,253
-
-
22.1
3.3
14.7
21.6
20.6
22.0
Dishman Pharma Neutral
402
-
-
18.6
1.7
8.6
20.4
11.7
11.7
GSK Pharma*
Neutral
3,191
-
-
46.7
8.1
36.9
6.6
33.7
34.3
Indoco Remedies
Neutral
310
-
-
22.4
2.4
13.4
23.0
19.7
19.7
Ipca labs
Buy
733
900
22.7
26.2
2.6
14.0
26.1
13.0
14.9
Lupin
Neutral
1,838
-
-
25.8
4.4
16.5
9.7
27.9
23.4
Sanofi India*
Neutral
4,276
-
-
28.2
3.7
17.6
33.1
27.9
25.5
Sun Pharma
Buy
816
950
16.4
30.3
5.3
17.4
8.4
15.8
16.6
Source: Company, Angel Research; Note: * December year ending
November 9, 2015
6
Cipla | 2QFY2016 Result Update
Company Background
Cipla is a leading pharmaceutical company in India with a strong presence in
both, the export and domestic markets. On the exports front, where it follows the
partnership model, it has 5,700 product registrations in around 180 countries.
Cipla is a market leader in the domestic formulation market with ~5.3% market
share. The company is likely to continue on the growth trajectory owing to its entry
into the inhalers market in the EU and potential new long-term manufacturing
contracts with Global Innovators.
November 9, 2015
7
Cipla | 2QFY2016 Result Update
Profit & loss statement (Consolidated)
Y/E March (` cr)
FY2012
FY2013
FY2014
FY2015
FY2016E
FY2017E
Gross sales
6,956
8,196
9,902
11,861
14,338
16,867
Less: Excise duty
108.1
108.7
149.3
179.7
217.2
255.5
Net sales
6,848
8,087
9,753
11,681
14,121
16,611
Other operating income
173
193
348
348
348
348
Total operating income
7,021
8,279
10,100
12,029
14,469
16,959
% chg
11.0
17.9
22.0
19.1
20.3
17.2
Total expenditure
5,362
6,081
7,967
9,612
11,214
13,460
Net raw materials
2,739
2,953
3,875
4,556
5,295
6,478
Other mfg costs
705
641
827
993
1,142
1,313
Personnel
773
1,036
1,543
2,083
2,499
3,049
Other
1,145
1,451
1,722
1,981
2,278
2,620
EBITDA
1,486
2,005
1,786
2,069
2,907
3,151
% chg
9.1
35.0
(11.0)
15.9
40.5
8.4
(% of Net Sales)
21.7
24.8
18.3
17.7
20.6
19.0
Depreciation & amort.
312
330
373
457
502
544
EBIT
1,174
1,675
1,413
1,613
2,405
2,608
% chg
7.8
42.7
(15.6)
14.1
49.1
8.4
(% of Net Sales)
17.1
20.7
14.5
13.8
17.0
15.7
Interest & other charges
38
34
146
85
85
85
Other Income
176
235
266
266
266
266
(% of PBT)
11.9
11.4
14.1
12.4
9.1
8.5
Recurring PBT
1,485
2,069
1,881
2,141
2,934
3,136
% chg
27.2
39.3
(9.1)
13.8
37.0
6.9
Extraordinary exp./(Inc.)
36.9
(26.7)
-
-
-
-
PBT (reported)
1,448
2,095
1,881
2,141
2,934
3,136
Tax
306.5
544.3
463.4
535.3
733.4
784.0
(% of PBT)
21.2
26.0
24.6
25.0
25.0
25.0
PAT (reported)
1,141
1,551
1,417
1,606
2,200
2,352
Add: Share of earnings of asso.
3
(6)
(12)
(12)
(12)
(11)
Less: Minority interest (MI)
-
-
16
16
16
17
Prior period items
-
-
-
-
-
1
PAT after MI (reported)
1,144
1,545
1,388
1,578
2,172
2,324
ADJ. PAT
1,173
1,524
1,388
1,578
2,172
2,324
% chg
18.1
30.0
(8.9)
13.6
37.7
7.0
(% of Net Sales)
16.7
19.1
14.2
13.5
15.4
14.0
Basic EPS (`)
14.6
19.0
17.3
19.6
27.0
28.9
Fully Diluted EPS (`)
14.6
19.0
17.3
19.6
27.0
28.9
% chg
18.1
30.0
(8.9)
13.6
37.7
7.0
November 9, 2015
8
Cipla | 2QFY2016 Result Update
Balance sheet (Consolidated)
Y/E March (` cr)
FY2012
FY2013
FY2014
FY2015
FY2016E
FY2017E
SOURCES OF FUNDS
Equity share capital
161
161
161
161
161
161
Preference Capital
-
-
-
-
-
-
Reserves & surplus
7,478
8,858
9,890
10,629
12,613
14,749
Shareholders funds
7,639
9,019
10,050
10,801
12,773
14,909
Minority interest
-
-
50
180
180
180
Total loans
29.2
966.9
1,247.9
1,701.8
700.0
701.0
Other long term liabilities
30.0
30.0
32.6
32.6
32.6
32.6
Long Term Provisions
31.2
50.4
77.4
168.4
168.4
168.4
Deferred tax liability
233.2
280.5
309.0
284.6
284.6
284.6
Total liabilities
7,963
10,347
11,767
13,169
14,139
16,276
APPLICATION OF FUNDS
Gross block
4,626
5,318
6,183
6,868
7,468
8,068
Less: acc. depreciation
1,411
1,708
2,180
2,634
3,136
3,679
Net block
3,215
3,610
4,003
4,234
4,332
4,388
Capital work-in-progress
371
378
442
442
442
442
Goodwill
-
2,493
2,735
2,735
2,735
Investments
1,269
2,532
709
640
640
640
Long Term Loans and Adv.
378
363
301
419
436
513
Current assets
4,116
4,775
5,340
7,201
7,955
10,382
Cash
90
143
175
564
471
1,578
Loans & advances
568
573
596
701
847
997
Others
3,458
4,058
4,569
5,936
6,637
7,807
Current liabilities
1,387
1,311
1,634
2,501
2,401
2,824
Net current assets
2,729
3,464
3,706
4,700
5,555
7,558
Mis. Exp. not written off
-
-
112
-
-
-
Total assets
7,962
10,347
11,767
13,169
14,140
16,276
November 9, 2015
9
Cipla | 2QFY2016 Result Update
Cash flow statement (Consolidated)
Y/E March (` cr)
FY2012
FY2013
FY2014
FY2015
FY2016E FY2017E
Profit before tax
1,448
2,095
1,881
2,141
2,934
3,136
Depreciation
312
330
373
457
502
544
(Inc)/Dec in Working Capital
370
(667)
(149)
(722)
(965)
(973)
Direct taxes paid
275
518
431
537
906
-
Cash Flow from Operations
1,855
1,241
1,673
1,339
1,564
2,706
(Inc.)/Dec.in Fixed Assets
(472)
(698)
(930)
(684)
(600)
(600)
(Inc.)/Dec. in Investments
(678)
(1,263)
1,824
69
-
-
Other income
-
-
-
-
-
-
Cash Flow from Investing
(1,150)
(1,961)
894
(616)
(600)
(600)
Issue of Equity
-
-
-
-
-
-
Inc./(Dec.) in loans
(482)
957
311
545
(1,002)
1
Dividend Paid (Incl. Tax)
(187)
(188)
(188)
(188)
(188)
(188)
Others
(42)
4
(2,658)
(692)
132
(812)
Cash Flow from Financing
(711)
773
(2,535)
(335)
(1,058)
(999)
Inc./(Dec.) in Cash
(6)
53
32
389
(93)
1,107
Opening Cash balances
96
90
143
175
564
471
Closing Cash balances
90
143
175
564
471
1,578
November 9, 2015
10
Cipla | 2QFY2016 Result Update
Key Ratio
Y/E March
FY2012
FY2013
FY2014
FY2015
FY2016E
FY2017E
Valuation Ratio (x)
P/E (on FDEPS)
45.1
34.7
38.1
33.5
24.4
22.8
P/CEPS
36.3
28.2
30.0
26.0
19.8
18.5
P/BV
6.9
5.9
5.3
4.9
4.1
3.5
Dividend yield (%)
0.3
0.3
0.3
0.3
0.3
0.3
EV/Sales
7.7
6.6
5.5
4.6
3.7
3.1
EV/EBITDA
35.3
26.6
30.1
26.0
18.2
16.4
EV / Total Assets
6.6
5.2
4.6
4.1
3.7
3.2
Per Share Data (`)
EPS (Basic)
14.6
19.0
17.3
19.6
27.0
28.9
EPS (fully diluted)
14.6
19.0
17.3
19.6
27.0
28.9
Cash EPS
18.1
23.4
21.9
25.3
33.3
35.7
DPS
2.0
2.0
2.0
2.0
2.0
2.0
Book Value
95.1
112.3
125.2
134.5
159.1
185.7
Dupont Analysis
EBIT margin
17.1
20.7
14.5
13.8
17.0
15.7
Tax retention ratio
78.8
74.0
75.4
75.0
75.0
75.0
Asset turnover (x)
0.9
0.9
0.9
1.0
1.1
1.2
ROIC (Post-tax)
12.5
14.0
10.1
10.3
14.1
14.1
Cost of Debt (Post Tax)
10.1
5.0
9.9
4.3
5.3
9.1
Leverage (x)
0.0
0.0
0.1
0.0
0.0
1.0
Operating ROE
12.5
14.4
10.1
10.3
14.1
19.0
Returns (%)
ROCE (Pre-tax)
15.2
18.3
12.8
12.9
17.6
17.1
Angel ROIC (Pre-tax)
16.1
19.3
15.3
17.8
24.1
23.7
ROE
16.4
18.3
14.6
15.1
18.4
16.8
Turnover ratios (x)
Asset Turnover (Gross Block)
1.6
1.7
1.8
1.8
2.0
2.2
Inventory / Sales (days)
104
93
95
96
88
98
Receivables (days)
83
71
60
74
68
75
Payables (days)
57
46
41
55
45
44
WC cycle (ex-cash) (days)
146
131
124
116
116
119
Solvency ratios (x)
Net debt to equity
(0.0)
0.1
0.1
0.1
0.0
(0.1)
Net debt to EBITDA
(0.0)
0.4
0.6
0.5
0.1
(0.3)
Interest Coverage (EBIT/Int.)
-
-
-
-
-
-
November 9, 2015
11
Cipla | 2QFY2016 Result Update
Research Team Tel: 022 - 39357800
DISCLAIMER
Angel Broking Private Limited (hereinafter referred to as “Angel”) is a registered Member of National Stock Exchange of India Limited,
Bombay Stock Exchange Limited and MCX Stock Exchange Limited. It is also registered as a Depository Participant with CDSL and
Portfolio Manager with SEBI. It also has registration with AMFI as a Mutual Fund Distributor. Angel Broking Private Limited is a
registered entity with SEBI for Research Analyst in terms of SEBI (Research Analyst) Regulations, 2014 vide registration number
INH000000164. Angel or its associates has not been debarred/ suspended by SEBI or any other regulatory authority for accessing
/dealing in securities Market. Angel or its associates including its relatives/analyst do not hold any financial interest/beneficial
ownership of more than 1% in the company covered by Analyst. Angel or its associates/analyst has not received any compensation /
managed or co-managed public offering of securities of the company covered by Analyst during the past twelve months. Angel/analyst
has not served as an officer, director or employee of company covered by Analyst and has not been engaged in market making activity
of the company covered by Analyst.
This document is solely for the personal information of the recipient, and must not be singularly used as the basis of any investment
decision. Nothing in this document should be construed as investment or financial advice. Each recipient of this document should
make such investigations as they deem necessary to arrive at an independent evaluation of an investment in the securities of the
companies referred to in this document (including the merits and risks involved), and should consult their own advisors to determine
the merits and risks of such an investment.
Reports based on technical and derivative analysis center on studying charts of a stock's price movement, outstanding positions and
trading volume, as opposed to focusing on a company's fundamentals and, as such, may not match with a report on a company's
fundamentals.
The information in this document has been printed on the basis of publicly available information, internal data and other reliable
sources believed to be true, but we do not represent that it is accurate or complete and it should not be relied on as such, as this
document is for general guidance only. Angel Broking Pvt. Limited or any of its affiliates/ group companies shall not be in any way
responsible for any loss or damage that may arise to any person from any inadvertent error in the information contained in this report.
Angel Broking Pvt. Limited has not independently verified all the information contained within this document. Accordingly, we cannot
testify, nor make any representation or warranty, express or implied, to the accuracy, contents or data contained within this document.
While Angel Broking Pvt. Limited endeavors to update on a reasonable basis the information discussed in this material, there may be
regulatory, compliance, or other reasons that prevent us from doing so.
This document is being supplied to you solely for your information, and its contents, information or data may not be reproduced,
redistributed or passed on, directly or indirectly.
Neither Angel Broking Pvt. Limited, nor its directors, employees or affiliates shall be liable for any loss or damage that may arise from
or in connection with the use of this information.
Note: Please refer to the important ‘Stock Holding Disclosure' report on the Angel website (Research Section). Also, please refer to the
latest update on respective stocks for the disclosure status in respect of those stocks. Angel Broking Pvt. Limited and its affiliates may
have investment positions in the stocks recommended in this report.
Disclosure of Interest Statement
Cipla
1. Analyst ownership of the stock
No
2. Angel and its Group companies ownership of the stock
No
3. Angel and its Group companies' Directors ownership of the stock
No
4. Broking relationship with company covered
No
Note: We have not considered any Exposure below ` 1 lakh for Angel, its Group companies and Directors
Ratings (Based on expected returns
Buy (> 15%)
Accumulate (5% to 15%)
Neutral (-5 to 5%)
over 12 months investment period):
Reduce (-5% to -15%)
Sell (< -15)
November 9, 2015
12