1QFY2017 Result Update | Pharmaceutical
August 16, 2016
Cipla
NEUTRAL
CMP
`517
Performance Highlights
Target Price
-
Y/E March (` cr)
1QFY2017 4QFY2016
% chg qoq 1QFY2016
% chg yoy
Investment Period
-
Net sales
3,500
3,207
9.1
3,761
(6.9)
Other income
119
115
3.9
128
(6.9)
Stock Info
Gross profit
2,129
1,791
18.9
2,518
(15.4)
Sector
Pharmaceutical
Operating profit
517
159
225.0
977
(47.0)
Market Cap (` cr)
41,519
Adj. Net profit
365
81
351.6
649
(43.7)
Net Debt (` cr)
563
Source: Company, Angel Research
Beta
0.7
52 Week High / Low
748/458
Cipla posted lower than expected numbers for 1QFY2017. Sales came in at
Avg. Daily Volume
164,865
`3,500cr V/s `3,743cr expected and V/s `3,761cr in 1QFY2016, a dip of 6.9%
Face Value (`)
2
yoy. Domestic sales (`1,449cr) rose 5% yoy, while exports (`2,051cr) dipped by
BSE Sensex
28,152
14.0% yoy. On the operating front, the EBITDA margin came in at 14.8% V/s
Nifty
8,672
18.6% expected, V/s 26.0% in 1QFY2016, and V/s Adj. OPM of
15.8% in
Reuters Code
CIPL.BO
4QFY2016. Thus, the Adj. net profit came in at `365cr V/s `435cr expected and
Bloomberg Code
CIPLA@IN
V/s `649cr in 1QFY2016, a yoy de-growth of 43.7%. We maintain our Neutral
rating on the stock.
Results much lower than our expectations: The company posted lower than
Shareholding Pattern (%)
expected numbers for 1QFY2017. Sales came in at `3,500cr V/s `3,743cr
Promoters
36.8
expected and V/s `3,761cr in 1QFY2016, a dip of 6.9% yoy. Domestic sales
MF / Banks / Indian Fls
20.9
(`1,449cr) rose 5% yoy, while exports (`2,051cr) dipped by 14.0% yoy. On the
FII / NRIs / OCBs
23.1
operating front, the EBITDA margin came in at 14.8% V/s 18.6% expected, V/s
Indian Public / Others
19.2
26.0% in 1QFY2016, and V/s Adj. OPM of 15.8% in 4QFY2016. Thus, the Adj.
net profit came in at `365cr V/s `435cr expected and V/s `649cr in 1QFY2016,
Abs. (%)
3m 1yr
3yr
a yoy de-growth of 43.7%.
Sensex
8.8
(0.0)
48.3
Outlook and valuation: We expect the company to post a 16.3% CAGR in
Cipla
13.7
(30.8)
(17.5)
net sales to `18,089cr and EPS to record a 20.4% CAGR to `27.2 over
FY2016-18E. We reiterate our Neutral stance on the stock owing to the
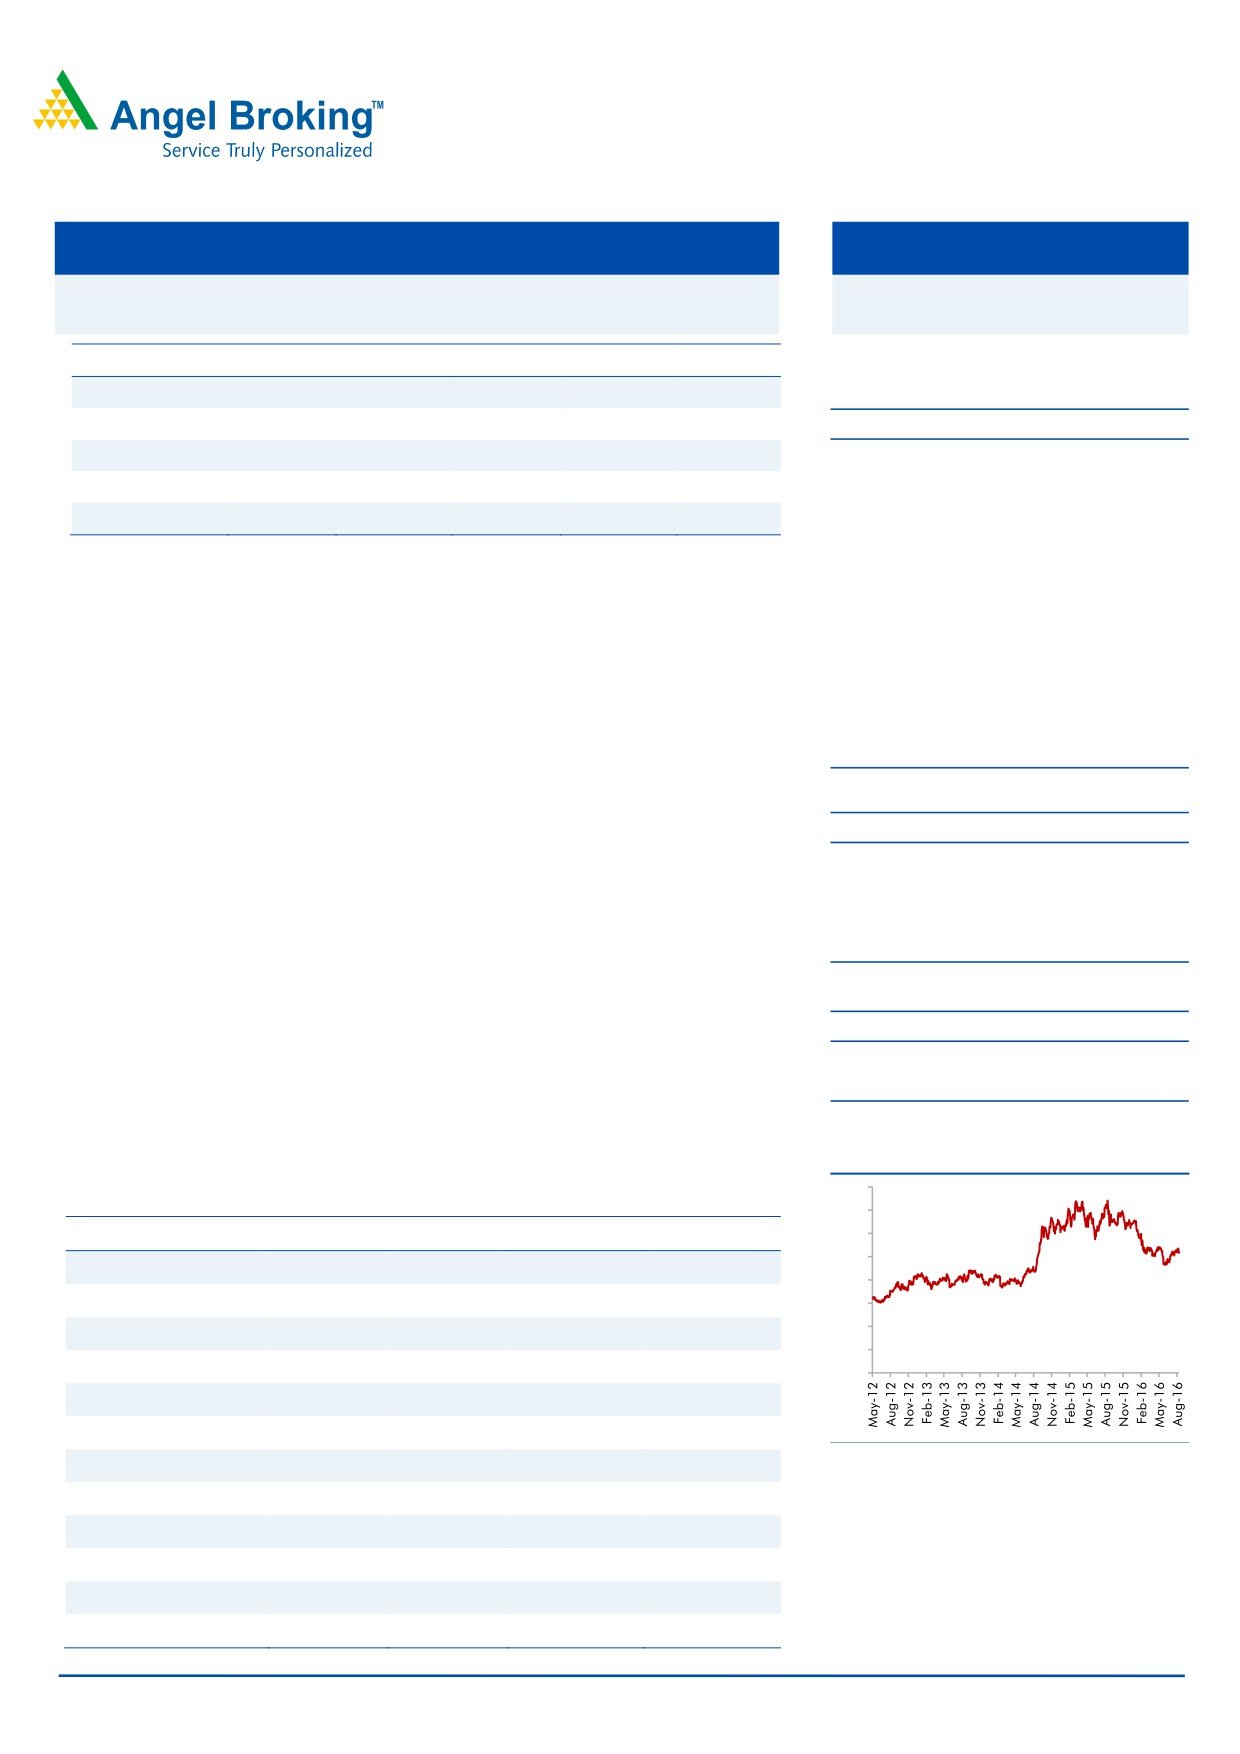
3-Year Daily Price Chart
company’s poor return ratios.
800
Key financials (Consolidated)
700
Y/E March (` cr)
FY2015
FY2016
FY2017E
FY2018E
600
500
Net sales
11,681
13,372
15,378
18,089
400
% chg
19.8
14.5
15.0
17.6
300
200
Adj. Net profit
1,578
1,506
1,736
2,185
100
% chg
13.6
(4.5)
15.3
25.9
0
EPS (`)
19.6
18.8
21.6
27.2
EBITDA margin (%)
17.7
16.4
17.4
18.4
Source: Company, Angel Research
P/E (x)
23.8
24.9
21.6
17.2
RoE (%)
15.1
13.3
13.7
15.2
RoCE (%)
12.9
10.7
11.1
13.5
P/BV (x)
3.5
3.2
2.8
2.4
Sarabjit Kour Nangra
EV/Sales (x)
3.3
3.1
2.7
2.2
+91 22 3935 7600 Ext: 6806
EV/EBITDA (x)
18.6
18.8
15.3
12.0
Source: Company, Angel Research; Note: CMP as of August 12, 2016
Please refer to important disclosures at the end of this report
1
Cipla | 1QFY2017 Result Update
Exhibit 1: 1QFY2017 ( Consolidated) performance
Y/E March (` cr)
1QFY2017
4QFY2016
% chg QoQ
1QFY2016
% chg yoy FY2016 FY2015
% chg yoy
Net sales
3,500
3,207
9.1
3,761
(6.9)
13,372
10,882
22.9
Other income
119.1
114.6
3.9
127.9
(6.9)
514.7
628.6
(18.1)
Total income
3,619
3,321
9.0
3,889
(6.9)
13,887
11,511
20.6
Gross profit
2129
1791
18.9
2518
(15.4)
8254
6728
22.7
Gross margin
60.8
55.8
66.9
61.7
61.8
Operating profit
517
159
225.0
977
(47.0)
2195
1699
29.2
OPM (%)
14.8
5.0
26.0
16.4
15.6
Interest
31.3
36.8
(14.7)
63.9
(50.9)
161
168
(4.0)
Depreciation
161
141
13.7
149
7.6
542
505
7.3
PBT
444
96
364.8
892
(50.2)
2007
1654
21.3
Provision for taxation
71
-4
(1,915.6)
242
(70.7)
440
400
9.9
PAT before extra-ordinary item
374
99
275.4
650
(42.5)
1567
1254
25.0
Share of Profit /( loss ) of asso.
(8)
(13)
(1)
(61)
(73)
Extra-ordinary items/(income)
0
0
0
0
0
PAT after extra-ordinary item
365
81
351.6
649
(43.7)
1506
1181
27.5
Adj. PAT
365
81
351.6
649
(43.7)
1506
1181
27.5
EPS (`)
4.5
1.0
8.1
18.8
14.7
Source: Company, Angel Research
Exhibit 2: 1QFY2017 - Actual vs. Angel estimates
(` cr)
Actual
Estimates
Variance
Net sales
3,500
3,743
(6.5)
Other income
119
115
3.6
Operating profit
517
695
(25.5)
Tax
71
174
(59.4)
Net profit
365
435
(16.1)
Source: Company, Angel Research
Top-line growth lower than expectation
Sales during the quarter came in at `3,500cr V/s `3,743cr expected and V/s
`3,761cr in 1QFY2016, a dip of 6.9% yoy. Domestic formulations (`1,449cr)
posted a yoy growth of 5.0% while exports (`2,051cr) posted a yoy de-growth of
14.0%. Domestic formulation sales took an impact of ~2% due to regulatory
issues.
USA (US$98mn) posted a yoy de-growth of 25.8% excluding Nexium and Invagen
sales; the base business posted a yoy growth of 30%+. The company was the third
fastest-growing generics player in the US in 1QFY2017 and has 8 of its 38
products ranked #1 in their respective segments. The company expects the US
portfolio to deliver robust growth on the back of its strong launch pipeline (~15
launches expected in the rest of FY2017) and enhanced focus on R&D.
South Africa (ZAR905mn) registered a growth of ~22% over the last year. The
company has a market share of ~5.3% in the private market and is the 3rd largest
generics player in South Africa with leadership in Respiratory, CNS, and Oncology
segments where it commands a ~25-30% market share. Also, the company
posted a 10% yoy growth in tender sales Vs last year.
August 16, 2016
2
Cipla | 1QFY2017 Result Update
Emerging market sales (US$113mn) posted an overall de-growth of ~11% yoy in
1QFY2017. Direct to market (DTM) sales declined ~13% yoy owing to forex
volatility and complexity reduction initiatives while there has been a resurgence in
partnership-led markets (B2B) with 15% yoy growth.
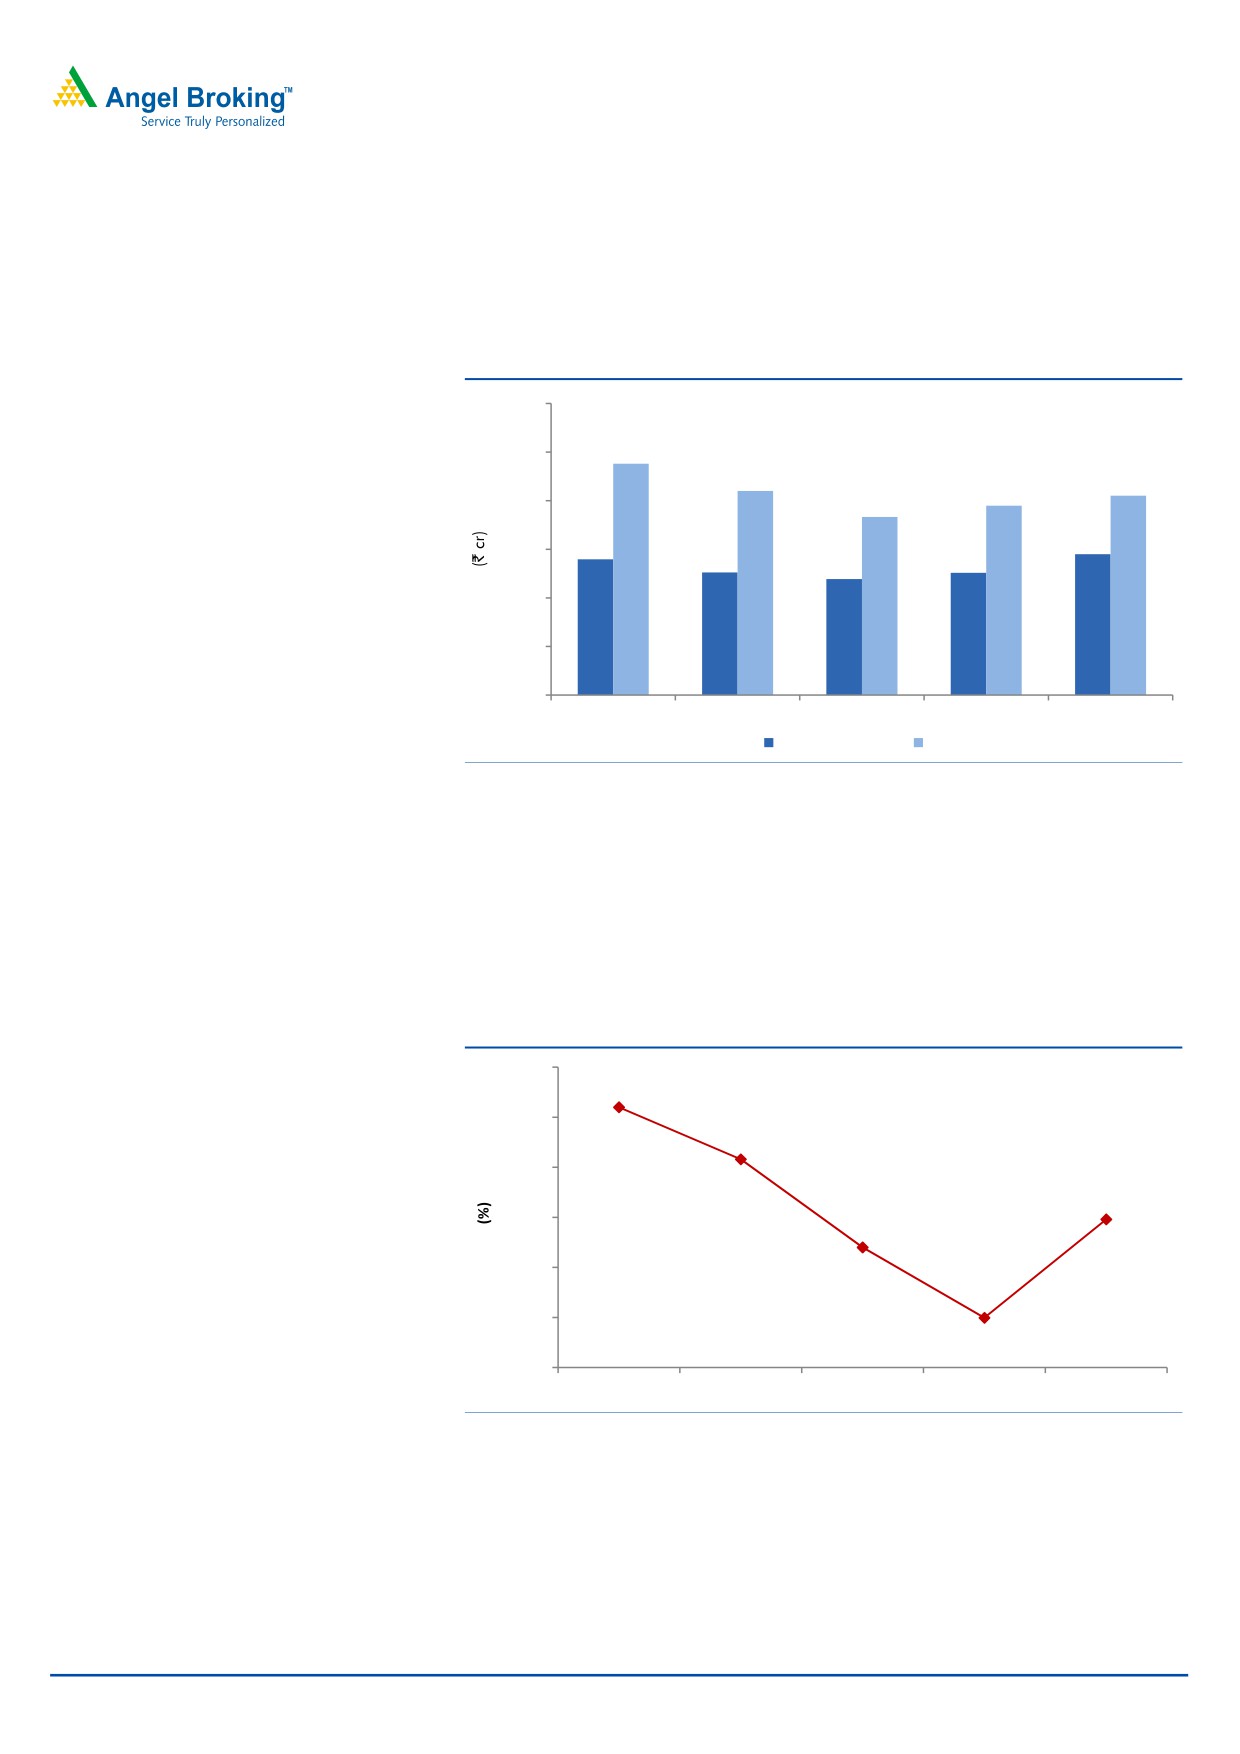
Exhibit 3: Sales Trend
3,000
2,380
2,500
2,100
2,051
1,948
2,000
1,833
1,397
1,449
1,500
1,262
1,258
1,194
1,000
500
0
1QFY2016
2QFY2016
3QFY2016
4QFY2016
1QFY2017
Domestic
Export
Source: Company
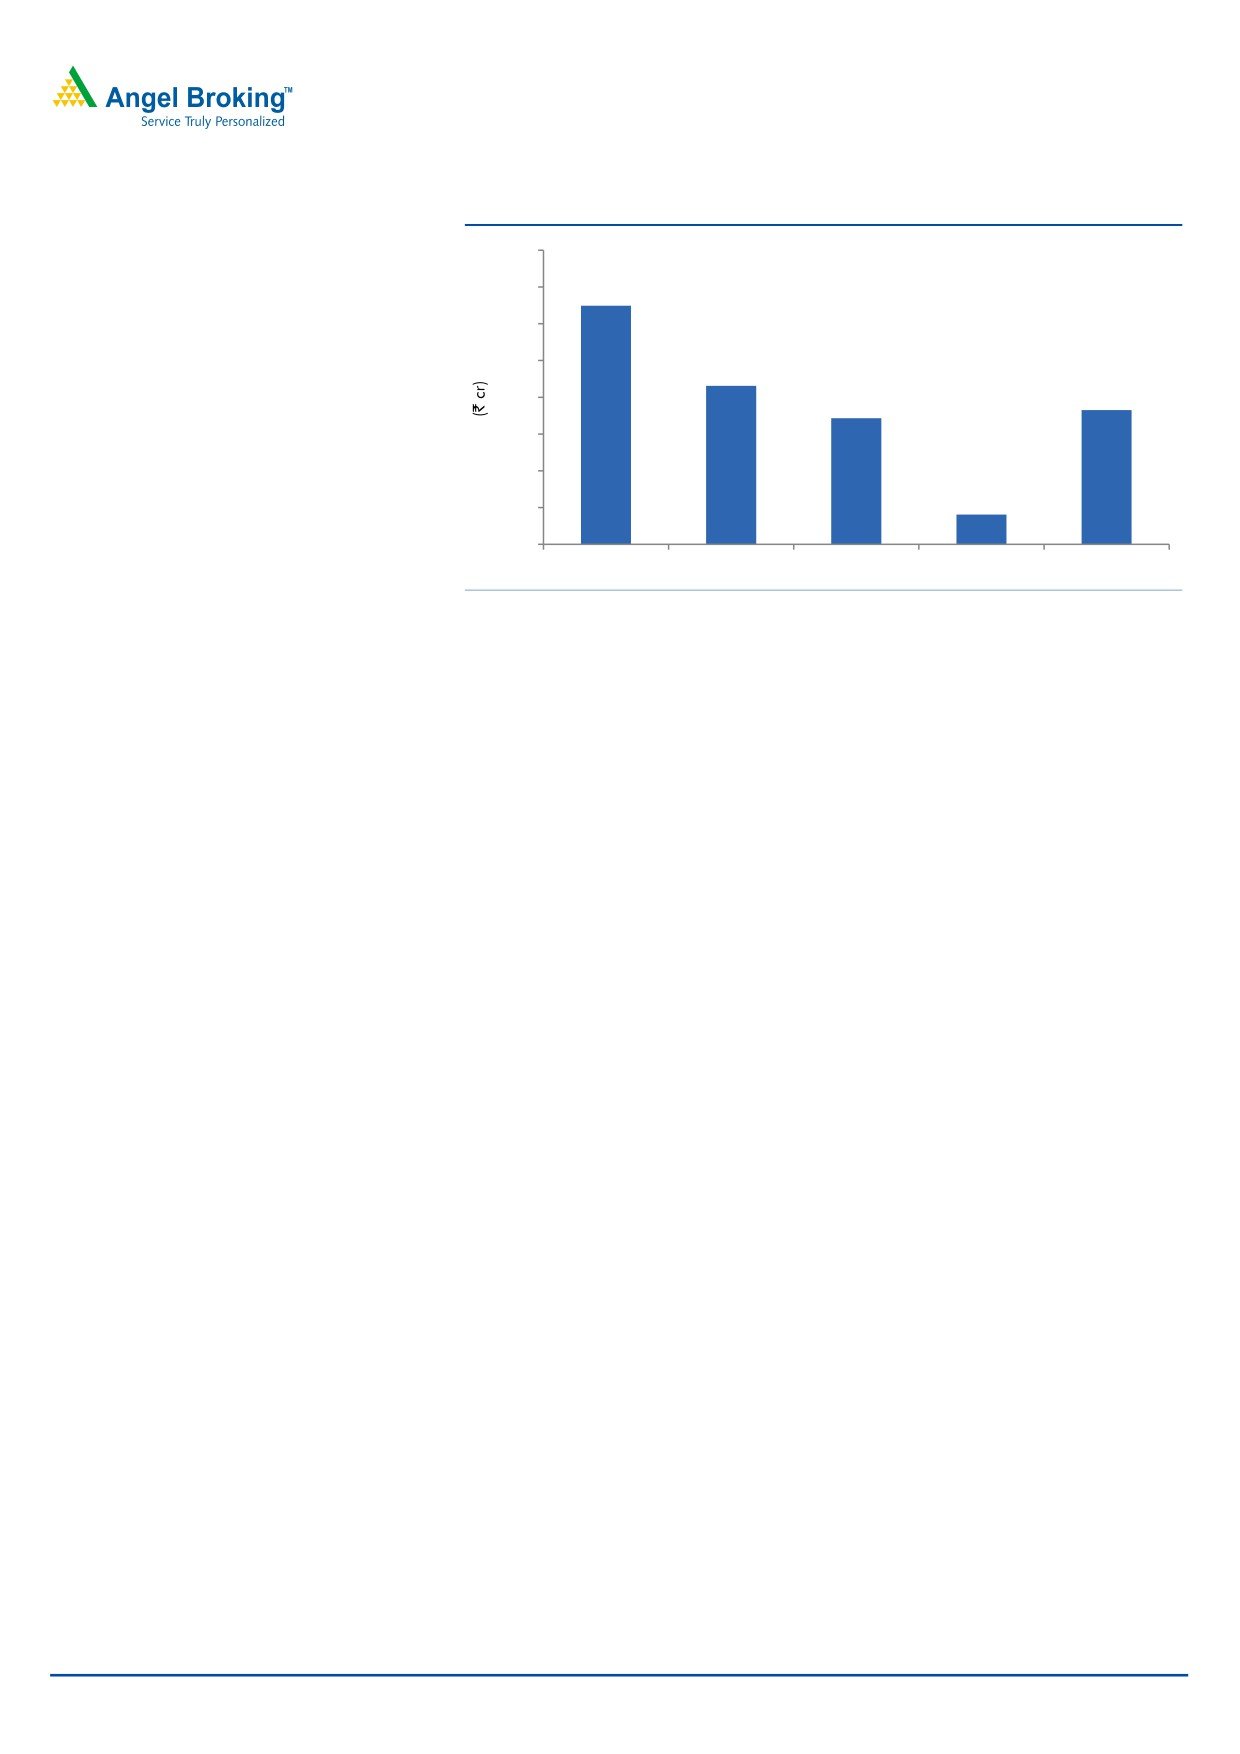
Operating profit margin much lower than expected
On the operating front, the EBITDA margin came in at 14.8% V/s 18.6% expected,
V/s 26.0% in 1QFY2016 and V/s Adj. OPM of 15.8% in 4QFY2016. R&D as % of
sales for the quarter stood at 6.6%; it is expected to be at ~8.0% in FY2017 as
against ~6.5% in FY2016.
Exhibit 4: OPM Trend
30.0
26.0
25.0
20.8
20.0
14.8
15.0
12.0
10.0
5.0
5.0
0.0
1QFY2016
2QFY2016
3QFY2016
4QFY2016
1QFY2017
Source: Company
Net profit lower than expectation
The Adj. net profit came in at `365cr V/s `435cr expected and V/s `649cr in
1QFY2016, a yoy de-growth of 43.7%.
August 16, 2016
3
Cipla | 1QFY2017 Result Update
Exhibit 5: Net Profit Trend
800
700
649
600
500
431
365
400
343
300
200
81
100
0
1QFY2016
2QFY2016
3QFY2016
4QFY2016
1QFY2017
Source: Company
Concall takeaways
R&D as % of sales for the quarter stood at 6.6%; it is expected to be at ~8% in
FY2017 as against ~6.5% in FY2016.
In USA, the company expects to file 15 ANDAs in FY2017.
DPCO and Fixed Dosage Combinations ban in domestic market expected to
impact by ~2-3% for FY2017.
Recommendation rationale
Export segment to be the growth driver: Cipla exports to more than 180 countries,
with growth coming through marketing alliances and distribution tie-ups in various
markets. Exports contributed 60% to the total turnover in FY2016, with Africa, US
and Latin America constituting more than ~60% of total exports. In the US, Cipla
has a strong product pipeline of 168 ANDAs, out of which, 90 are approved.
Another long term growth driver for the company is the launch of the CFC-free
inhalers in the regulated markets. CFC-free inhalers in Europe and US address a
potential market size of more than US$3bn.
During the quarter, the company strengthened its foothold in the US through the
acquisition of InvaGen Pharma and Exelan Pharma. The companies added a
pipeline of ~70 ANDAs of which 40 are approved (32 marketed) and 30 awaiting
approval. The company is likely to add over USD250mn in FY2017. The deal is
expected to conclude by December 2015. It will also provide manufacturing
capabilities in the US. Overall, we expect the company’s exports to grow at a
CAGR of 19.1% during FY2016-18E.
Increasing penetration in the domestic market: Cipla is one of the largest players
in the domestic formulation market with a market share of around 5.3%. Domestic
formulations contributed 40% to the company’s total turnover in FY2016. The
company is the market leader in key therapeutic areas such as respiratory care,
anti-viral and urological. Cipla’s distribution network in India consists of a field
force of around 7,000-8,000 employees. The company plans to increase its focus
on domestic markets with new therapies such as oncology and neuro-psychiatry in
the offing. The company plans to focus on growing its market share and sales by
August 16, 2016
4
Cipla | 1QFY2017 Result Update
increasing penetration in the Indian market, especially in rural areas, and plans to
expand its product portfolio by launching biosimilars, particularly relating to
the oncology, anti-asthmatic and anti-arthritis categories. Overall we expect
the company’s domestic formulation business to post a CAGR of 14.0% over
FY2016-18E.
Valuation: We expect the company to post a 16.3% CAGR in net sales to
`18,089cr and EPS to record a 21.7% CAGR to `27.8 over FY2016-18E. The
growth in the top-line would be driven by domestic formulation sales and exports.
We maintain our Neutral stance on the stock.
Exhibit 6: Key assumptions
Key assumptions
FY2017E
FY2018E
Domestic growth (%)
13.0
15.0
Exports growth (%)
19.1
19.2
Growth in employee expenses (%)
15.0
15.0
Operating margins (excl tech. know-how fees) (%)
17.4
18.4
Source: Company, Angel Research
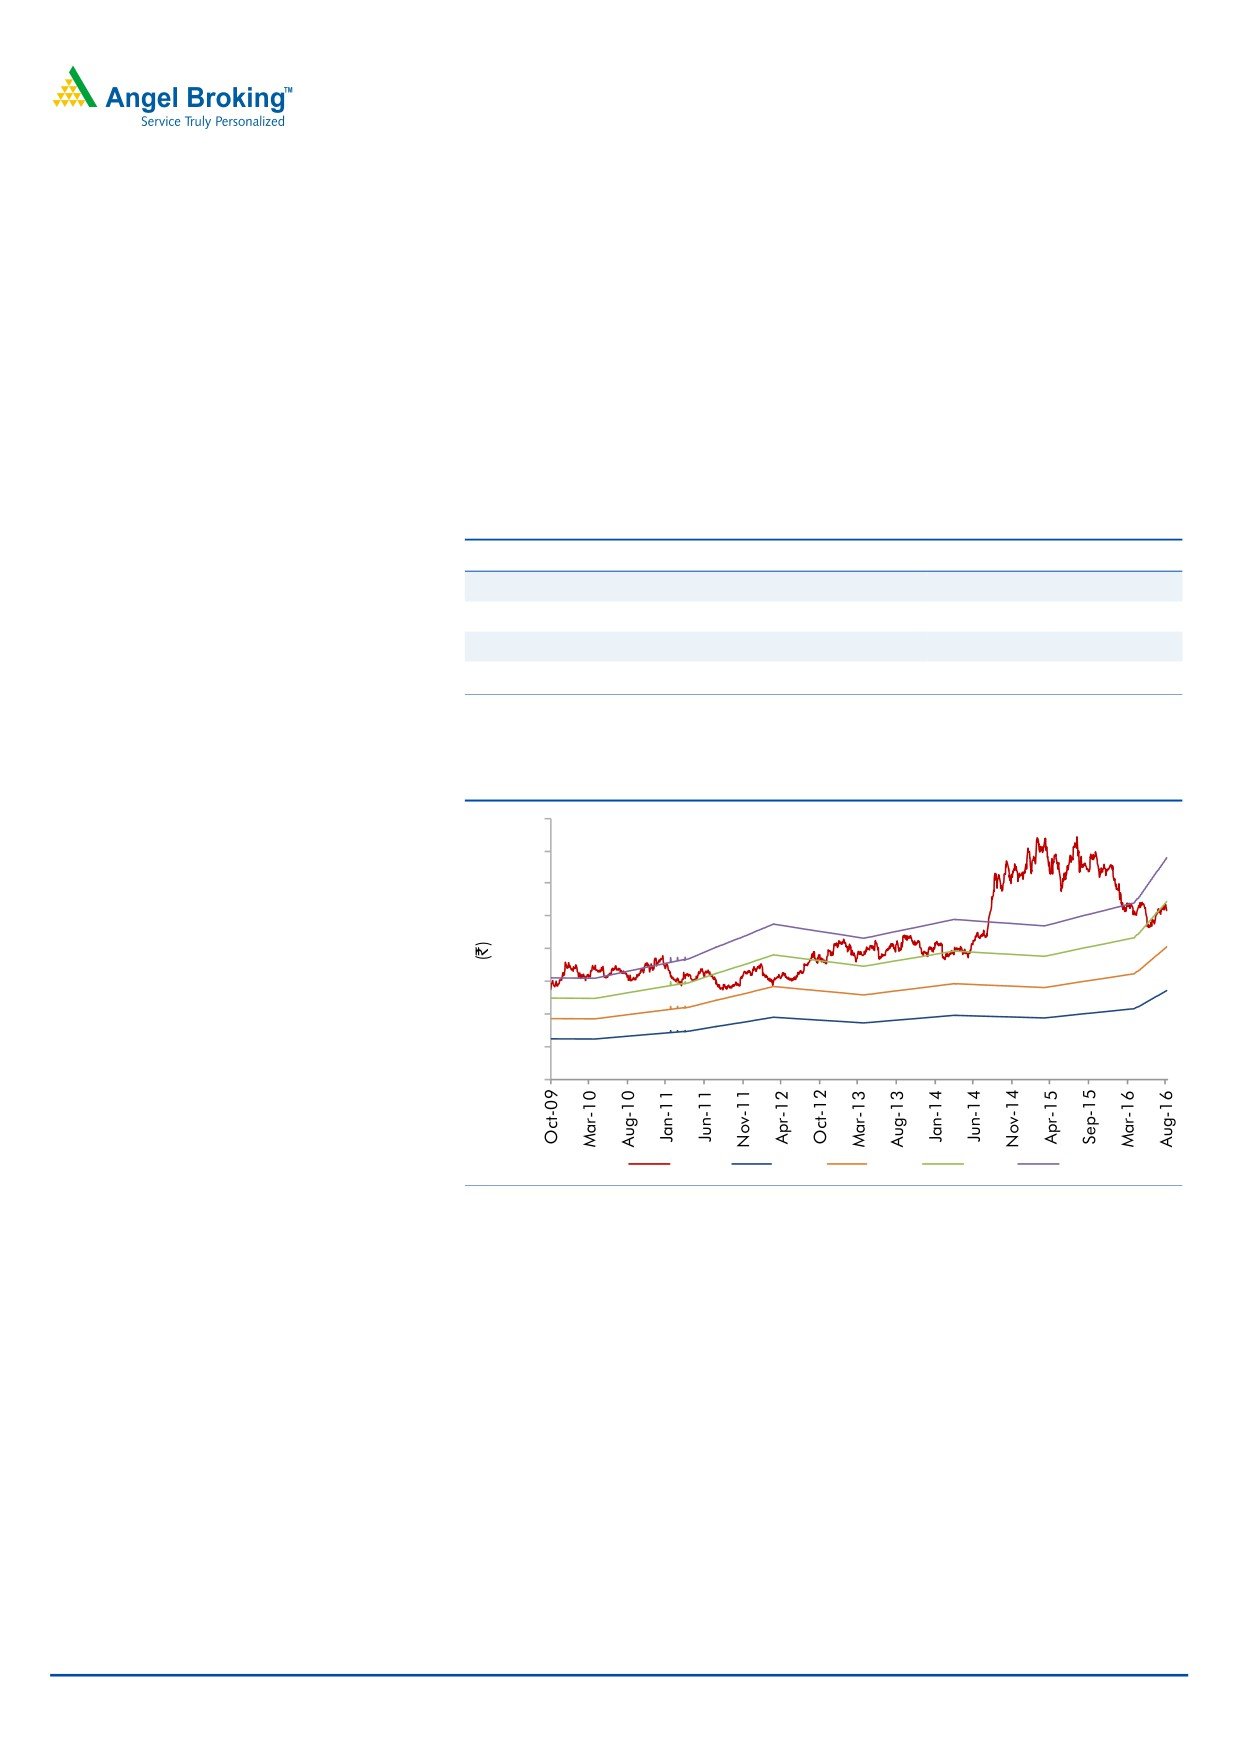
Exhibit 7: One-year forward PE band
800
700
600
500
400
300
200
100
-
Price
10x
15x
20x
25x
Source: Company, Angel Research
August 16, 2016
5
Cipla | 1QFY2017 Result Update
Exhibit 8: Recommendation Summary
Company
Reco
CMP Tgt. price Upside
FY2018E
FY16-18E
FY2018E
(`)
(`)
% PE (x) EV/Sales (x) EV/EBITDA (x) CAGR in EPS (%) RoCE (%) RoE (%)
Alembic Pharma
Neutral
647
-
-
21.3
2.8
13.3
(10.8)
27.5
25.3
Aurobindo Pharma Buy
747
877
17.4
15.8
2.6
11.0
18.1
22.5
26.1
Cadila Healthcare Accumulate
369
400
8.4
18.5
2.8
12.6
15.8
24.3
26.6
Cipla
Neutral
517
-
-
19.0
2.4
13.1
20.4
13.5
15.2
Dr Reddy's
Neutral
3,005
-
-
19.0
2.8
11.2
6.9
18.1
17.1
Dishman Pharma Neutral
167
-
-
16.0
1.8
8.0
(1.1)
9.6
10.2
GSK Pharma*
Neutral
3,102
-
-
52.2
6.7
35.8
15.9
35.8
31.8
Indoco Remedies
Sell
311
225
(27.7)
19.9
2.3
12.7
31.5
19.1
19.2
Ipca labs
Buy
532
613
15.2
27.0
1.9
12.2
36.5
8.8
9.4
Lupin
Accumulate
1,579
1,809
14.6
22.8
3.7
14.0
17.2
24.4
20.9
Sanofi India
Neutral
4,347
-
-
25.7
3.2
18.5
21.2
24.9
28.4
Sun Pharma
Buy
802
944
17.7
24.4
4.9
15.9
22.0
33.1
18.9
Source: Company, Angel Research; Note: * December year ending
August 16, 2016
6
Cipla | 1QFY2017 Result Update
Company Background
Cipla is a leading pharmaceutical company in India with a strong presence in
both, the export and domestic markets. On the exports front, where it follows the
partnership model, it has 5,700 product registrations in around 180 countries.
Cipla is a market leader in the domestic formulation market with ~5.3% market
share. The company is likely to continue on the growth trajectory owing to its entry
into the inhalers market in the EU and potential new long-term manufacturing
contracts with Global Innovators.
August 16, 2016
7
Cipla | 1QFY2017 Result Update
Profit & loss statement (Consolidated)
Y/E March (` cr)
FY2013
FY2014
FY2015
FY2016
FY2017E
FY2018E
Gross sales
8,196
9,902
11,861
13,587
15,615
18,368
Less: Excise duty
108.7
149.3
179.7
215.0
236.6
278.3
Net sales
8,087
9,753
11,681
13,372
15,378
18,089
Other operating income
193
348
348
306
306
306
Total operating income
8,279
10,100
12,029
13,678
15,684
18,395
% chg
17.9
22.0
19.1
13.7
14.7
17.3
Total expenditure
6,081
7,967
9,612
11,177
12,704
14,760
Net raw materials
2,953
3,875
4,556
5,118
5,736
6,747
Other mfg costs
641
827
993
1,142
1,313
1,510
Personnel
1,036
1,543
2,083
2,447
2,814
3,236
Other
1,451
1,722
1,981
2,470
2,841
3,267
EBITDA
2,005
1,786
2,069
2,195
2,675
3,329
% chg
35.0
(11.0)
15.9
6.1
21.8
24.5
(% of Net Sales)
24.8
18.3
17.7
16.4
17.4
18.4
Depreciation & amort.
330
373
457
542
676
732
EBIT
1,675
1,413
1,613
1,654
1,999
2,597
% chg
42.7
(15.6)
14.1
2.5
20.9
30.0
(% of Net Sales)
20.7
14.5
13.8
12.4
13.0
14.4
Interest & other charges
34
146
85
161
161
161
Other Income
235
266
266
209
209
209
(% of PBT)
11.4
14.1
12.4
10.4
8.9
7.1
Recurring PBT
2,069
1,881
2,141
2,007
2,352
2,951
% chg
39.3
(9.1)
13.8
(6.3)
17.2
25.5
Extraordinary exp./(Inc.)
(26.7)
-
-
-
-
-
PBT (reported)
2,095
1,881
2,141
2,007
2,352
2,951
Tax
544.3
463.4
535.3
439.6
588.0
737.7
(% of PBT)
26.0
24.6
25.0
21.9
25.0
25.0
PAT (reported)
1,551
1,417
1,606
1,567
1,764
2,213
Add: Share of earnings of asso.
(6)
(12)
(12)
(12)
(11)
(10)
Less: Minority interest (MI)
-
16
16
49
17
18
Prior period items
-
-
-
-
-
-
PAT after MI (reported)
1,545
1,388
1,578
1,506
1,736
2,185
ADJ. PAT
1,524
1,388
1,578
1,506
1,736
2,185
% chg
30.0
(8.9)
13.6
(4.5)
15.3
25.9
(% of Net Sales)
19.1
14.2
13.5
11.3
11.3
12.1
Basic EPS (`)
19.0
17.3
19.6
18.8
21.6
27.2
Fully Diluted EPS (`)
19.0
17.3
19.6
18.8
21.6
27.2
% chg
30.0
(8.9)
13.6
(4.5)
15.3
25.9
August 16, 2016
8
Cipla | 1QFY2017 Result Update
Balance sheet (Consolidated)
Y/E March (` cr)
FY2013
FY2014
FY2015
FY2016
FY2017E
FY2018E
SOURCES OF FUNDS
Equity share capital
161
161
161
161
161
161
Preference Capital
-
-
-
-
-
-
Reserves & surplus
8,858
9,890
10,629
11,697
13,245
15,241
Shareholders funds
9,019
10,050
10,801
11,857
13,405
15,402
Minority interest
-
50
180
270
270
270
Total loans
966.9
1,247.9
1,701.8
5,191.4
4,000.0
4,000.0
Other long term liabilities
30.0
32.6
32.6
32.6
32.6
32.6
Long Term Provisions
50.4
77.4
168.4
154.9
154.9
154.9
Deferred tax liability
280.5
309.0
284.6
366.4
366.4
366.4
Total liabilities
10,347
11,767
13,169
17,872
18,229
20,226
APPLICATION OF FUNDS
Gross block
5,318
6,183
6,868
8,100
8,800
9,500
Less: acc. depreciation
1,708
2,180
2,634
3,176
3,852
4,584
Net block
3,610
4,003
4,234
4,924
4,948
4,916
Capital work-in-progress
378
442
442
442
442
442
Goodwill
-
2,493
2,735
5,713
5,713
5,713
Investments
2,532
709
640
757
757
757
Long Term Loans and Adv.
363
301
419
715
475
559
Current assets
4,775
5,340
7,201
8,262
8,508
10,914
Cash
143
175
564
871
358
1,327
Loans & advances
573
596
701
958
923
1,085
Others
4,058
4,569
5,936
6,432
7,228
8,502
Current liabilities
1,311
1,634
2,501
2,939
2,614
3,075
Net current assets
3,464
3,706
4,700
5,322
5,894
7,839
Mis. Exp. not written off
-
112
-
-
-
-
Total assets
10,347
11,767
13,169
17,872
18,229
20,226
August 16, 2016
9
Cipla | 1QFY2017 Result Update
Cash flow statement (Consolidated)
Y/E March (` cr)
FY2013
FY2014
FY2015
FY2016
FY2017E FY2018E
Profit before tax
2,095
1,881
2,141
2,007
2,352
2,951
Depreciation
330
373
457
542
676
732
(Inc)/Dec in Working Capital
(667)
(149)
(722)
(611)
(846)
(1,060)
Direct taxes paid
518
431
537
632
-
-
Cash Flow from Operations
1,241
1,673
1,339
1,306
2,182
2,623
(Inc.)/Dec.in Fixed Assets
(698)
(930)
(684)
(1,232)
(700)
(700)
(Inc.)/Dec. in Investments
(1,263)
1,824
69
(117)
-
-
Other income
-
-
-
-
-
-
Cash Flow from Investing
(1,961)
894
(616)
(1,349)
(700)
(700)
Issue of Equity
-
-
-
-
-
-
Inc./(Dec.) in loans
957
311
545
3,476
(1,191)
-
Dividend Paid (Incl. Tax)
(188)
(188)
(188)
(188)
(188)
(188)
Others
4
(2,658)
(692)
(2,938)
410
(766)
Cash Flow from Financing
773
(2,535)
(335)
350
(969)
(954)
Inc./(Dec.) in Cash
53
32
389
307
513
969
Opening Cash balances
90
143
175
564
871
358
Closing Cash balances
143
175
564
871
358
1,327
August 16, 2016
10
Cipla | 1QFY2017 Result Update
Key Ratio
Y/E March
FY2013
FY2014
FY2015
FY2016
FY2017E
FY2018E
Valuation Ratio (x)
P/E (on FDEPS)
24.6
27.0
23.8
24.9
21.6
17.2
P/CEPS
20.0
21.3
18.5
18.3
15.6
12.9
P/BV
4.2
3.7
3.5
3.2
2.8
2.4
Dividend yield (%)
0.4
0.4
0.4
0.4
0.4
0.4
EV/Sales
4.7
3.9
3.3
3.1
2.7
2.2
EV/EBITDA
19.0
21.5
18.6
18.8
15.3
12.0
EV / Total Assets
3.7
3.3
2.9
2.3
2.2
2.0
Per Share Data (`)
EPS (Basic)
19.0
17.3
19.6
18.8
21.6
27.2
EPS (fully diluted)
19.0
17.3
19.6
18.8
21.6
27.2
Cash EPS
23.4
21.9
25.3
25.5
30.0
36.3
DPS
2.0
2.0
2.0
2.0
2.0
2.0
Book Value
112.3
125.2
134.5
147.7
166.9
191.8
Dupont Analysis
EBIT margin
20.7
14.5
13.8
12.4
13.0
14.4
Tax retention ratio
74.0
75.4
75.0
78.1
75.0
75.0
Asset turnover (x)
0.9
0.9
1.0
0.9
0.9
1.0
ROIC (Post-tax)
14.0
10.1
10.3
8.9
8.8
10.8
Cost of Debt (Post Tax)
5.0
9.9
4.3
3.7
2.6
3.0
Leverage (x)
0.0
0.1
0.0
0.0
1.0
2.0
Operating ROE
14.4
10.1
10.3
8.9
14.9
26.3
Returns (%)
ROCE (Pre-tax)
18.3
12.8
12.9
10.7
11.1
13.5
Angel ROIC (Pre-tax)
19.3
15.3
17.8
16.3
17.7
21.2
ROE
18.3
14.6
15.1
13.3
13.7
15.2
Turnover ratios (x)
Asset Turnover (Gross Block)
1.7
1.8
1.8
1.8
1.9
2.0
Inventory / Sales (days)
93
95
96
101
87
95
Receivables (days)
71
60
74
58
67
73
Payables (days)
46
41
55
74
43
44
WC cycle (ex-cash) (days)
131
124
116
115
116
120
Solvency ratios (x)
Net debt to equity
0.1
0.1
0.1
0.4
0.3
0.2
Net debt to EBITDA
0.4
0.6
0.5
2.0
1.4
0.8
Interest Coverage (EBIT/Int.)
-
-
-
-
-
-
August 16, 2016
11
Cipla | 1QFY2017 Result Update
Research Team Tel: 022 - 39357800
DISCLAIMER
Angel Broking Private Limited (hereinafter referred to as “Angel”) is a registered Member of National Stock Exchange of India Limited,
Bombay Stock Exchange Limited and Metropolitan Stock Exchange Limited. It is also registered as a Depository Participant with CDSL
and Portfolio Manager with SEBI. It also has registration with AMFI as a Mutual Fund Distributor. Angel Broking Private Limited is a
registered entity with SEBI for Research Analyst in terms of SEBI (Research Analyst) Regulations, 2014 vide registration number
INH000000164. Angel or its associates has not been debarred/ suspended by SEBI or any other regulatory authority for accessing
/dealing in securities Market. Angel or its associates/analyst has not received any compensation / managed or co-managed public
offering of securities of the company covered by Analyst during the past twelve months.
This document is solely for the personal information of the recipient, and must not be singularly used as the basis of any investment
decision. Nothing in this document should be construed as investment or financial advice. Each recipient of this document should
make such investigations as they deem necessary to arrive at an independent evaluation of an investment in the securities of the
companies referred to in this document (including the merits and risks involved), and should consult their own advisors to determine
the merits and risks of such an investment.
Reports based on technical and derivative analysis center on studying charts of a stock's price movement, outstanding positions and
trading volume, as opposed to focusing on a company's fundamentals and, as such, may not match with a report on a company's
fundamentals. Investors are advised to refer the Fundamental and Technical Research Reports available on our website to evaluate the
contrary view, if any.
The information in this document has been printed on the basis of publicly available information, internal data and other reliable
sources believed to be true, but we do not represent that it is accurate or complete and it should not be relied on as such, as this
document is for general guidance only. Angel Broking Pvt. Limited or any of its affiliates/ group companies shall not be in any way
responsible for any loss or damage that may arise to any person from any inadvertent error in the information contained in this report.
Angel Broking Pvt. Limited has not independently verified all the information contained within this document. Accordingly, we cannot
testify, nor make any representation or warranty, express or implied, to the accuracy, contents or data contained within this document.
While Angel Broking Pvt. Limited endeavors to update on a reasonable basis the information discussed in this material, there may be
regulatory, compliance, or other reasons that prevent us from doing so.
This document is being supplied to you solely for your information, and its contents, information or data may not be reproduced,
redistributed or passed on, directly or indirectly.
Neither Angel Broking Pvt. Limited, nor its directors, employees or affiliates shall be liable for any loss or damage that may arise from
or in connection with the use of this information.
Disclosure of Interest Statement
Cipla
1. Financial interest of research analyst or Angel or his Associate or his relative
No
2. Ownership of 1% or more of the stock by research analyst or Angel or associates or relatives
No
3. Served as an officer, director or employee of the company covered under Research
No
4. Broking relationship with company covered under Research
No
Ratings (Based on expected returns
Buy (> 15%)
Accumulate (5% to 15%)
Neutral (-5 to 5%)
over 12 months investment period):
Reduce (-5% to -15%)
Sell (< -15)
August 16, 2016
12