3QFY2016 Result Update | Pharmaceutical
February 24, 2016
Cadila Healthcare
ACCUMULATE
CMP
`330
Performance Highlights
Target Price
`352
Investment Period
12 Months
Y/E March (` cr)
3QFY2016 2QFY2016
% chg (qoq) 3QFY2015
% chg (yoy)
Net sales
2,342
2,374
(1.3)
2,160
8.4
Other income
112
109
2.5
40
180.7
Stock Info
Gross profit
1542
1567
(1.6)
1400
10.1
Sector
Pharmaceutical
Operating profit
492
536
(8.3)
417
17.9
Market Cap (` cr)
33,748
Adj. Net profit
390
391
(0.4)
278
40.0
Net debt (` cr)
1,817
Source: Company, Angel Research
Beta
0.8
52 Week High / Low
454 / 296
For 3QFY2016, Cadila Healthcare (Cadila) posted a robust performance on the
Avg. Daily Volume
95,007
net profit front while sales came in lower than expected. Sales came in at
`2,342cr (V/s `2,600cr expected), growing by 8.4% yoy. On the operating front,
Face Value (`)
1
the OPM came in at 21.0% V/s 21.4% expected and V/s 19.3% in 3QFY2015.
BSE Sensex
23,410
The expansion in the OPM was driven by expansion in the GPM to 65.9% V/s
Nifty
7,110
64.8% in 3QFY2015 and almost flat growth in staff and other expenditure. R&D
Reuters Code
CADI.BO
expenditure during the quarter came in at 10.1% V/s 8.7% of sales in 3QFY2015.
Bloomberg Code
CDH@IN
The net profit came in at `389cr V/s `353cr expected and V/s `282cr in
3QFY2015, a yoy growth of 38.2%. The Adj. net profit came in at `390cr V/s
`278cr in 3QFY2015, a yoy growth of 40.0%. We maintain our Accumulate on
Shareholding Pattern (%)
the stock.
Promoters
74.8
MF / Banks / Indian Fls
9.7
Results better than expected at the net profit level: For 3QFY2016, sales came in
FII / NRIs / OCBs
9.6
at `2,342cr (V/s `2,600cr expected), growing by 8.4% yoy. On the operating
Indian Public / Others
6.0
front, the OPM came in at 21.0% V/s 21.4% expected and V/s 19.3% in
3QFY2015. The expansion in the OPM was driven by expansion in the GPM to
65.9% V/s 64.8% in 3QFY2015 and almost flat growth in staff and other
Abs.(%)
3m 1yr 3yr
expenditure. R&D expenditure during the quarter came in at 10.1% V/s 8.7% of
Sensex
(9.3)
(19.2)
21.2
sales in 3QFY2015. The net profit came in at `389cr V/s `353cr expected and
Cadila
(22.2)
6.8
112.5
V/s `282cr in 3QFY2015, a yoy growth of 38.2%. The Adj. net profit came in at
`390cr V/s `278cr in 3QFY2015, a yoy growth of 40.0%.
3-Year Daily Price Chart
Outlook and valuation: We expect Cadila’s net sales to post an 18.0% CAGR to
500
`11,840cr and EPS to report a 24.6% CAGR to `17.6 over FY2015-17E. We
450
400
maintain our Accumulate rating on the stock.
350
300
Key financials (Consolidated)
250
Y E March (` cr)
FY2014
FY2015
FY2016E
FY2017E
200
150
Net sales
7,060
8,497
10,224
11,840
100
50
% chg
14.7
20.4
20.3
15.8
0
Net profit
819
1,159
1,496
1,800
3
3
3
3
4
4
4
4
5
5
5
5
6
1
1
1
1
1
1
1
1
1
1
1
1
1
b
y
g
v
b
y
g
v
b
y
g
v
b
% chg
25.0
41.5
29.1
20.3
e
a
u
o
e
a
u
o
e
a
u
o
e
F
M
A
N
F
M
A
N
F
M
A
N
F
EPS
8.0
11.3
14.6
17.6
Source: Company, Angel Research
EBITDA margin (%)
14.7
18.8
21.0
22.0
P/E (x)
53.1
37.5
29.1
24.1
RoE (%)
25.3
30.1
30.8
29.0
RoCE (%)
13.8
20.2
24.5
25.2
P/BV (x)
2.5
10.2
8.0
6.2
Sarabjit Kour Nangra
EV/Sales (x)
1.4
5.2
4.3
3.6
+91 22 39357600 Ext: 6806
EV/EBITDA (x)
9.7
27.8
20.2
16.3
Source: Company, Angel Research; Note: CMP as of February 23, 2016
Please refer to important disclosures at the end of this report
1
Cadila Healthcare |3QFY2016 Result Update
Exhibit 1: 3QFY2016 performance (Consolidated)
Y/E March (` cr)
3QFY2016
2QFY2016
% chg (qoq) 3QFY2015
% chg (yoy) 9MFY2016 9MFY2015
% chg
Net Sales
2,342
2,374
(1.3)
2,160
8.4
7,094
6,250
13.5
Other Income
112
109
2.5
40
180.7
365
143
155.0
Total Income
2,454
2,483
(1.2)
2,199
11.6
7,459
6,393
16.7
Gross profit
1542
1567
(1.6)
1400
10.1
4640
3849
20.5
Gross margin (%)
65.9
66.0
64.8
65.4
61.6
Operating profit
492
536
(8.3)
417
17.9
1504
1139
32.0
Operating Margin (%)
21.0
22.6
19.3
21.2
18.2
Financial Cost
13
13
(0.5)
16
(22.4)
39
52
(25.8)
Depreciation
77
73
5.1
71
8.9
224
212
5.6
PBT
515
560
(8.1)
370
39.0
1606
1018
57.7
Tax
115
158
(27.3)
79
45.3
445
189
135.6
Adj. PAT before Extra-ordinary item
400
402
(0.6)
291
37.3
1161
829
40.0
Exceptional loss/(gain)
0
0
(5)
(3)
(5)
Minority
9
10
(7.2)
14
27
31
Reported PAT
390
391
(0.3)
282
38.2
1134
800
41.7
Adj. PAT
390
391
(0.4)
278
40.0
1136
796
42.8
EPS (`)
3.8
3.8
2.7
11.1
7.8
Source: Company, Angel Research
Exhibit 2: 3QFY2016 - Actual vs. Angel estimates
(` cr)
Actual
Estimates
Variance
Net Sales
2,342
2,600
(9.9)
Operating profit
492
556
(11.5)
Tax
115
143
(19.5)
Net profit
390
353
10.3
Source: Company, Angel Research
Revenue up 8.4% yoy; marginally lower than our expectation
For 3QFY2016, the company posted sales of `2,342cr (V/s `2,600cr expected), a
growth of 8.4% yoy. Exports (`1,398.8cr) posted a 10.6% yoy growth during the
quarter while domestic markets (`993.2cr) posted a 6.4% yoy growth.
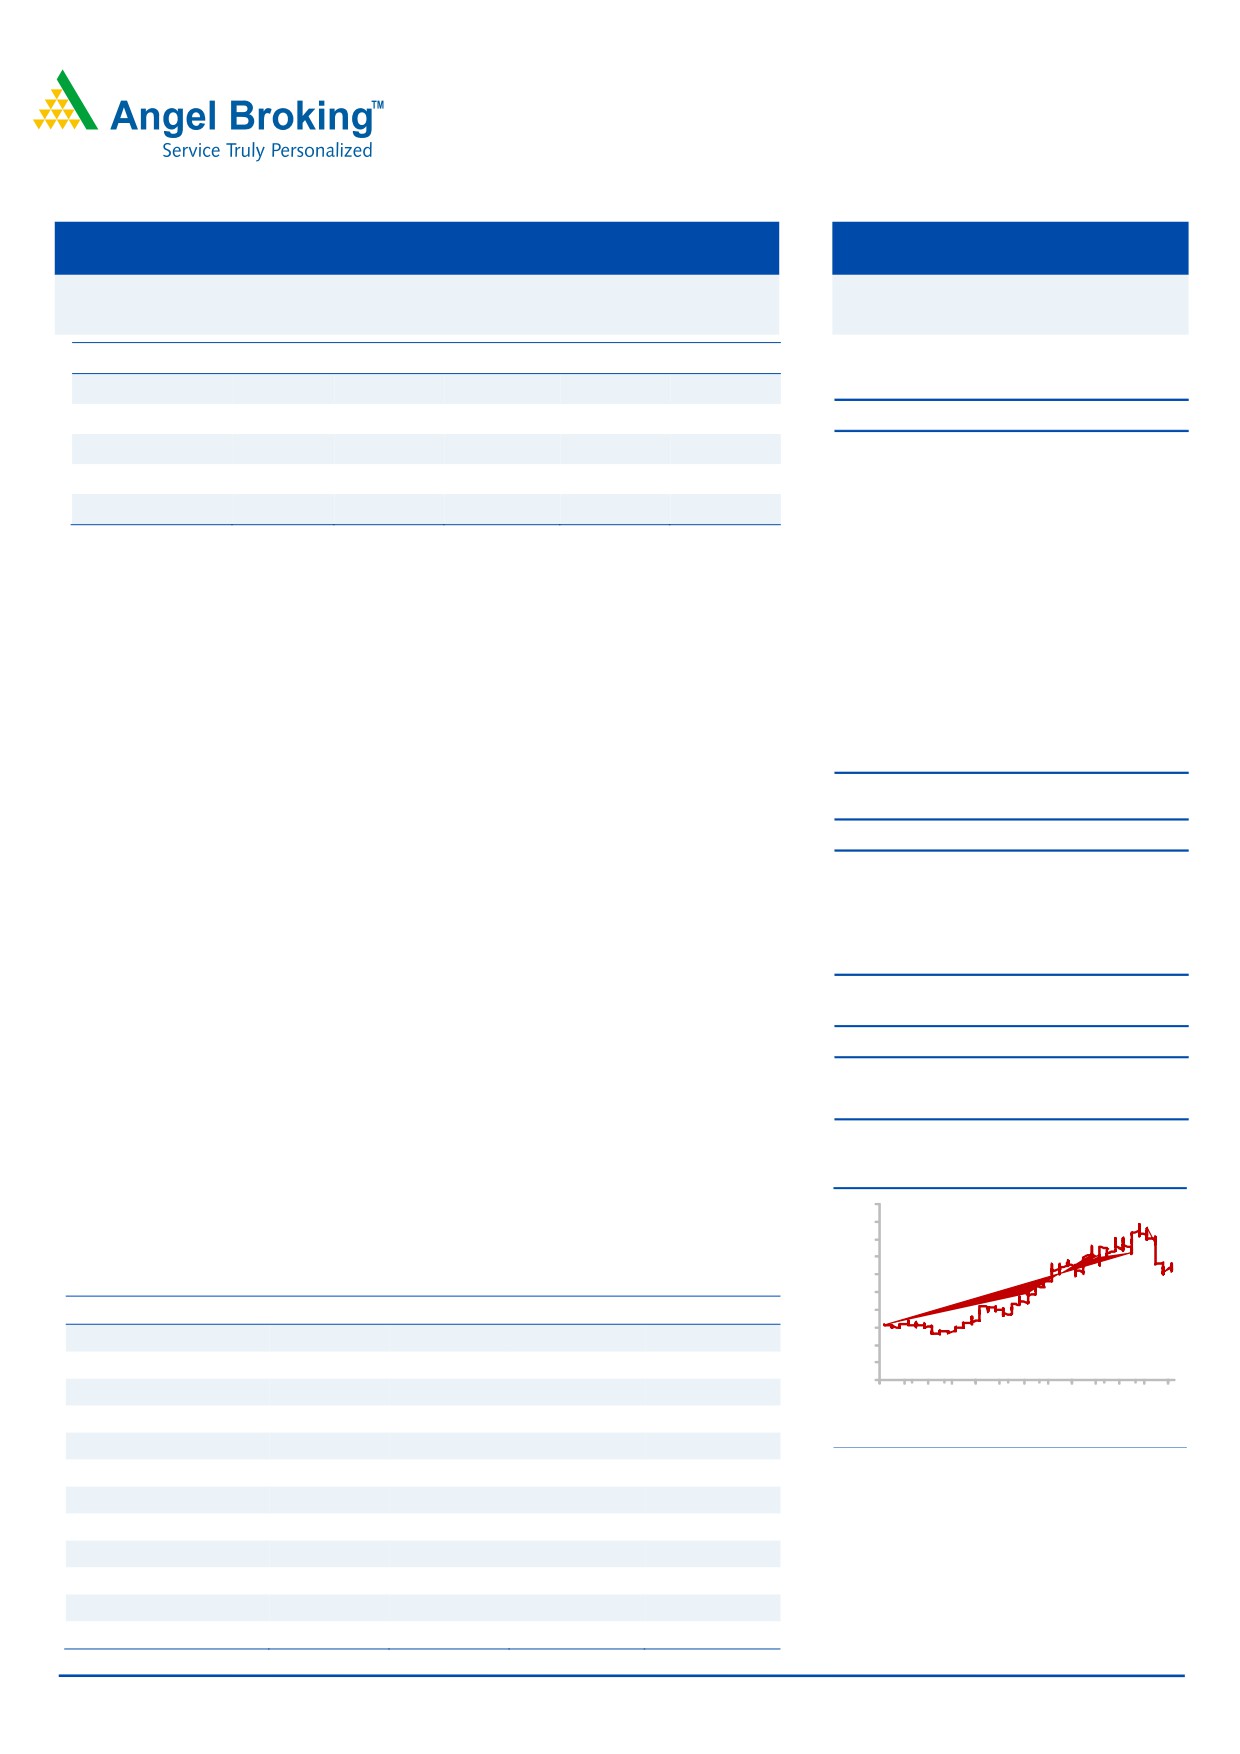
In exports the key market US (`1071.7cr) posted a yoy growth of 19.6%, while the
other key market Europe (`76.2cr) posted a dip of 10.0%; JVs and alliances
(`100.2cr) posted a dip of 17.7% yoy. In domestic markets, the Indian formulation
markets posted a yoy growth of 11.0%.
February 24, 2016
2
Cadila Healthcare |3QFY2016 Result Update
Exhibit 3: Sales trend in the US and Europe
1,200
1,072
1,120
1,004
1,040
979
985
960
896
880
800
720
640
560
480
400
320
240
160
85
84
74
65
76
80
0
3QFY2015
4QFY2015
1QFY2016
2QFY2016
3QFY2016
US
Europe
Source: Company, Angel Research
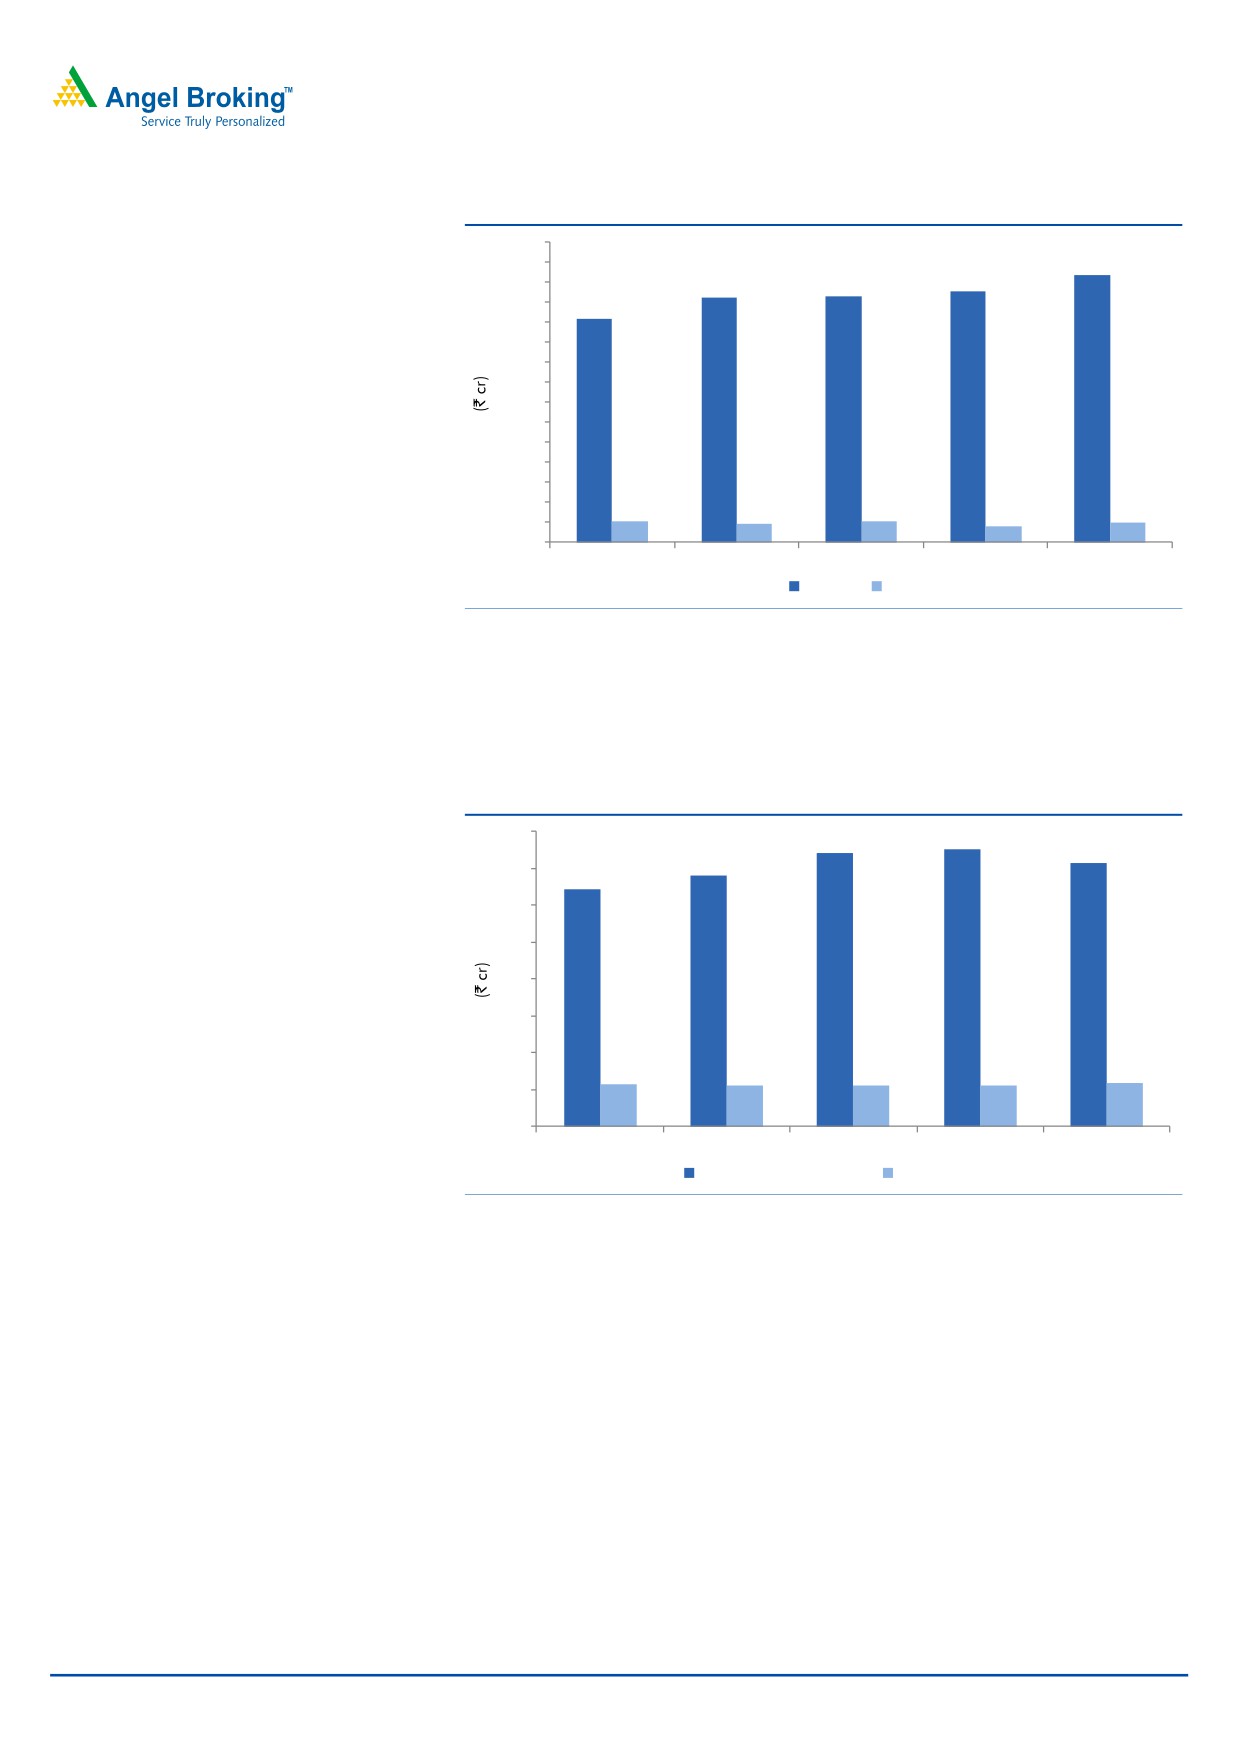
The growth in the domestic market (42% of sales) was 6.4% yoy mainly led by
formulations (`713cr) which grew by 11.1% yoy. API (`83.8cr) on the other hand
de-grew by 12.6% yoy, while Wellness (`117.8cr) grew by 3.3% yoy. Animal
Health and others (`78.5cr) de-grew by 3.8% yoy.
Exhibit 4: Sales trend in Domestic Formulation and Consumer Wellness Divisions
800
742
751
713
680
700
642
600
500
400
300
200
114
111
111
112
118
100
0
3QFY2015
4QFY2015
1QFY2016
2QFY2016
3QFY2016
Domestic Formulation
Consumer division
Source: Company, Angel Research
On the CRAMS front, the company generated sales of `100cr (vs `121.7cr in
3QFY2015), reporting a de-growth of 17.7% yoy.
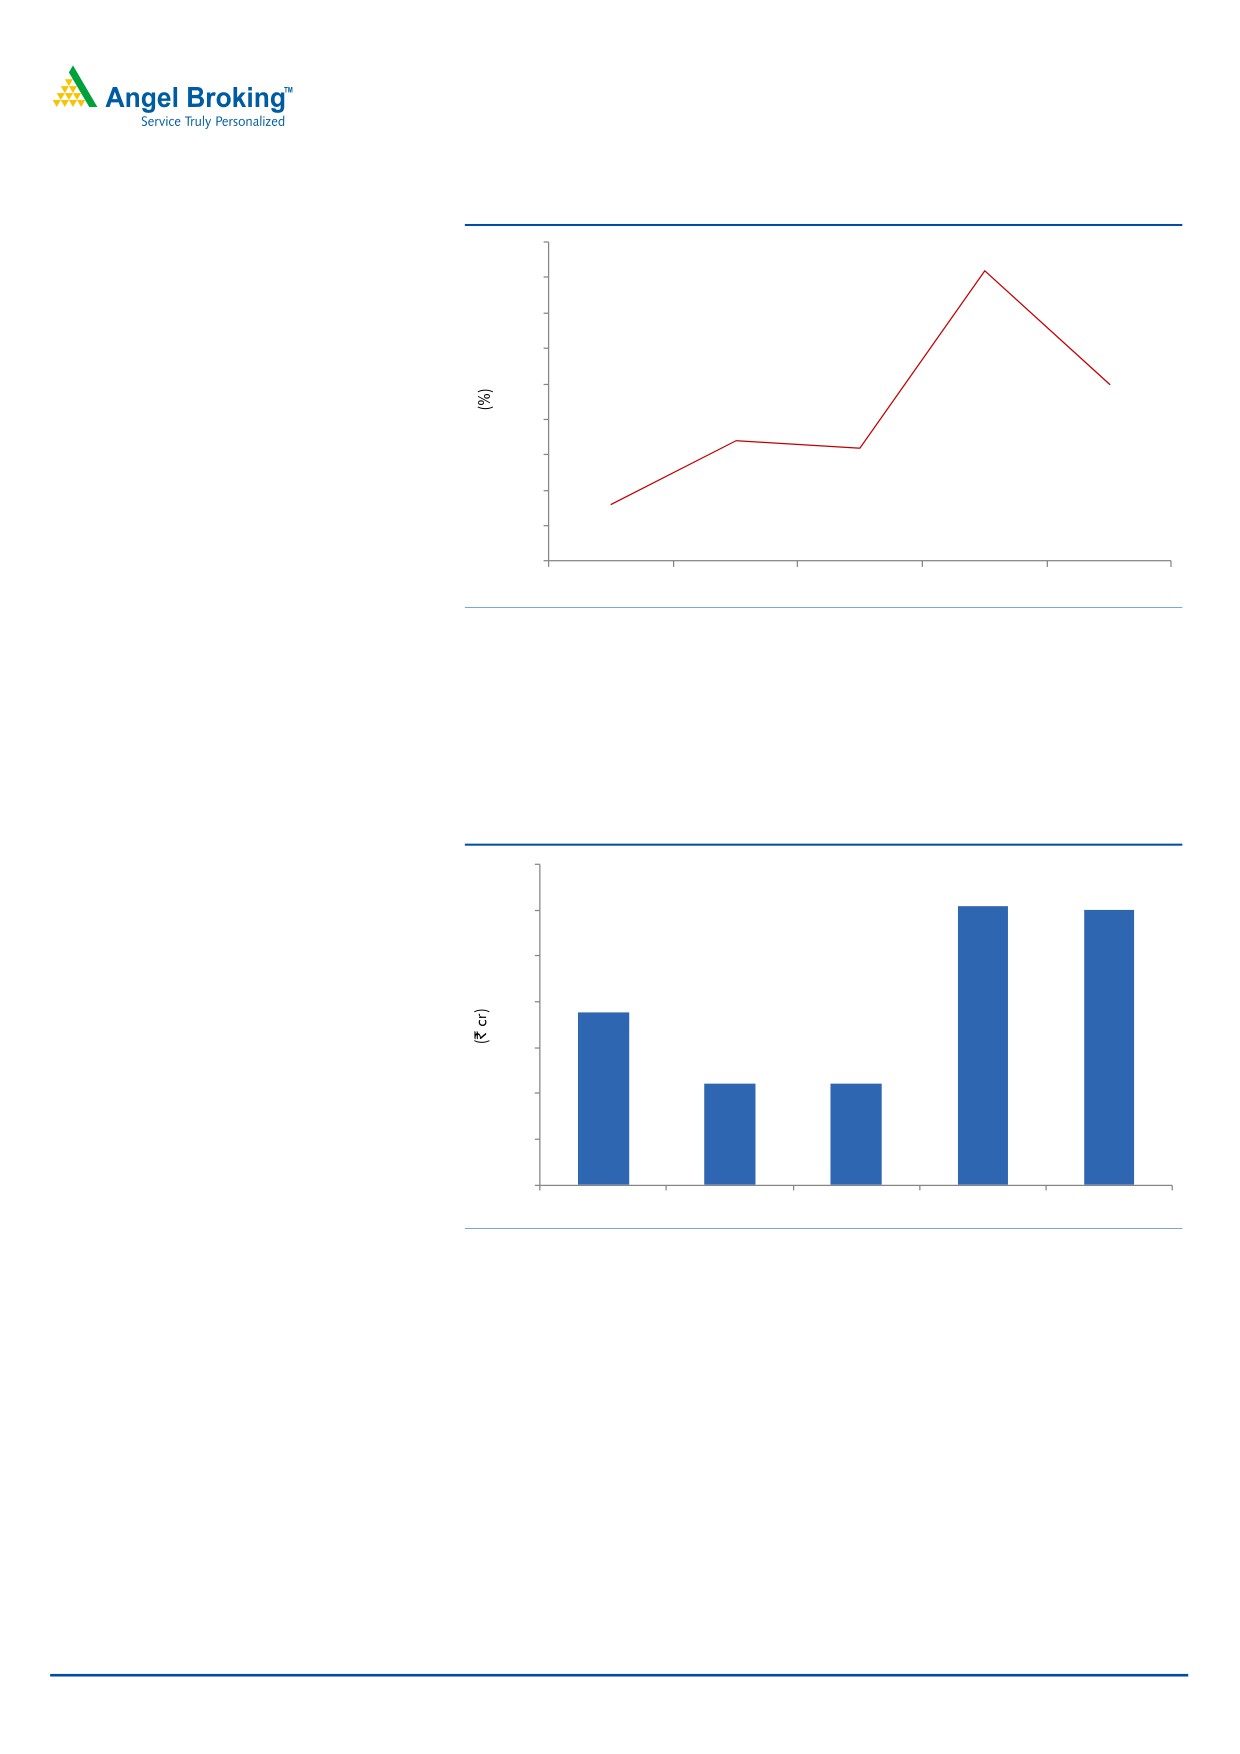
OPM in line with expectations
On the operating front, the OPM came in at 21.0% V/s 21.4% expected and V/s
19.3% in 3QFY2015. The expansion in the OPM was driven by expansion in the
GPM to 65.9% V/s 64.8% in 3QFY2015 and almost flat growth in staff and other
expenditure. R&D expenditure during the quarter came in at 10.1% V/s 8.7% of
sales in 3QFY2015.
February 24, 2016
3
Cadila Healthcare |3QFY2016 Result Update
Exhibit 5: OPM trend
23.0
22.5
22.6
22.0
21.5
21.0
21.0
20.5
20.0
20.2
20.1
19.5
19.0
19.3
18.5
3QFY2015
4QFY2015
1QFY2016
2QFY2016
3QFY2016
Source: Company, Angel Research
Net profit up 40.0% yoy: During the quarter, the company posted a other income
of `112cr V/s `39.9cr in 3QFY2015. This aided the net profit to come in at `389cr
(V/s `353cr expected) V/s `282cr in 3QFY2015, yoy growth of 38.2%. The Adj.
net profit came in at `390cr V/s `278cr in 3QFY2015, a yoy growth of 40.0%.
Exhibit 6: Adjusted Net profit trend
400
391
390
390
380
368
370
360
352
352
350
340
330
3QFY2015
4QFY2015
1QFY2016
2QFY2016
3QFY2016
Source: Company, Angel Research
Concall takeaways
Margin improvement during the quarter was primarily driven by higher US
and JV sales.
Currently, the company has transferred 11 products from Moraiya facility to
Ahmedabad based SEZ facility from its existing product portfolio. It is also in
the process of site transferring 4 more key products from future pipeline that
includes - Asacol HD and Prevacid ODT.
Currently, Moraiya facility supplies 60% of total US sales. In terms of pending
product approvals, Cadila Healthcare has filed 74 products from Moraiya
facility which includes 40% of total oral solid filings. Cadila Healthcare expects
February 24, 2016
4
Cadila Healthcare |3QFY2016 Result Update
the remediation measures at Moraiya facility to get completed over the next 3-
6 months. The Management highlighted that a re-inspection by USFDA might
be required for full resolution. Meanwhile the company has successfully
completed site transfer of 9 existing products and has already initiated site
transfers for four key upcoming launches (including Asacol HD, Toprol XL,
Prevacid ODT, etc).
R&D expenditure is expected to remain at 7-8% of sales in FY2016.
Tax rate as a % of PBT is expected to be around 20% in FY2017.
The Management has guided for higher capex in FY2017 with construction of
few greenfield and brownfield facilities.
Recommendation rationale
Strong domestic portfolio: Cadila is the fifth largest player in the domestic market,
with sales of about `2,677cr in FY2015; the domestic market contributes ~44% to
its top-line. The company enjoys a leadership position in the CVS, GI, women
healthcare and respiratory segments, and has a sales force of 4,500 executives.
The company, on an aggressive front, launched more than 75 new products in
FY2014. During FY2009-14, the company reported a ~13% CAGR in its top-line
in the domestic formulation business.
Further, the company has a strong consumer division through its stake in Zydus
Wellness, which has premium brands such as Sugarfree, Everyuth and Nutralite,
under its umbrella. This segment which contributes ~5.9% of sales, registered a
growth of 3.1% yoy during FY2015.
Going forward, the company expects the segment to grow at an above-industry
rate on the back of new product launches and field force expansion. In FY2014,
sales were lower; however, FY2015 witnessed a rebound. During FY2015-17E, we
expect the domestic segment to grow at a CAGR of 15.0%.
Exports on a strong footing: Cadila has a two-fold focus on exports, wherein it is
targeting developed as well as emerging markets, which contributed around 50%
to its FY2015 top-line. The company has established a formidable presence in the
developed markets of US, Europe (France and Spain) and Japan. In the US, the
company achieved critical scale of `3,393cr on the sales front in FY2015. The
growth in exports to the US along with other regions like Europe would be driven
by new product launches, going forward. Overall, exports are expected to post a
CAGR of 20.0% over FY2015-17E.
Outlook and valuation
We expect Cadila’s net sales to post an 18.0% CAGR to `11,840cr and EPS to
report a 24.6% CAGR to `17.6 over FY2015-17E. We maintain our Accumulate
rating on the stock.
February 24, 2016
5
Cadila Healthcare |3QFY2016 Result Update
Exhibit 7: Key Assumptions
Key assumptions
FY2016E
FY2017E
Domestic growth (%)
15.0
17.0
Exports growth (%)
20.0
20.0
Growth in employee expenses (%)
24.1
15.8
Operating margins (excl tech. know-how fees) (%)
21.0
22.0
Capex (` cr)
650
650
Source: Company, Angel Research
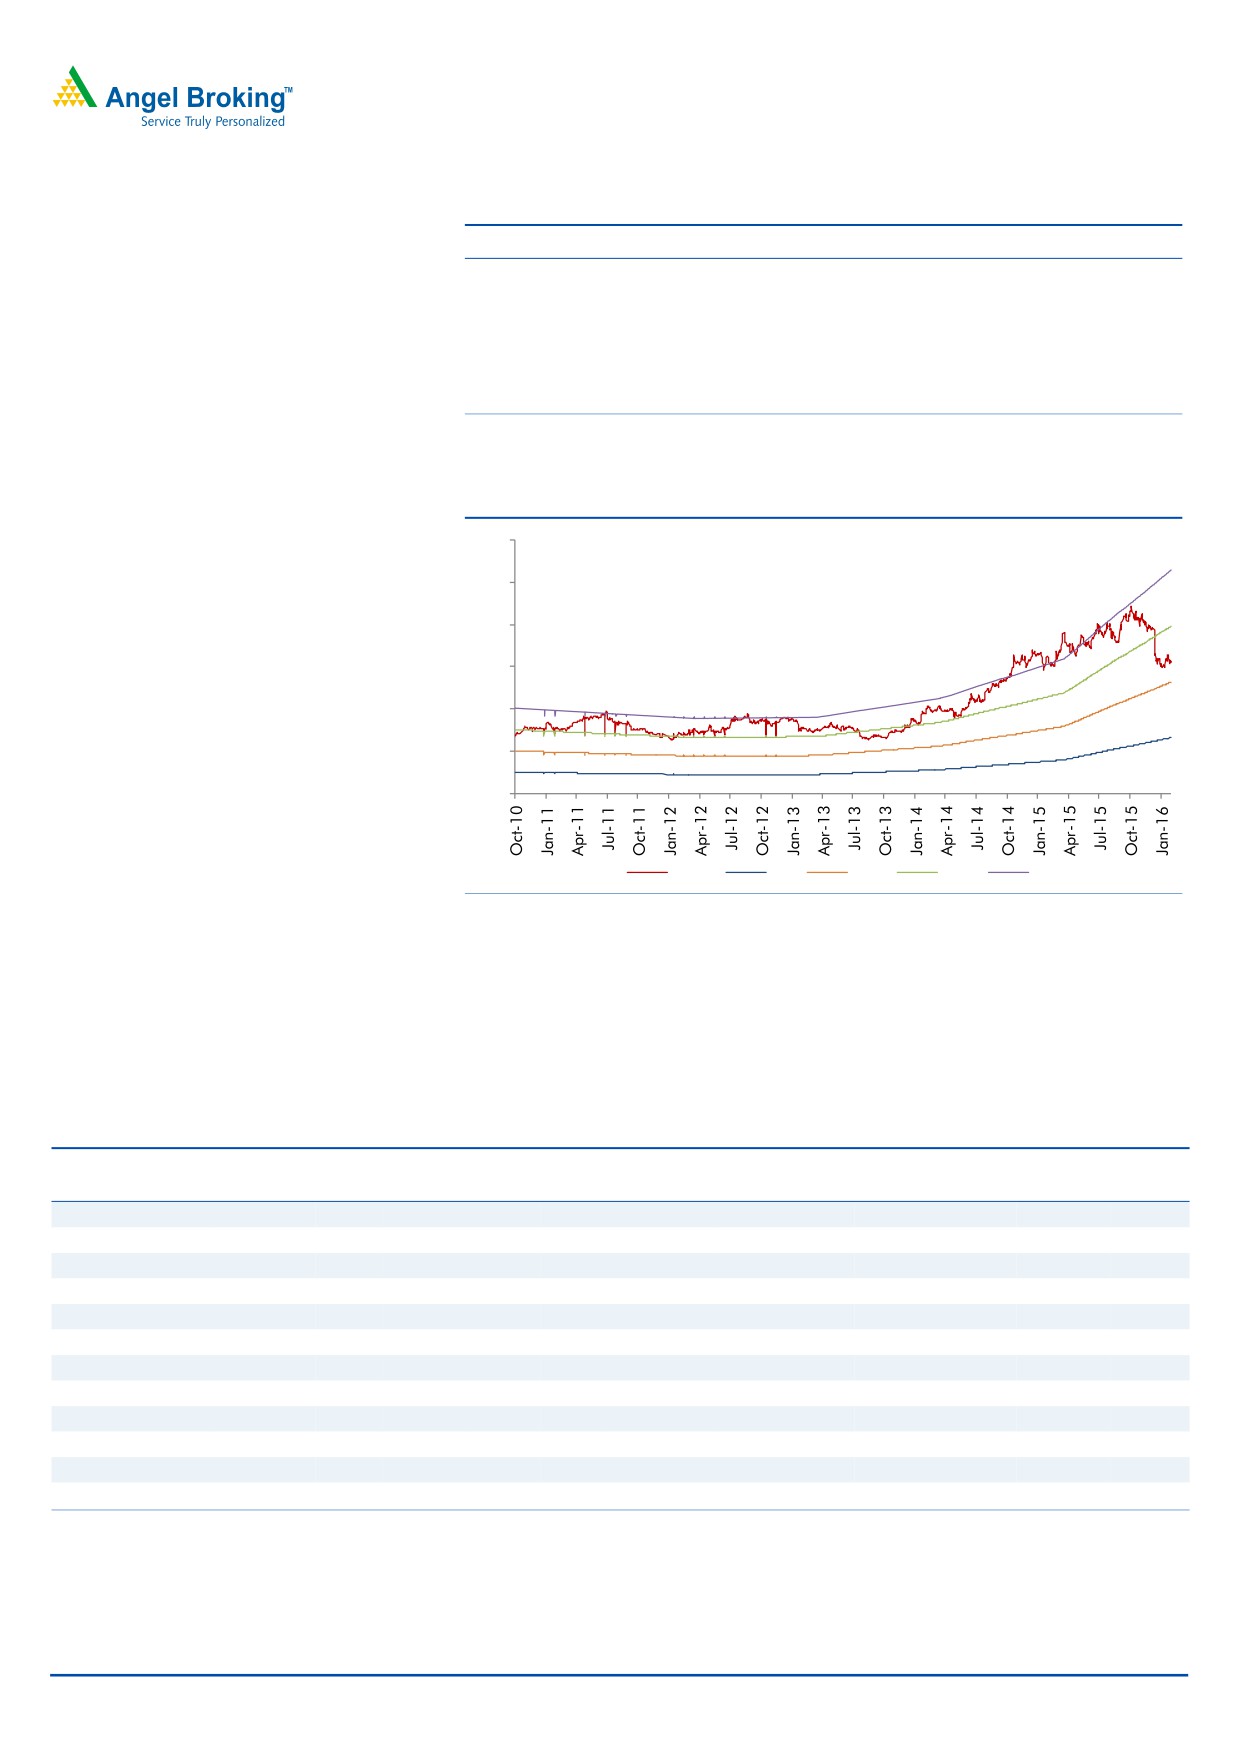
Exhibit 8: One-year forward PE band
600
500
400
300
200
100
0
Price
7x
14x
21x
28x
Source: Company
Company background: Cadila Healthcare‘s operations range across API,
formulations, animal health products and cosmeceuticals. The group has global
operations spread across USA, Europe, Japan, Brazil, South Africa and 25 other
emerging markets. Having already achieved the US$1bn sales mark in 2011, the
company believes to be a research-driven pharmaceutical company by 2020.
Exhibit 9: Recommendation Summary
Company
Reco
CMP Tgt. price Upside
FY2017E
FY15-17E
FY2017E
(`)
(`)
% PE (x) EV/Sales (x) EV/EBITDA (x)
CAGR in EPS (%) RoCE (%) RoE (%)
Alembic Pharma
Neutral
618
-
-
21.5
3.0
15.3
38.2
31.3
31.2
Aurobindo Pharma Buy
655
856
30.7
15.3
2.5
10.9
15.6
23.5
30.2
Cadila Healthcare Accumulate
330
352
6.8
18.7
2.8
12.8
24.6
25.2
29.0
Cipla
Buy
523
605
15.8
19.0
2.5
17.7
18.3
16.7
16.1
Dr Reddy's
Buy
3,075
3,933
27.8
17.2
2.6
11.1
17.2
19.1
20.4
Dishman Pharma
Neutral
295
-
-
14.8
1.6
7.5
15.9
9.4
11.0
GSK Pharma*
Neutral
3,217
-
-
47.1
8.2
37.2
6.6
33.7
34.3
Indoco Remedies
Neutral
251
-
-
18.5
2.0
11.1
23.0
19.7
19.7
Ipca labs
Buy
622
900
44.8
22.2
2.2
12.1
17.9
11.8
14.0
Lupin
Neutral
1,777
-
-
26.0
4.5
16.6
13.1
29.6
24.7
Sanofi India*
Neutral
4,304
-
-
28.4
3.7
17.7
33.1
27.9
25.5
Sun Pharma
Accumulate
871
950
9.1
32.4
5.8
18.7
8.4
15.8
16.6
Source: Company, Angel Research; Note: *December year ending
February 24, 2016
6
Cadila Healthcare |3QFY2016 Result Update
Profit & Loss statement (Consolidated)
Y/E March (` cr)
FY2012
FY2013
FY2014
FY2015
FY2016E
FY2017E
Gross sales
5,181
6,285
7,208
8,658
10,417
12,063
Less: Excise duty
91
129
148
161
193
223
Net sales
5,090
6,155
7,060
8,497
10,224
11,840
Other operating income
173
203
164
154
154
154
Total operating income
5,263
6,358
7,224
8,651
10,379
11,994
% chg
13.7
20.8
13.6
19.8
20.0
15.6
Total expenditure
4,179
5,232
6,024
6,896
8,073
9,229
Net raw materials
1,679
2,320
2,714
3,197
3,681
4,262
Other mfg costs
320
387
443
534
642
744
Personnel
751
903
1,071
1,209
1,500
1,737
Other
1,429
1,622
1,796
2,107
2,249
2,486
EBITDA
911
923
1,036
1,601
2,152
2,610
% chg
5.8
1.4
12.3
54.6
34.4
21.3
(% of Net Sales)
17.9
15.0
14.7
18.8
21.0
22.0
Depreciation& amortisation
158
183
201
287
304
373
EBIT
753
740
835
1,314
1,848
2,237
% chg
2.6
(1.7)
12.8
57.4
40.6
21.1
(% of Net Sales)
14.8
12.0
11.8
15.5
18.1
18.9
Interest & other charges
185
169
90
68
93
93
Other income
53
37
51
55
55
55
(% of PBT)
7
5
5
4
3
2
Recurring PBT
794
811
959
1,456
1,964
2,353
% chg
(5.7)
2.1
18.3
51.8
34.9
19.8
Extraordinary expense/(Inc.)
3
-
17
10
-
-
PBT (reported)
794
811
942
1,445
1,964
2,353
Tax
113.0
119.5
106.0
259.4
432.1
517.7
(% of PBT)
14.2
14.7
11.3
17.9
22.0
22.0
PAT (reported)
681
692
836
1,186
1,532
1,836
Less: Minority interest (MI)
28.6
36.4
32.6
35.5
35.5
35.5
PAT after MI (reported)
653
655
804
1,151
1,496
1,800
ADJ. PAT
650
655
819
1,159
1,496
1,800
% chg
(8.6)
0.8
25.0
41.5
29.1
20.3
(% of Net Sales)
12.8
10.6
11.4
13.5
14.6
15.2
Adj.Basic EPS (`)
6.3
6.4
8.0
11.3
14.6
17.6
Adj. Fully Diluted EPS (`)
6.3
6.4
8.0
11.3
14.6
17.6
% chg
(8.6)
0.8
25.0
41.5
29.1
20.3
February 24, 2016
7
Cadila Healthcare |3QFY2016 Result Update
Balance Sheet (Consolidated)
Y/E March (` cr)
FY2012
FY2013
FY2014
FY2015
FY2016E
FY2017E
SOURCES OF FUNDS
Equity share capital
102
102
102
102
102
102
Reserves & Surplus
2,471
2,938
3,337
4,149
5,358
6,871
Shareholders funds
2,574
3,040
3,439
4,252
5,460
6,973
Minority interest
90
119
144
169
204
240
Total loans
2,289
2,681
2,265
2,334
2,334
2,334
Other Long Term Liabilities
43
47
55
43
44
45
Long Term Provisions
79
64
76
110
77
78
Deferred tax liability
119
100
96
59
120
121
Total liabilities
5,193
6,053
6,075
6,966
8,118
9,667
APPLICATION OF FUNDS
Gross block
3,008
4,104
3,756
4,353
5,003
5,653
Less: Acc. depreciation
1,175
1,358
1,540
1,827
2,132
2,504
Net block
1,833
2,746
2,214
2,526
2,871
3,148
Capital Work-in-Progress
484
248
892
892
892
892
Goodwill
1,015
862
908
733
733
733
Investments
24
21
87
154
154
154
Long Term Loans and Adv.
263
411
495
637
595
716
Current assets
2,760
3,191
3,391
4,105
5,642
7,230
Cash
467
582
549
670
1,684
2,699
Loans & advances
275
279
341
334
335
336
Other
2,019
2,330
2,501
3,102
3,623
4,195
Current liabilities
1,186
1,426
1,912
2,081
2,768
3,206
Net Current assets
1,574
1,765
1,480
2,024
2,873
4,024
Mis. Exp. not written off
-
-
-
-
-
-
Total assets
5,193
6,053
6,075
6,966
8,118
9,667
February 24, 2016
8
Cadila Healthcare |3QFY2016 Result Update
Cash Flow Statement (Consolidated)
Y/E March (` cr)
FY2012 FY2013 FY2014 FY2015 FY2016E FY2017E
Profit before tax
794
811
942
1,445
1,964
2,353
Depreciation
158
183
201
287
304
373
(Inc)/Dec in Working Capital
(427)
(223)
168
(565)
207
(257)
Less: Other income
53
37
51
55
55
55
Direct taxes paid
113
119
106
259
432
518
Cash Flow from Operations
359
614
1,154
853
1,988
1,896
(Inc.)/Dec.in Fixed Assets
(743)
(860)
(296)
(597)
(650)
(650)
(Inc.)/Dec. in Investments
(4)
3
(65)
(68)
-
-
Other income
53
37
51
55
55
55
Cash Flow from Investing
(694)
(820)
(310)
(609)
(595)
(595)
Issue of Equity
-
-
-
-
-
-
Inc./(Dec.) in loans
1,238
382
(397)
91
(33)
2
Dividend Paid (Incl. Tax)
(175)
(175)
(216)
(287)
(287)
(287)
Others
(557)
115
(264)
74
(60)
(1)
Cash Flow from Financing
506
322
(877)
(122)
(380)
(286)
Inc./(Dec.) in Cash
171
116
(33)
121
1,013
1,015
Opening Cash balances
295
467
582
549
670
1,684
Closing Cash balances
467
582
549
670
1,684
2,699
February 24, 2016
9
Cadila Healthcare |3QFY2016 Result Update
Key Ratios
Y/E March
FY2012
FY2013
FY2014
FY2015
FY2016E
FY2017E
Valuation Ratio (x)
P/E (on FDEPS)
51.9
51.5
41.2
29.1
22.6
18.7
P/CEPS
41.7
40.2
33.0
23.3
18.7
15.5
P/BV
13.1
11.1
9.8
7.9
6.2
4.8
Dividend yield (%)
2.3
2.3
2.3
2.3
2.3
2.3
EV/Sales
1.7
1.4
1.1
4.1
3.3
2.8
EV/EBITDA
9.2
9.2
7.8
21.8
15.7
12.5
EV / Total Assets
1.6
1.4
1.3
5.0
4.2
3.4
Per Share Data (`)
EPS (Basic)
6.3
6.4
8.0
11.3
14.6
17.6
EPS (fully diluted)
6.3
6.4
8.0
11.3
14.6
17.6
Cash EPS
7.9
8.2
10.0
14.2
17.6
21.3
DPS
7.5
7.5
7.5
7.5
7.5
7.5
Book Value
25.1
29.7
33.6
41.5
53.3
68.1
Dupont Analysis
EBIT margin
14.8
12.0
11.8
15.5
18.1
18.9
Tax retention ratio
85.8
85.3
88.7
82.1
78.0
78.0
Asset turnover (x)
1.3
1.2
1.3
1.5
1.6
1.8
ROIC (Post-tax)
16.8
12.8
13.8
18.6
23.0
26.4
Cost of Debt (Post Tax)
9.4
5.8
3.2
2.4
3.1
3.1
Leverage (x)
0.5
0.7
0.6
0.4
0.3
0.0
Operating ROE
20.8
17.7
20.1
25.8
28.1
27.2
Returns (%)
ROCE (Pre-tax)
17.3
13.2
13.8
20.2
24.5
25.2
Angel ROIC (Pre-tax)
27.2
19.5
20.6
31.3
39.0
44.1
ROE
27.4
23.3
25.3
30.1
30.8
29.0
Turnover ratios (x)
Asset Turnover (Gross Block)
2.0
1.8
1.8
2.1
2.2
2.3
Inventory / Sales (days)
66
66
69
61
71
79
Receivables (days)
57
54
57
57
58
64
Payables (days)
49
42
55
46
53
53
WC (ex-cash) (days)
64
66
53
48
45
38
Solvency ratios (x)
Net debt to equity
0.7
0.7
0.5
0.4
0.1
(0.1)
Net debt to EBITDA
2.0
2.3
1.7
1.0
0.3
(0.1)
Interest Coverage (EBIT / Int.)
4.1
4.4
9.3
19.4
19.8
24.0
February 24, 2016
10
Cadila Healthcare |3QFY2016 Result Update
Research Team Tel: 022 - 39357800
DISCLAIMER
Angel Broking Private Limited (hereinafter referred to as “Angel”) is a registered Member of National Stock Exchange of India Limited,
Bombay Stock Exchange Limited and Metropolitan Stock Exchange of India Limited. It is also registered as a Depository Participant with
CDSL and Portfolio Manager with SEBI. It also has registration with AMFI as a Mutual Fund Distributor. Angel Broking Private Limited is
a registered entity with SEBI for Research Analyst in terms of SEBI (Research Analyst) Regulations, 2014 vide registration number
INH000000164. Angel or its associates has not been debarred/ suspended by SEBI or any other regulatory authority for accessing
/dealing in securities Market. Angel or its associates including its relatives/analyst do not hold any financial interest/beneficial
ownership of more than 1% in the company covered by Analyst. Angel or its associates/analyst has not received any compensation /
managed or co-managed public offering of securities of the company covered by Analyst during the past twelve months. Angel/analyst
has not served as an officer, director or employee of company covered by Analyst and has not been engaged in market making activity
of the company covered by Analyst.
This document is solely for the personal information of the recipient, and must not be singularly used as the basis of any investment
decision. Nothing in this document should be construed as investment or financial advice. Each recipient of this document should
make such investigations as they deem necessary to arrive at an independent evaluation of an investment in the securities of the
companies referred to in this document (including the merits and risks involved), and should consult their own advisors to determine
the merits and risks of such an investment.
Reports based on technical and derivative analysis center on studying charts of a stock's price movement, outstanding positions and
trading volume, as opposed to focusing on a company's fundamentals and, as such, may not match with a report on a company's
fundamentals.
The information in this document has been printed on the basis of publicly available information, internal data and other reliable
sources believed to be true, but we do not represent that it is accurate or complete and it should not be relied on as such, as this
document is for general guidance only. Angel Broking Pvt. Limited or any of its affiliates/ group companies shall not be in any way
responsible for any loss or damage that may arise to any person from any inadvertent error in the information contained in this report.
Angel Broking Pvt. Limited has not independently verified all the information contained within this document. Accordingly, we cannot
testify, nor make any representation or warranty, express or implied, to the accuracy, contents or data contained within this document.
While Angel Broking Pvt. Limited endeavors to update on a reasonable basis the information discussed in this material, there may be
regulatory, compliance, or other reasons that prevent us from doing so.
This document is being supplied to you solely for your information, and its contents, information or data may not be reproduced,
redistributed or passed on, directly or indirectly.
Neither Angel Broking Pvt. Limited, nor its directors, employees or affiliates shall be liable for any loss or damage that may arise from
or in connection with the use of this information.
Note: Please refer to the important ‘Stock Holding Disclosure' report on the Angel website (Research Section). Also, please refer to the
latest update on respective stocks for the disclosure status in respect of those stocks. Angel Broking Pvt. Limited and its affiliates may
have investment positions in the stocks recommended in this report.
Disclosure of Interest Statement
Cadila Healthcare
1. Analyst ownership of the stock
No
2. Angel and its Group companies ownership of the stock
No
3. Angel and its Group companies' Directors ownership of the stock
No
4. Broking relationship with company covered
No
Note: We have not considered any Exposure below ` 1 lakh for Angel, its Group companies and Directors
Ratings (Based on expected returns
Buy (> 15%)
Accumulate (5% to 15%)
Neutral (-5 to 5%)
over 12 months investment period):
Reduce (-5% to -15%)
Sell (< -15)
February 24, 2016
11