4QFY2016 Result Update | Cons. Durables
June 3, 2016
Blue Star
BUY
CMP
`415
Performance Highlights
Target Price
`495
Y/E March (` cr)
4QFY2016 4QFY2015
% chg (yoy) 3QFY2016
% chg (qoq)
Investment Period
12 Months
Net Sales
1,103
1,005
9.8
686
60.9
EBITDA
57
69
(17.4)
28
104.9
Stock Info
EBITDA margin (%)
5.2
6.9
(170)bp
4.1
111bp
Adj. PAT
24
68
(64.8)
7
253.9
Sector
Cons. Durable
Source: Company, Angel Research (Standalone)
Market Cap (` cr)
3,733
Blue Star’s standalone numbers for 4QFY2016 were subdued on the margin and
Net Debt
87
bottom-line front mainly on account of the company having to provide for the last
Beta
0.6
leg of the legacy orders. Sans the provision for legacy orders, the operating
profile was in-line with our estimates. The top-line grew by 9.8% yoy while the
52 Week High / Low
444 / 306
margin contracted by 170bp yoy to 5.2%. The company over the past two years
Avg. Daily Volume
11,723
has carried out multiple restructuring initiatives which include transferring its PEIS
Face Value (`)
2
business to its wholly owned subsidiary and amalgamating its associate Blue Star
Infotech (BSIL) with itself. There was net exceptional income of `48cr arising from
BSE Sensex
26,843
profit on sale of IT business of BSIL, as well as cost update on major contracts.
Nifty
8,221
Also owing to BSIL’s merger, the depreciation expense was significantly higher.
Reuters Code
BLUS.BO
Adjusting for the exceptional item, the net profit for the quarter came in at `24cr.
Bloomberg Code
BLSTR IN
Improvement in macro scenario to support growth: The Cooling/Unitary Products
Division (CPD/UPD) has been the key performer for the company, largely due to
its room air conditioning (RAC) business. The RAC business has been outgrowing the
industry by ~10% points over the last few quarters, resulting in the company
Shareholding Pattern (%)
consistently gaining market share from ~7% in FY2014 to 10.5% at present. Various
Promoters
39.5
industry players as well as the company Management have upgraded the FY2017
MF / Banks / Indian Fls
22.5
growth guidance for the industry from 12-15% earlier to 20% now which augurs well
FII / NRIs / OCBs
10.6
for the division. The company has also forayed into other products such as air coolers,
water purifiers and air purifiers which should drive growth for the division. As for
Indian Public / Others
27.4
Electro Mechanical Projects and Packaged Air-conditioning Systems (EMPPAC)
division, the order book is now clean and order inflow has started to pick up but
execution is a near term monitorable. We expect the gradual improvement in the
Abs.(%)
3m 1yr 3yr
macro scenario to drive the performance of the division.
Sensex
10.7
(1.3)
36.9
Outlook and valuation: We have upgraded our numbers to factor in higher
BLUESTAR
25.9
22.1
149.3
revenue guidance for the RAC business as well as improvement in performance of
the EMPPAC division. As reported in our earlier report(s), the merger with BSIL has
improved the balance sheet strength of the company by way of cash infusion which the
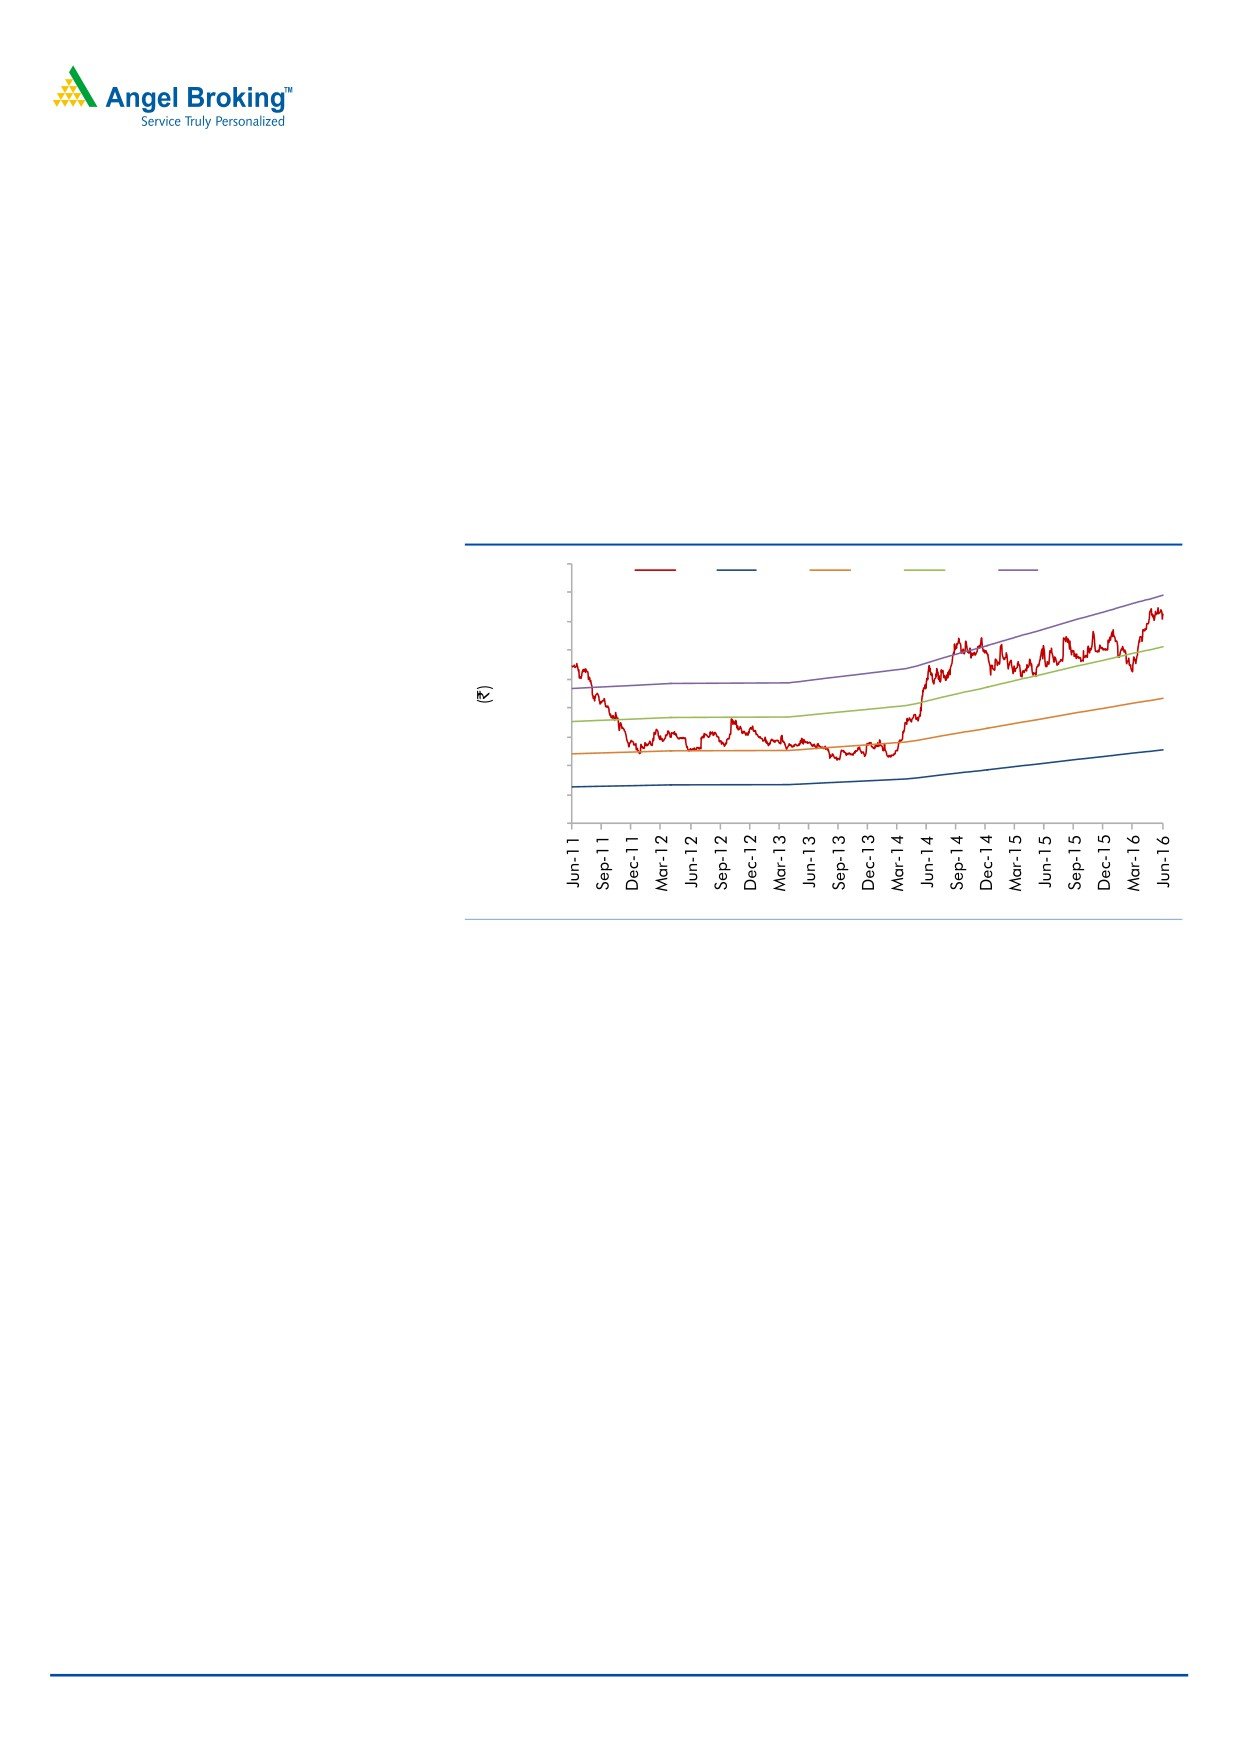
3 Year Price Chart
company will utilize to grow the UPD division as well as the exports of the company. At
600
the current market price, the stock trades at 20.1x its FY2018E earnings and at 0.8x
500
FY2018E EV/sales (while its close peer Voltas trades at 1.4x its FY2018E EV/sales). We
400
maintain our BUY recommendation on the stock with a target price of `495.
300
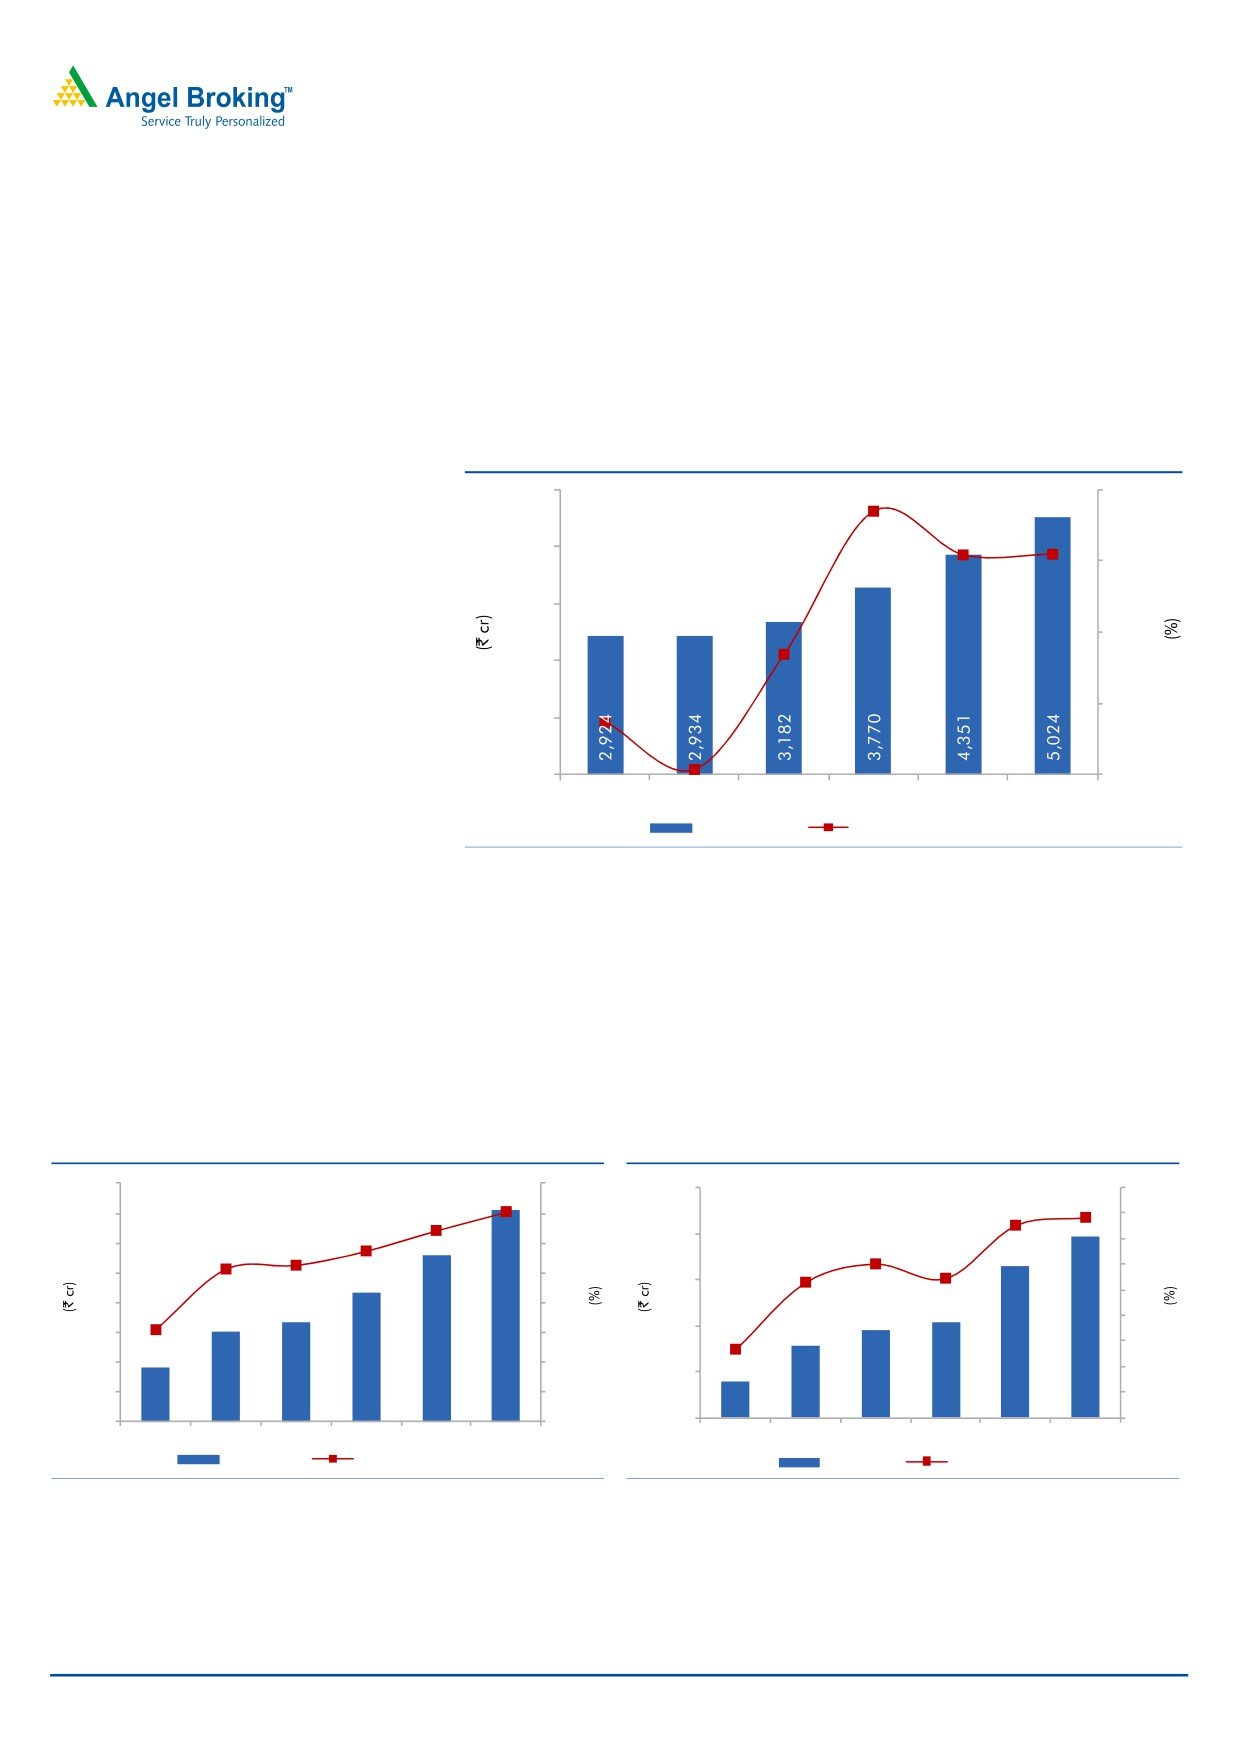
Key financials (Consolidated)
200
Y/E March (` cr)
FY2015
FY2016E
FY2017E
FY2018E
Net Sales
3,182
3,770
4,351
5,024
100
% chg
8.4
18.5
15.4
15.5
-
Net Profit
96
103
164
197
% chg
23.1
7.5
59.3
20.2
EBITDA (%)
5.3
5.7
6.4
7.1
EPS (`)
10.6
11.4
17.2
20.6
P/E (x)
39.0
36.3
24.2
20.1
P/BV (x)
8.2
5.6
5.2
4.5
RoE (%)
20.5
18.4
23.1
24.1
RoIC (%)
16.6
22.2
28.4
32.2
Milan Desai
EV/Sales (x)
1.3
1.1
0.9
0.8
+91 22 3935 7800 Ext: 6846
EV/EBITDA (x)
24.4
18.7
14.4
11.3
Source: Company, Angel Research
Please refer to important disclosures at the end of this report
1
Blue Star | 4QFY2016 Result Update
Exhibit 1: 4QFY2016 performance highlights (Standalone)
Y/E March (` cr)
4QFY2016
4QFY2015
yoy chg (%)
3QFY2016
qoq chg (%)
FY2016
FY2015
% chg
Net Sales
1,103
1005
9.8
686
60.9
3,414
3,081
10.8
Net raw material
813
720
12.9
472
72.2
2,427
2,134
13.8
(% of Sales)
73.7
71.6
205bp
68.9
482bp
71.1
69.3
184bp
Staff Costs
71
69
3.4
67
6.5
262
257
2.1
(% of Sales)
6.4
6.8
(40)bp
9.7
(328)bp
7.7
8.3
(66)bp
Other Expenses
162
148
10.1
119
36.4
547
517
5.8
(% of Sales)
14.7
14.7
4bp
17.4
(265)bp
16.0
16.8
(75)bp
Total Expenditure
1,046
936
11.8
658
59.0
3,237
2,907
11.3
Operating Profit
57
69
(17.4)
28
104.9
178
174
2.4
OPM
5.2
6.9
(170)bp
4.1
111bp
5.2
5.6
(43)bp
Interest
9
11
(21.8)
9
(1.9)
36
43
(18.3)
Depreciation
19
10
82.2
11
67.0
51
39
29.8
Other Income
5.5
3.6
51.9
1.4
302.2
9
10
(8.9)
Exceptional Item
48
38
(2)
30
42
PBT
83
89
(7.5)
7
1,106.1
130
143
12.6
(% of Sales)
7.5
8.9
1.0
3.8
4.6
Tax
11
(17)
2
21
(10)
(% of PBT)
13
(19)
30
16
(7)
Reported PAT
72
106
(32.4)
5
1394.2
110
153
(28.0)
Extraordinary Item
(48)
(38)
2
(30)
(42)
Adjusted PAT
24
68
(64.8)
7
253.9
80
111
(28.0)
PATM
2.2
6.8
1.0
2.3
3.6
Source: Company, Angel Research
Margin and bottom-line below expectations mainly on account of
provision
For 4QFY2016, the standalone top-line grew by 9.8% yoy to `1,103cr which is in-
line with our estimates. On the operating front, the EBITDA margin contracted by
170bp yoy to 5.2% largely owing to a 205bp yoy increase in raw material cost to
73.7% of sales. The depreciation expense was significantly higher on account of
BSIL’s merger, which added by ~`6cr to this expense head. There was a net
exceptional income of `48cr arising from profit on sale of IT business of BSIL, as
well as cost update on major contracts. Adjusting for the exceptional item, the net
profit came in at `24cr.
June 3, 2016
2
Blue Star | 4QFY2016 Result Update
Segment-wise performance
Exhibit 2: Segment-wise performance (Standalone)
Y/E March (` cr)
4QFY2016 4QFY2015 % chg (yoy) 3QFY2016 % chg (qoq)
Total Revenue
A) EMPPAC
439
361
21.5
459
(4.3)
B) Cooling Products
238
197
21.0
246
(3.2)
C) PEIS
9
38
(76.2)
12
(27.9)
Total
686
596
15.1
717
(4.3)
Less: Inter-Segmental Rev.
-
-
-
Net Sales
686
596
15.1
717
(4.3)
Segmental Profit
A) EMPPAC
26
3
785.5
26
(2.2)
B) Cooling Products
17
10
67.5
14
20.6
C) PEIS
2
7
(76.0)
2
(21.5)
Segmental Margin (%)
A) EMPPAC
5.8
0.8
505bp
5.7
12bp
B) Cooling Products
7.1
5.1
198bp
5.7
140bp
C) PEIS
18.7
18.5
17bp
17.2
153bp
Source: Company, Angel Research
Concall Takeaways
Order inflow for the year was up by ~19.0% yoy to `3,652cr while carry
forward order book grew by ~17.0% yoy to `1,628cr.
Metro accounts for ~22% of the order book and is likely to perform well. The
balance is made up of
18% industrial,
14% offices,
11% mixed use
development, 11% of power generation and distribution, 8% Malls,
8%
hospitals and 8% others.
While the order inflow has improved for the EMPPAC segment, the
Management is however cautious on the execution part in the near term on
factoring in the near term liquidity scenario. It has guided for margins to be in
the range of ~6%.
The RAC industry growth estimate has been revised to ~20% for FY2017 and
the company has guided for growth in excess of 30% for the same period.
The Jammu plant will likely be the first to commence production among
upcoming facilities, which is in FY2018E, and will add to the overall capacity
by 1.5 lakh units.
The company is focusing on growing its products business in the export
markets and is looking at three new countries in Africa.
June 3, 2016
3
Blue Star | 4QFY2016 Result Update
Investment Rationale
Improvement in macro scenario to support growth
The EMPPAC division of Blue Star contributed ~54% of total revenues in FY2015.
The division mainly caters to industrial/institution clients in sectors like IT/ITeS,
retail (including malls and multiplexes), healthcare, hospitality, infrastructure, etc.
The order execution and finalization has been witnessed to be sluggish in the
recent past, thereby affecting the segment. With slow recovery in various client
industries and improvement in the economic environment post interest rate cuts,
we expect the segment to recover and be a key contributor to the company’s
overall top-line.
Quality order execution to support EBITDA margin expansion
The company continues to be selective in terms of order booking; such practice
has hurt its margins in the past. So far, the delay in execution of high-margin
projects, coupled with delayed closure of low margin jobs, has resulted in snail-
paced expansion of the EBITDA margin. The carry forward order book has been
witnessing upward movement over the past few quarters and with legacy jobs
coming off the books, we expect the segment’s profitability to improve from here
on.
Cooling Products division to be the backbone
The superior performance of the division is mainly on the back of high growth seen
in the RAC segment which is consistently growing at 10% points faster than the
overall RAC market. The company has been able to leverage on its cultivated
perception of being a “Cooling Expert” and successfully grown its market share
from ~7% levels in FY2015 to the present 10.5%. As a result of this growth, the
Cooling Products segment’s share as a percentage of total revenue has increased
from 23.4% in FY2009 to ~43.2% in FY2016 (ex of BSIL numbers) and the
segment in recent times has been delivering better profitability than the other
major segment - EMMPAC. We expect the division to be a key contributor as there
is significant potential to capitalize on the underpenetrated RAC market in India.
Blue Star can add to its current market share as it has good channel coverage and
it has been selectively expanding the channel network in tier 3, 4 and 5 cities.
Foray into newer products and focus on growing international
business
Blue Star has forayed into new areas like air purifiers and air coolers in FY2016.
As per Management estimates, the domestic air purifiers market is of ~`200cr,
which it expects to grow by 5x over the next five years. Further the Management
sounded confident that it can rely on its brand equity to successfully scale up the
air coolers business using its vast channel network.
Additionally, the company post its merger with Blue Star Infotech Ltd (BSIL) will be
using the cash influx to grow its international business. Apart from this, the
company has entered into a 51% joint venture with W. J. Towell & Co. LLC, Oman,
in the MEP contracting business. The company intends to scale up the business to
`500cr over the next few years.
June 3, 2016
4
Blue Star | 4QFY2016 Result Update
Financials
Improvement in revenue growth
We are building in revenue CAGR of 15.4% over FY2016-18E to `5,024 on
account of 1) strong growth prospects of the Cooling/Unitary Products division led
by increased demand and penetration of room air conditioners and
2)
improvement in prospects of the EMPPAC division.
Exhibit 3: Revenue growth estimates
5,500
18.5
20.0
15.4
15.5
4,500
15.0
3,500
10.0
2,500
8.4
5.0
1,500
3.7
0.4
500
-
FY2013
FY2014
FY2015
FY2016
FY2017E FY2018E
Revenue (LHS)
Revenue growth (RHS)
Source: Company, Angel Research
EBITDA margin to improve
We expect the EMPPAC segment’s performance to improve considering that the
order book clean up has now been done and that the new margin should be at
~6.0% as guided by the Management. We expect the EBITDA margin to improve
from 5.7% in FY2016 to 7.1% in FY2018E. Consequently, the net profit is expected
to be at `197cr in FY2018E.
Exhibit 4: EBITDA margin to improve
Exhibit 5: PAT expected to improve
400
8.0
250
4.5
3.9
3.8
350
7.1
7.0
4.0
200
300
6.4
6.0
3.0
3.5
5.7
2.7
5.3
3.0
250
5.0
5.1
150
2.6
2.5
200
4.0
2.0
100
150
3.1
3.0
1.5
1.3
100
2.0
1.0
50
50
1.0
0.5
90
150
167
216
280
354
39
78
96
103
164
197
-
-
-
-
FY2013
FY2014 FY2015 FY2016 FY2017E FY2018E
FY2013
FY2014 FY2015 FY2016 FY2017E FY2018E
EBITDA (LHS)
EBITDA margin (RHS)
PAT (LHS)
PAT margin (RHS)
Source: Company, Angel Research
Source: Company, Angel Research
June 3, 2016
5
Blue Star | 4QFY2016 Result Update
Outlook and valuation
We have upgraded our numbers to factor in higher revenue guidance for the RAC
business as well as improvement in performance of the EMPPAC division. As
reported in our earlier report(s), the merger with BSIL has improved the balance
sheet strength of the company by way of cash infusion which the company will
utilize to grow the UPD division as well as the exports of the company. At the current
market price, the stock trades at 20.1x its FY2018E earnings and at 0.8x FY2018E
EV/sales (while its close peer Voltas trades at 1.5x its FY2018E EV/sales). We maintain
our BUY recommendation on the stock with a target price of `495.
Exhibit 6: One year forward EV/sales band
5,000
EV
0.4x
0.6x
0.8x
1.0x
4,500
4,000
3,500
3,000
2,500
2,000
1,500
1,000
500
Source: Company, Angel Research
Key concerns
Slowdown in investment cycle may impact order inflow, thus impacting
revenue. It may also force the Management to compromise on its strategy of
avoiding low margin projects.
Any slowdown in consumer segments like IT/ITES, healthcare, hospitality and
infrastructure could impact the company’s growth.
Foreign exchange fluctuations have a direct impact on the profit of the
Cooling Products division since commercial refrigerators are imported. Any
further depreciation in the local currency may impact the company’s profits.
The RAC industry has been witnessing high traction and the company has
been able to outperform the industry over the past few years. Any unexpected
drop in performance of the RAC industry would pose a threat to our estimates.
June 3, 2016
6
Blue Star | 4QFY2016 Result Update
Company Background
Blue Star is India's largest central air-conditioning company with a network of
32 offices, seven manufacturing facilities, over
2,000 dealers and around
2,500 employees. The company’s operations could be classified under three main
segments:
EMPPACS: This segment comprises central and packaged air-conditioning
(involving design, engineering, manufacturing, installation, commissioning and
support of large central air conditioning plants, packaged air conditioners and
ducted split air conditioners) as well as electrical projects and plumbing and fire
fighting projects. In addition, the company promotes after-sales service as a
business, by offering several value added services in the areas of upgrades and
enhancements, air management, water management, energy management and
LEED consultancy for Green Buildings.
Cooling Products: Blue Star offers a wide range of contemporary window and split
air conditioners. The company also manufactures and markets a comprehensive
range of commercial refrigeration products and services that cater to the industrial,
commercial and hospitality sectors.
PEIS: This division has been the exclusive distributor in India for many
internationally renowned manufacturers of hi-tech professional electronic
equipment and services, as well as industrial products and systems.
June 3, 2016
7
Blue Star | 4QFY2016 Result Update
Profit and loss statement (Consolidated)
Y/E March (` cr)
FY2014
FY2015
FY2016E
FY2017E
FY2018E
Total operating income
2,934
3,182
3,770
4,351
5,024
% chg
0.4
8.4
18.5
15.4
15.5
Net Raw Materials
2,087
2,214
2,607
3,010
3,487
Personnel
248
267
346
387
432
Other
450
533
600
674
751
Total Expenditure
2,784
3,015
3,554
4,072
4,670
EBITDA
150
167
216
280
354
% chg
(1.8)
8.3
17.9
14.6
14.7
(% of Net Sales)
5.1
5.3
5.7
6.4
7.1
Depreciation& Amortisation
38
43
60
56
63
EBIT
113
124
156
223
291
% chg
97.4
10.2
25.4
43.4
30.5
(% of Net Sales)
3.8
3.9
4.1
5.1
5.8
Interest (incl. forex loss)
54
49
43
37
33
Other Income
18
8
17
21
22
(% of Net Sales)
0.6
0.3
0.4
0.5
0.4
Exceptional Items
(0.1)
(41.4)
5.6
-
-
PBT
76
43
135
207
281
% chg
87.1
(44.0)
217.5
53.0
35.7
Tax
2
(8)
27
44
84
(% of PBT)
2.9
(18.5)
19.9
21.0
30.0
PAT (reported)
74
51
108
164
197
Extraordinary (Expense)/Inc.
0
41
(6)
-
-
Share of Profit of Associate
4
4
-
-
-
Minority Interest
0
ADJ. PAT
78
96
103
164
197
% chg
98.6
23.1
7.5
59.3
20.2
(% of Net Sales)
2.6
3.0
2.7
3.8
3.9
Basic EPS (`)
8.6
10.6
11.4
17.2
20.6
Fully Diluted EPS (`)
8.6
10.6
11.4
17.2
20.6
% chg
198.6
123.1
107.5
150.3
120.2
June 3, 2016
8
Blue Star | 4QFY2016 Result Update
Balance sheet (Consolidated)
Y/E March (` cr)
FY2014
FY2015
FY2016E
FY2017E
FY2018E
SOURCES OF FUNDS
Equity Share Capital
18
18
18
19
19
Pref. Share Capital/Suspense
18
-
173
-
-
Reserves& Surplus
443
438
472
735
857
Shareholders’ Funds
479
456
663
754
876
Minority Interest
-
-
1
1
1
Total Loans
494
398
364
333
305
Deferred Tax Liability
(1)
(17)
(22)
(22)
(22)
Other Long Term Liabilities
4
7
11
11
11
Total Liabilities
976
843
1,016
1,077
1,171
APPLICATION OF FUNDS
Gross Block
514
549
625
700
784
Less: Acc. Depreciation
269
304
364
420
483
Net Block
245
245
260
279
300
Capital Work-in-Progress
15
22
15
60
60
Goodwill
11
11
9
8
6
Investments
33
36
223
111
111
Long term Loans & adv
120
139
190
205
221
Current Assets
1,911
1,704
1,870
2,088
2,391
Cash
68
44
54
44
37
Loans & Advances
130
116
112
128
148
Inventory
466
479
540
627
718
Debtors
833
795
888
971
1,122
Other current assets
414
270
275
317
366
Current liabilities
1,359
1,315
1,551
1,673
1,919
Net Current Assets
552
389
319
414
472
Misc. Exp. not written off
-
-
-
-
-
Total Assets
976
843
1,016
1,077
1,171
June 3, 2016
9
Blue Star | 4QFY2016 Result Update
Cash flow statement (Consolidated)
Y/E March (` cr)
FY2014 FY2015 FY2016E FY2017E FY2018E
Profit before tax
76
43
135
207
281
Depreciation
38
43
60
56
63
Change in Working Capital
(47)
139
79
(105)
(65)
Other income
(18)
(8)
(17)
(21)
(22)
Direct taxes paid
(2)
(7)
(33)
(44)
(84)
Others
37
28
-
-
-
Cash Flow from Operations
83
237
226
93
173
(Inc.)/Dec. in Fixed Assets
(71)
(43)
(66)
(118)
(83)
(Inc.)/Dec. in Investments
(6)
(3)
(187)
111
-
(Inc.)/Dec. In L.T loans and adv
(8)
(20)
(51)
(14)
(17)
Other income
18
8
17
21
22
Others
62
(14)
-
-
-
Cash Flow from Investing
(6)
(71)
(286)
0
(77)
Issue of Equity
18
(18)
173
2
-
Inc./(Dec.) in loans
73
(97)
(33)
(31)
(28)
(Dec.)/Inc. in long term prov.
(1)
2
5
-
-
Forex diff. on cash equivalent
-
-
-
-
-
Dividend Paid (Incl. Tax)
(42)
(54)
(70)
(75)
(75)
Others
(74)
(23)
(4)
-
-
Cash Flow from Financing
(26)
(190)
70
(103)
(103)
Inc./(Dec.) in Cash
52
(24)
10
(10)
(7)
Opening Cash balances
17
68
44
54
44
Closing Cash balances
68
44
54
44
37
June 3, 2016
10
Blue Star | 4QFY2016 Result Update
Key ratios
Y/E March
FY2014
FY2015
FY2016E
FY2017E
FY2018E
Valuation Ratio (x)
P/E (on FDEPS)
48.1
39.0
36.3
24.2
20.1
P/CEPS
32.3
26.9
22.9
18.0
15.2
P/BV
7.8
8.2
5.6
5.2
4.5
Dividend yield (%)
1.0
1.2
1.6
1.6
1.6
EV/Sales
1.4
1.3
1.1
0.9
0.8
EV/EBITDA
27.6
24.4
18.7
14.4
11.3
EV / Total Assets
4.3
4.8
4.0
3.7
3.4
Per Share Data (`)
EPS (Basic)
8.6
10.6
11.4
17.2
20.6
EPS (fully diluted)
8.6
10.6
11.4
17.2
20.6
Cash EPS
12.8
15.4
18.1
23.1
27.2
DPS
4.0
5.0
6.5
6.5
6.5
Book Value
53.2
50.7
73.7
79.1
91.9
Returns (%)
ROCE (Pre-tax)
12.5
13.6
16.7
21.3
25.9
Angel ROIC (Pre-tax)
14.6
16.6
22.2
28.4
32.2
ROE
17.7
20.5
18.4
23.1
24.1
Turnover ratios (x)
Asset Turnover (Gross Block)
6.1
6.0
6.4
6.6
6.8
Inventory / Sales (days)
61
54
49
49
49
Receivables (days)
104
93
81
81
81
Payables (days)
176
162
147
150
150
WC cycle (ex-cash) (days)
57
47
29
27
29
Solvency ratios (x)
Net debt to equity
0.9
0.8
0.4
0.2
0.2
Net debt to EBITDA
2.6
1.9
0.4
0.6
0.4
Interest Coverage (EBIT / Int.)
2.1
2.6
3.6
6.0
8.9
June 3, 2016
11
Blue Star | 4QFY2016 Result Update
Research Team Tel: 022 - 39357800
DISCLAIMER
Angel Broking Private Limited (hereinafter referred to as “Angel”) is a registered Member of National Stock Exchange of India Limited,
Bombay Stock Exchange Limited and Metropolitan Stock Exchange of India Limited. It is also registered as a Depository Participant with
CDSL and Portfolio Manager with SEBI. It also has registration with AMFI as a Mutual Fund Distributor. Angel Broking Private Limited is
a registered entity with SEBI for Research Analyst in terms of SEBI (Research Analyst) Regulations, 2014 vide registration number
INH000000164. Angel or its associates has not been debarred/ suspended by SEBI or any other regulatory authority for accessing
/dealing in securities Market. Angel or its associates including its relatives/analyst do not hold any financial interest/beneficial
ownership of more than 1% in the company covered by Analyst. Angel or its associates/analyst has not received any compensation /
managed or co-managed public offering of securities of the company covered by Analyst during the past twelve months. Angel/analyst
has not served as an officer, director or employee of company covered by Analyst and has not been engaged in market making activity
of the company covered by Analyst.
This document is solely for the personal information of the recipient, and must not be singularly used as the basis of any investment
decision. Nothing in this document should be construed as investment or financial advice. Each recipient of this document should
make such investigations as they deem necessary to arrive at an independent evaluation of an investment in the securities of the
companies referred to in this document (including the merits and risks involved), and should consult their own advisors to determine
the merits and risks of such an investment.
Reports based on technical and derivative analysis center on studying charts of a stock's price movement, outstanding positions and
trading volume, as opposed to focusing on a company's fundamentals and, as such, may not match with a report on a company's
fundamentals.
The information in this document has been printed on the basis of publicly available information, internal data and other reliable
sources believed to be true, but we do not represent that it is accurate or complete and it should not be relied on as such, as this
document is for general guidance only. Angel Broking Pvt. Limited or any of its affiliates/ group companies shall not be in any way
responsible for any loss or damage that may arise to any person from any inadvertent error in the information contained in this report.
Angel Broking Pvt. Limited has not independently verified all the information contained within this document. Accordingly, we cannot
testify, nor make any representation or warranty, express or implied, to the accuracy, contents or data contained within this document.
While Angel Broking Pvt. Limited endeavors to update on a reasonable basis the information discussed in this material, there may be
regulatory, compliance, or other reasons that prevent us from doing so.
This document is being supplied to you solely for your information, and its contents, information or data may not be reproduced,
redistributed or passed on, directly or indirectly.
Neither Angel Broking Pvt. Limited, nor its directors, employees or affiliates shall be liable for any loss or damage that may arise from
or in connection with the use of this information.
Note: Please refer to the important ‘Stock Holding Disclosure' report on the Angel website (Research Section). Also, please refer to the
latest update on respective stocks for the disclosure status in respect of those stocks. Angel Broking Pvt. Limited and its affiliates may
have investment positions in the stocks recommended in this report.
Disclosure of Interest Statement
Blue Star
1. Analyst ownership of the stock
No
2. Angel and its Group companies ownership of the stock
No
3. Angel and its Group companies' Directors ownership of the stock
No
4. Broking relationship with company covered
No
Note: We have not considered any Exposure below ` 1 lakh for Angel, its Group companies and Directors
Ratings (Based on expected returns
Buy (> 15%)
Accumulate (5% to 15%)
Neutral (-5 to 5%)
over 12 months investment period):
Reduce (-5% to -15%)
Sell (< -15)
June 3, 2016
12