2QFY2016 Result Update | Auto Ancillary
November 2, 2015
Bharat Forge
BUY
CMP
`862
Performance Highlights
Target Price
`1,016
Y/E March - Standalone (` cr) 2QFY16 2QFY15
% chg (yoy) 1QFY16
% chg (qoq)
Investment Period
12 Months
Net Sales
1,117
1,138
(1.9)
1,129
(1.0)
EBITDA
321
325
(1.0)
346
(7.1)
Stock Info
EBITDA margin (%)
28.8
28.5
30 bp
30.7
(190 bp)
Sector
Auto Ancillary
Adjusted PAT
175
179
(2.0)
195
(10.4)
Source: Company, Angel Research
Market Cap (` cr)
20,068
For 2QFY2016, Bharat Forge Ltd (BFL)’s results have come in below estimates.
Net Debt (` cr)
1,187
Beta
1.2
The top-line declined marginally, led by a steep decline in industrial exports which
is
owing to weakness in the oil and gas segment. A subdued
52 Week High / Low
1,363/805
top-line and adverse mix (industrial exports have high machining component)
Avg. Daily Volume
243,839
negated most of the benefits of lower steel prices. Given the subdued top-line, the
Face Value (`)
2.0
net profit too declined marginally on a yoy basis.
BSE Sensex
26,559
Nifty
8,051
Top-line declines marginally: After seven consecutive quarters of double-digit
Reuters Code
BFRG.BO
growth, BFL’s revenues declined by 2% yoy to `1,117cr during the quarter. The decline
was led by the export segment which dipped by 9%. Industrial segment exports declined
Bloomberg Code
BHFC@IN
sharply by 32% yoy due to weakness in the oil and gas sector. The domestic market, in
contrast, grew a healthy 9% yoy led by the non-auto segment, which reported a growth
Shareholding Pattern (%)
of 20% yoy.
Promoters
46.7
Subdued topline and adverse mix impacts profitability: BFL’s revenues were under
MF / Banks / Indian Fls
21.6
pressure during the quarter, which led to operating deleverage. Further, the
FII / NRIs / OCBs
18.5
product mix worsened given the decline in the industrial export segment which
Indian Public / Others
13.2
levied pressure on profitability. The net profit, at `175cr, declined by 2% yoy.
Outlook and valuation: The outlook in the near term remains subdued given the
pressures in the industrial export segment (particularly in the oil and gas space).
Abs. (%)
3m 1yr 3yr
However, BFL expects the topline to return to double digit growth rate from
Sensex
(5.5)
(4.7)
41.6
FY2017 on back of expected recovery in the commercial vehicle export markets.
Bharat Forge
(24.8)
6.1
219.0
Further, the ramp up in the passenger vehicle exports due to new order wins and
addition of new customers and markets in the export industrial segments would
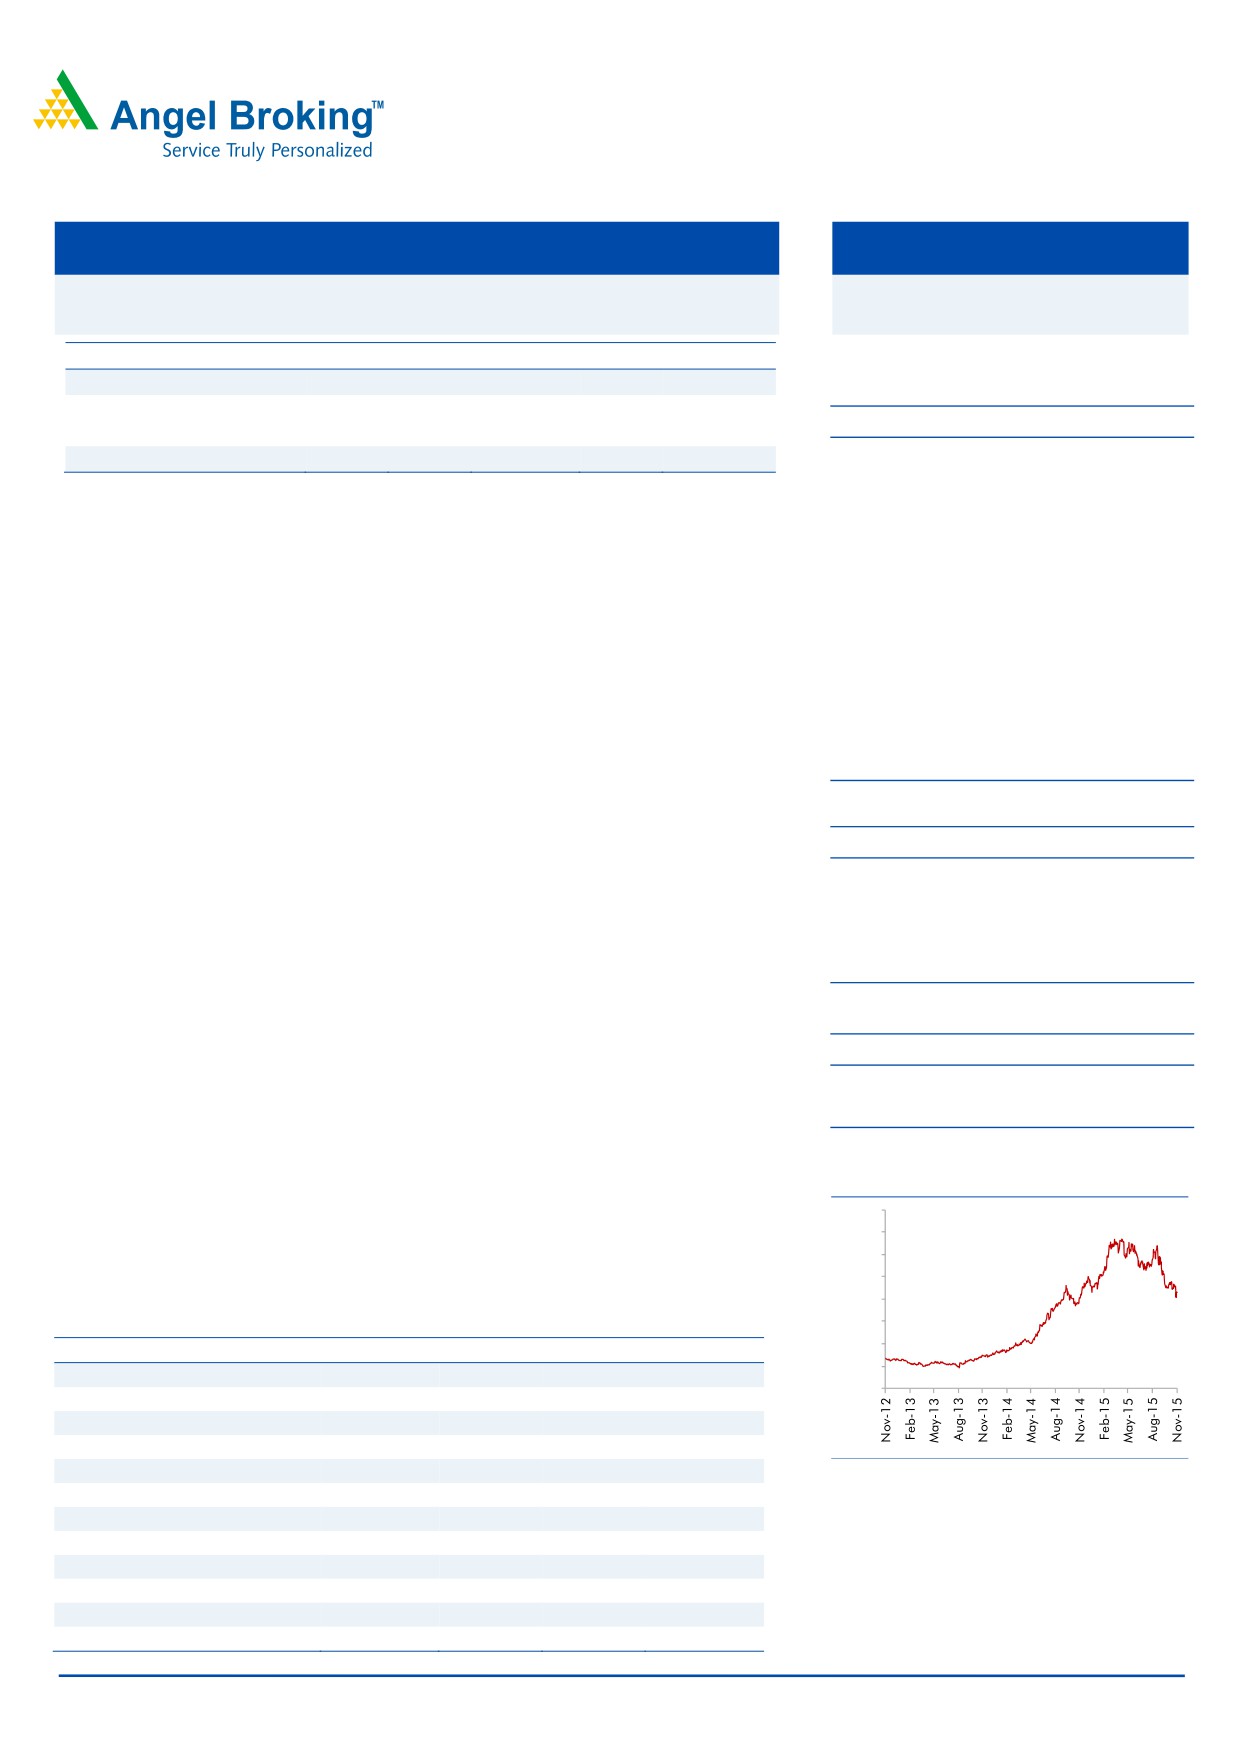
3-year price chart
enable BFL to outpace industry growth. Given the focus on technological
1,600
innovation and the ability to tap new segments and customer base, we have
1,400
1,200
positive view on the stock. We assign Buy rating to the stock with a price target of
1,000
`1,016 (based on 24x FY2017 earnings).
800
600
Key financials (Consolidated)
400
Y/E March (` cr)
FY2014
FY2015 FY2016E
FY2017E
200
Net sales
6,716
7,625
8,013
9,250
0
% chg
17.8
13.5
5.1
15.4
Net profit
267
646
819
986
% chg
17.3
142.0
26.8
20.3
EBITDA (%)
15.3
18.9
20.0
20.3
Source: Company, Angel Research
EPS (`)
11.5
27.8
35.2
42.3
P/E (x)
40.3
26.3
24.5
20.4
P/BV (x)
7.5
5.8
4.8
4.0
RoE (%)
10.8
21.1
21.6
21.4
RoCE (%)
13.4
19.3
19.1
21.1
Bharat Gianani
EV/Sales (x)
3.0
2.7
2.6
2.2
022-3935 7800 Ext: 6817
EV/EBITDA (x)
20.2
14.8
13.1
10.9
Source: Company, Angel Research
Please refer to important disclosures at the end of this report
1
Bharat Forge | 2QFY2016 Result Update
Exhibit 1: Financial performance (Standalone)
Y/E March (` cr)
2QFY16
2QFY15
% chg (yoy)
1QFY16
% chg (qoq)
1HFY16
1HFY15
% chg (yoy)
Net Sales
1,117
1,138
(1.9)
1,129
(1.0)
2,245
2,126
5.6
Consumption of RM
407
456
(10.8)
398
2.4
805
816
(1.3)
(% of Sales)
36.5
40.1
35.3
35.9
38.4
Staff Costs
92
81
14.0
92
(0.4)
185
160
15.1
(% of Sales)
8.2
7.1
8.2
8.2
7.5
Manufacturing expenses
182
193
(5.5)
183
(0.2)
365
378
(3.5)
(% of Sales)
16.3
16.9
16.2
16.2
17.8
Other Expenses
114
84
36.2
110
3.9
224
165
35.6
(% of Sales)
10.2
7.3
9.7
10.0
7.8
Total Expenditure
795
814
(2.2)
782
1.7
1,578
1,518
3.9
Operating Profit
321
325
(1.0)
346
(7.1)
668
608
9.8
OPM (%)
28.8
28.5
30.7
29.7
28.6
Interest
22
31
(29.1)
21
4.4
44
63
(30.9)
Depreciation
65
66
(1.6)
64
1.6
130
132
(1.9)
Other Income
25
30
(15.1)
29
(11.7)
54
54
0.2
PBT
259
257
0.9
289
(10.4)
549
467
17.5
(% of Sales)
23.2
22.6
25.6
24.4
22.0
Provision for Taxation
84
78
7.6
94
(10.3)
178
144
24.3
(% of PBT)
32.5
30.5
32.5
32.5
30.7
Extraordinary items
0
(4)
NA
0
NA
0
(4)
NA
Reported PAT
175
174
0.3
195
(10.4)
370
319
15.9
Adjusted PAT
175
179
(2.0)
195
(10.4)
370
324
14.5
Adj. PATM
15.7
15.7
17.3
16.5
15.2
Equity capital (cr)
47
47
47
47
47
Reported EPS (`)
7.5
7.5
0.3
8.4
(10.4)
15.9
13.7
15.9
Adjusted EPS (`)
7.5
7.7
(2.0)
8.4
(10.4)
15.9
13.9
14.5
Source: Company, Angel Research
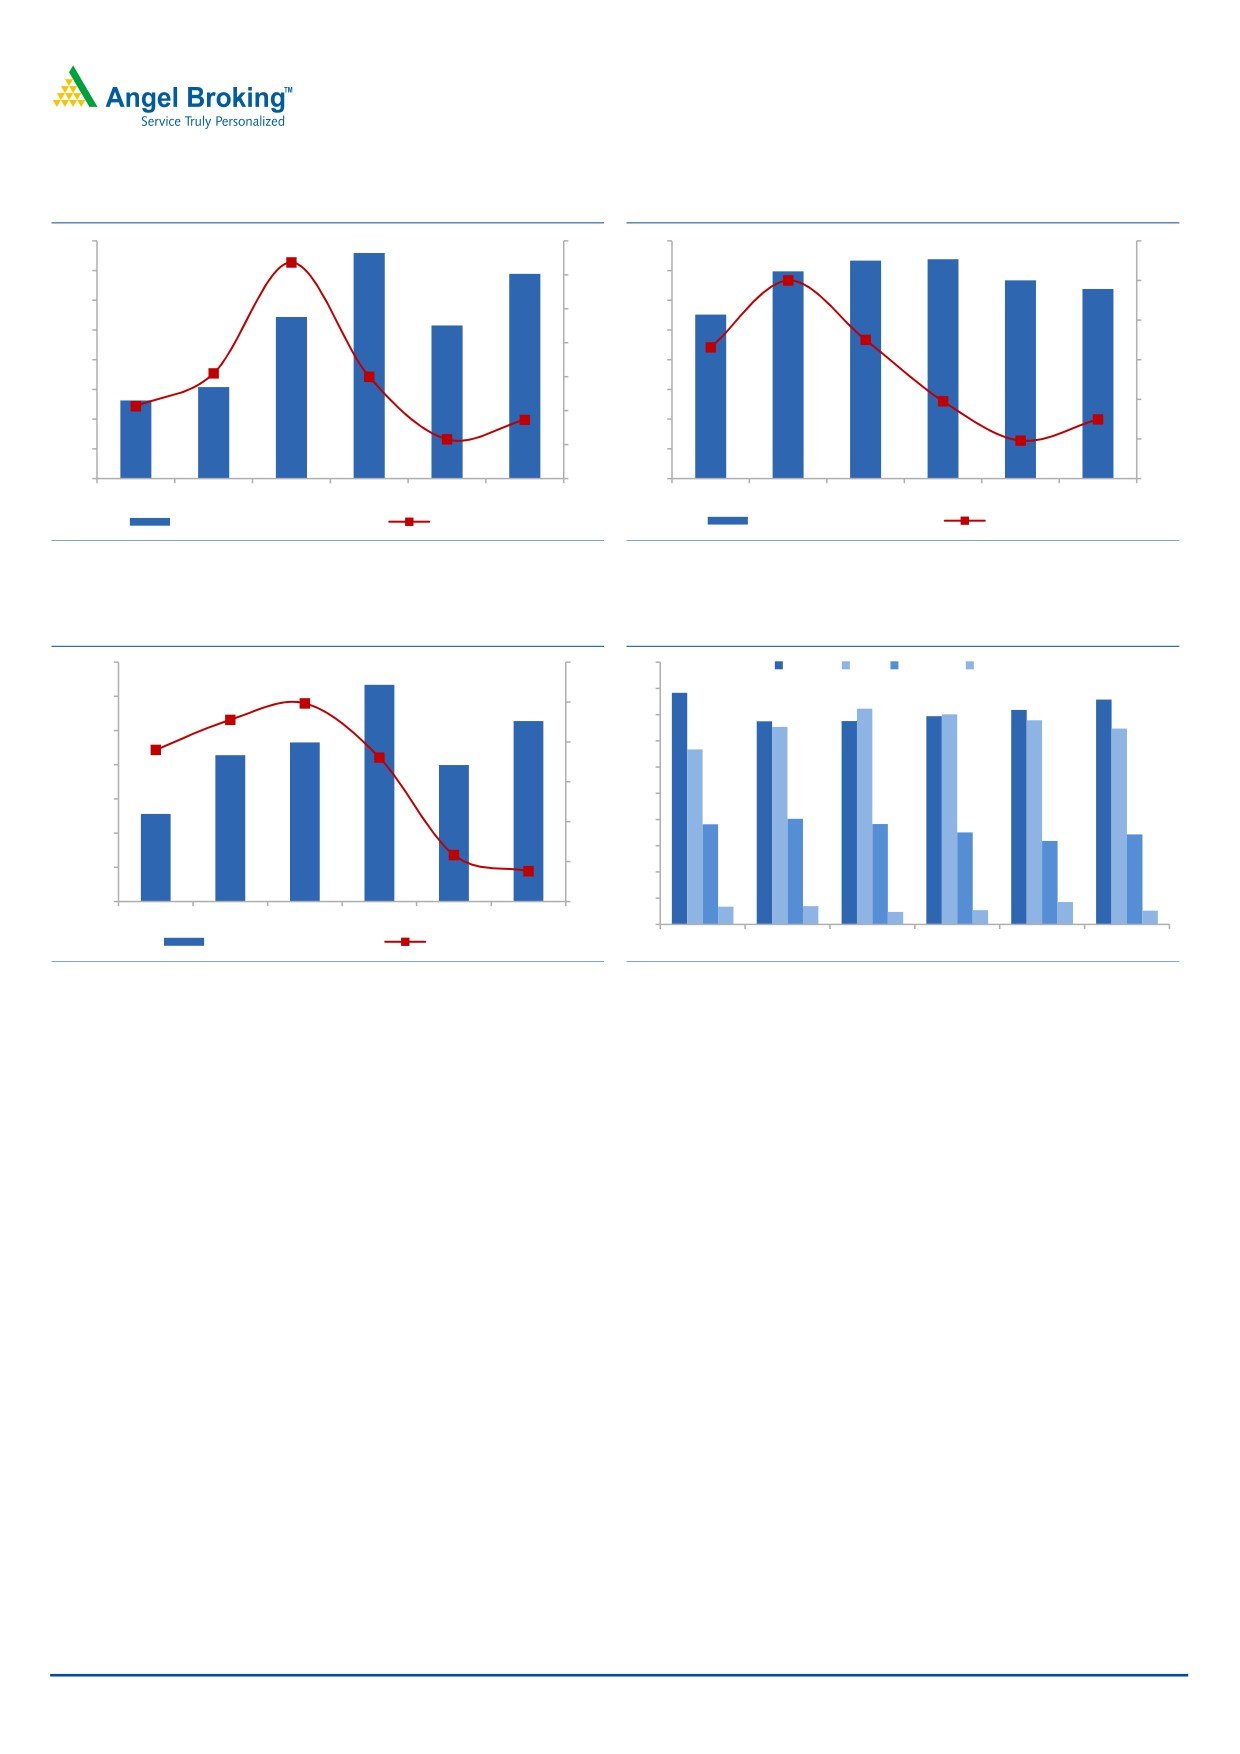
Standalone revenues under pressure due to steep decline in industrial exports: For
2QFY2016, standalone revenues were under pressure, declining by 2% yoy to
`1,117cr, owing to a steep 9% yoy decline in export revenues. While the export
automotive segment grew by a healthy 15% yoy due to ramp up in the passenger
vehicle business, the export non-automotive segment declined sharply by 32% yoy
due to slowdown in the oil and gas sector. In contrast, domestic revenues grew
8.6% yoy led by a strong 20% growth in the non-automotive segment. The
domestic automotive segment revenues grew by 3% yoy. BFL’s overall volumes
grew
4% yoy, driven by the domestic segment; however, the net average
realization declined 5.5% yoy on account of an adverse product-mix (decline in the
high machining export industrial segment). The USD/INR realization on the exports
front stood at `66.6/USD, up 1% qoq.
November 2, 2015
2
Bharat Forge | 2QFY2016 Result Update
Exhibit 2: Domestic revenues continue to recover
Exhibit 3: Exports remain sluggish
490
35
800
40
480
30
700
30
470
600
25
20
460
500
20
450
400
10
15
440
300
0
10
430
200
(10)
420
5
100
410
0
0
(20)
1QFY15
2QFY15
3QFY15
4QFY15
1QFY16
2QFY16
1QFY15
2QFY15
3QFY15
4QFY15
1QFY16
2QFY16
Domestic revenues (` cr)
Growth yoy (%)
Export revenues (` cr)
Growth yoy (%)
Source: Company, Angel Research
Source: Company, Angel Research
Exhibit 4: Volume growth dragged by exports
Exhibit 5: Geographical break-up of revenue
58,000
30
50
India
US Europe
Others
44
43
45
41
41
56,000
4040
25
39
39
39
38
37
40
54,000
33
20
35
52,000
30
15
25
50,000
20
19
19
18
17
10
20
16
48,000
15
5
46,000
10
44,000
0
5
1QFY15
2QFY15
3QFY15
4QFY15
1QFY16
2QFY16
0
Shipment tonnage (MT)
Growth yoy (%)
1QFY15
2QFY15
3QFY15
4QFY15
1QFY16
2QFY16
Source: Company, Angel Research
Source: Company, Angel Research
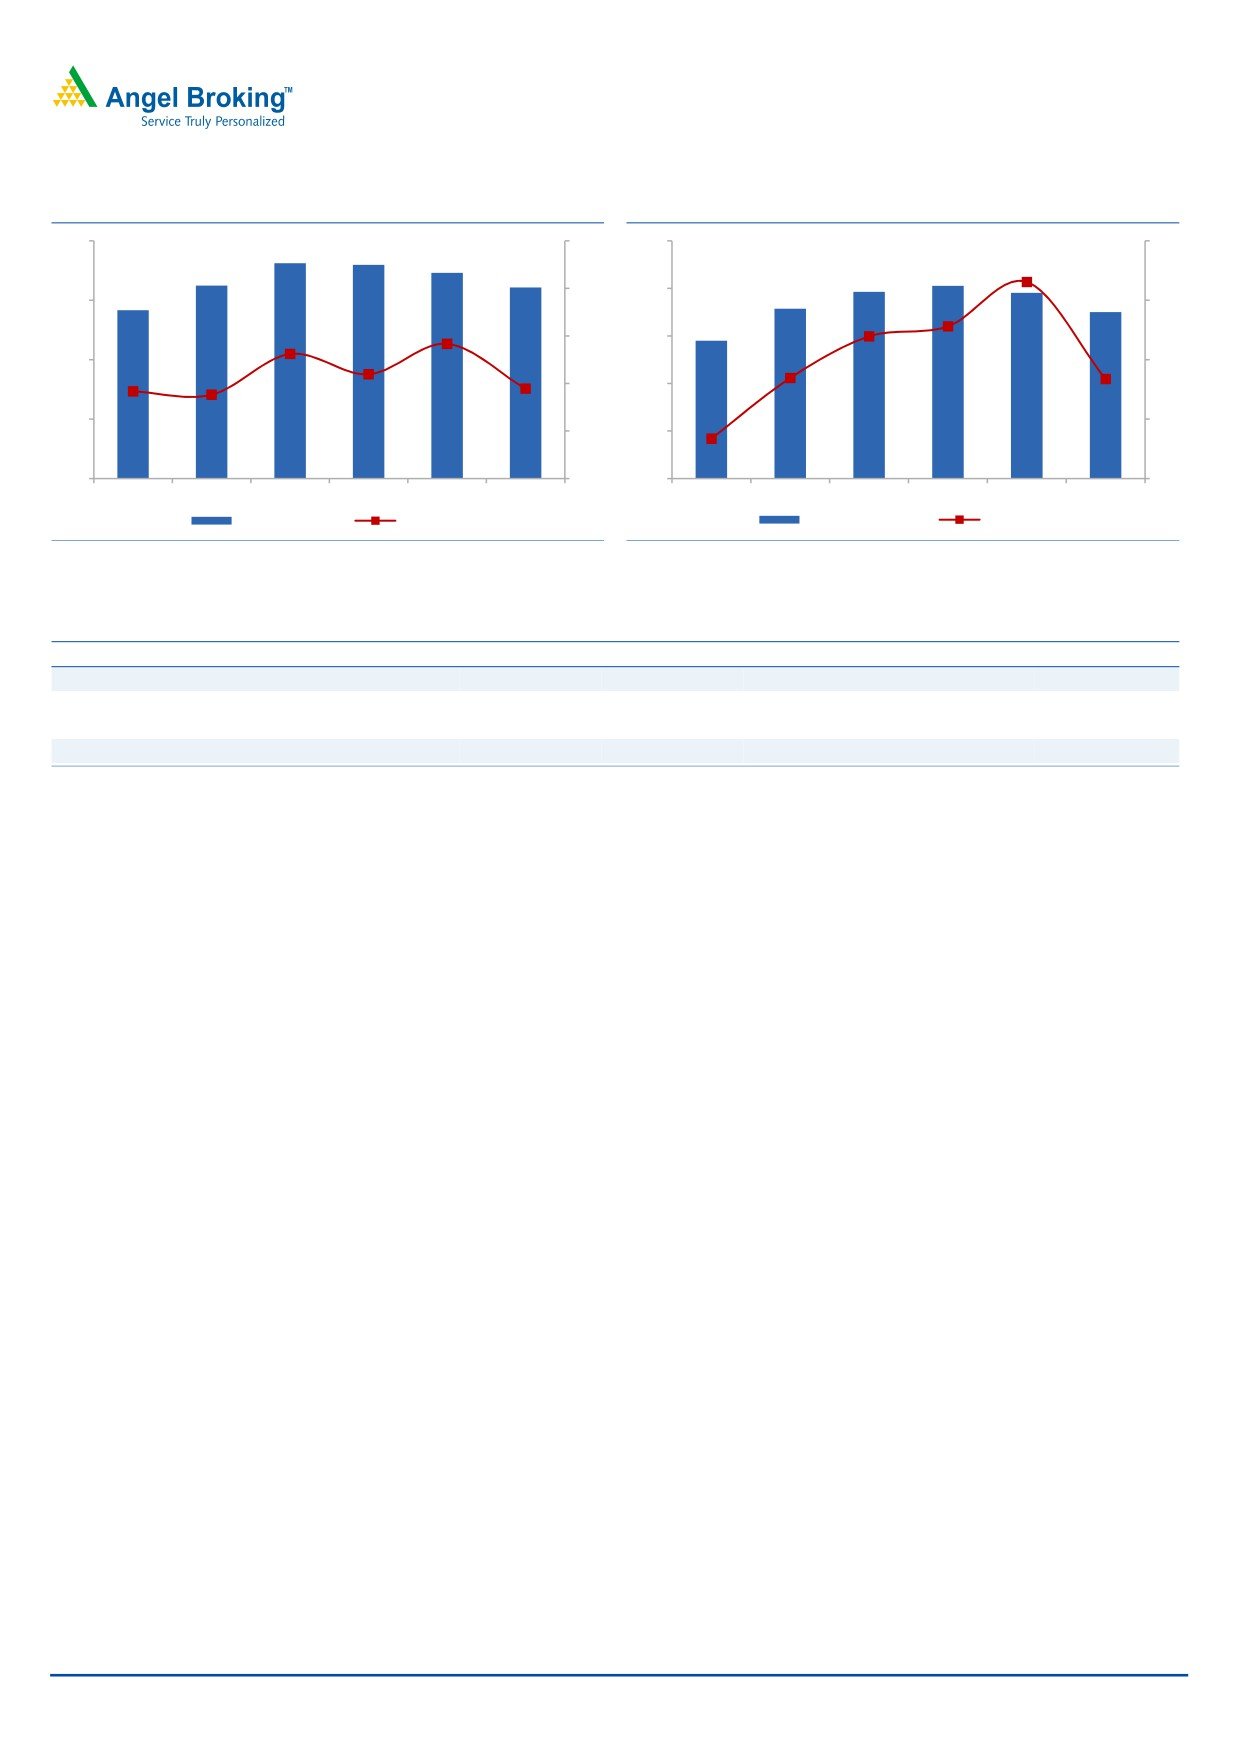
EBITDA margins up marginally yoy: On the operating front, EBITDA margins
improved marginally by 30bp yoy to 28.8%, driven primarily by softness in steel
prices. Raw material cost/sales declined 360bp yoy to 36.5%. However, the
subdued top-line resulted in operating deleverage, thus leading to a 220bp yoy
increase in other expenditure. As a result the benefits of lower commodity prices
got negated. On a sequential basis, however, margins declined 190bp, mainly
due to an adverse product mix. Led by a subdued top-line, the net profit declined
marginally by 2% yoy to `175cr.
November 2, 2015
3
Bharat Forge | 2QFY2016 Result Update
Exhibit 6: EBITDA margin grows marginally
Exhibit 7: Subdued top-line impacts profitability
400
35
250
18
33
200
300
17
31
150
200
16
29
100
100
15
27
50
0
25
0
14
1QFY15
2QFY15
3QFY15
4QFY15
1QFY16
2QFY16
1QFY15
2QFY15
3QFY15
4QFY15
1QFY16
2QFY16
EBIDTA (` cr)
Margin (%)
Net Profit (` cr)
Margin (%)
Source: Company, Angel Research
Source: Company, Angel Research
Exhibit 8: Subsidiaries’ performance
Y/E December - Overseas subsidiary (` cr)
July-Sep 15
July-Sep 14
% chg (yoy)
Apr-June 15
% chg (qoq)
Net Sales
549
543
1.0
601
(8.6)
EBITDA
36
31
14.7
38
(4.8)
EBITDA margin (%)
6.5
5.7
80 bp
6.3
20 bp
Profit before tax
(3)
1
0
Source: Company, Angel Research
Overseas subsidiaries’ performance remains subdued: The company’s overseas
subsidiaries’ performance remained under pressure, given the weak global
demand. The top-line at `549cr remained flat on a yoy basis. The margin
improved 80bp yoy, given the cost control initiatives. However due to higher
depreciation and interest expenses, the subsidiaries reported a loss at the PBT
level.
November 2, 2015
4
Bharat Forge | 2QFY2016 Result Update
Investment arguments
Automotive business to grow driven by domestic CV upcycle and ramp up in
PV segment: BFL is the leader in the domestic MHCV segment, commanding a
market share of ~60%. BFL would be the beneficiary of an upcycle in the
MHCV space (MHCV is likely to grow at 15% CAGR over FY2015-2018) due
to economic recovery and huge pent up demand getting converted into sales.
Also, BFL has received orders from two new passenger vehicle OEMs for
supply to various platforms which would boost its revenues going ahead.
Further, the US and the European CV segments are also expected to recover
gradually, thus boosting demand.
Industrial segment to provide huge growth opportunity: BFL aims to increase
the share of the industrial segment from 45% of standalone revenues in
FY2015 to 60%, going ahead. The government’s “Make in India” initiative
would result in localization in a host of sectors such as defence, aerospace,
power, and metal & mining, which throws a huge opportunity for BFL. Also
given the economic recovery, the domestic investment cycle is likely to improve
which would provide impetus to the industrial segment. BFL is also tapping the
industrial segment in export markets by introducing new products, which
would boost growth for the company.
Well diversified business model: BFL has a fairly diversified presence. Over the
years it has enhanced revenue stream by entering new global markets and
new segment particularly in the non-auto space. The share of the auto
business declined from about 80% in FY2007 to about 55% currently. Also the
contribution of India business has reduced from 60% in FY2010 to about 40%
currently. Given the broad-based presence, BFL has de-risked itself from
possible sharp economic downturns in any particular region/segment.
Outlook and valuation
The outlook in the near term remains subdued given the pressures in the industrial
export segment (particularly in the oil and gas space). However, BFL expects the
topline to return to double digit growth rate from FY2017 on back of expected
recovery in the commercial vehicle export markets. Further, the ramp up in the
passenger vehicle exports due to new order wins and addition of new customers
and markets in the export industrial segments would enable BFL to outpace
industry growth. Given the focus on technological innovation and the ability to tap
new segments and customer base, we have positive view on the stock. We assign
Buy rating to the stock with a price target of `1,016 (based on 24x FY2017
earnings).
November 2, 2015
5
Bharat Forge | 2QFY2016 Result Update
Company background
Bharat Forge, a global forging conglomerate, is the largest exporter of automotive
components from India and a leading chassis component manufacturer in the
world. The company manufactures a wide range of safety and critical components
for passenger cars, SUVs, LCVs, MHCVs and tractors through its facilities spread
across locations globally - India (4), Germany (3) and Sweden (1). BHFC also
produces forged and machined components for non-automotive industries, such
as power generation, marine, oil & gas, railways and construction. The automotive
industry currently contributes ~55% to the company's consolidated revenue;
although through diversification BHFC expects the share of the automotive
industry's revenue to fall to ~40%.
November 2, 2015
6
Bharat Forge | 2QFY2016 Result Update
Profit and loss statement (Consolidated)
Y/E March (` cr)
FY2012
FY2013
FY2014
FY2015
FY2016E
FY2017E
Total operating income
6,279
5,702
6,716
7,625
8,013
9,250
% chg
23.4
(9.2)
17.8
13.5
5.1
15.4
Total expenditure
5,283
4,933
5,686
6,184
6,410
7,372
Net raw material costs
2,913
2,531
2,461
2,884
2,965
3,423
Employee expenses
780
801
789
905
962
1,110
Other
1,589
1,601
2,436
2,395
2,484
2,840
EBITDA
996
769
1,030
1,441
1,603
1,878
% chg
(41.0)
(22.8)
33.9
39.9
11.2
17.2
(% of total op. income)
15.9
13.5
15.3
18.9
20.0
20.3
Depreciation & amortization
302
336
357
362
391
420
EBIT
694
433
673
1,078
1,211
1,458
% chg
(51.6)
(37.6)
55.3
60.2
12.3
20.3
(% of total op. income)
11.1
7.6
10.0
14.1
15.1
15.8
Interest and other charges
186
191
169
136
132
119
Other income
92
113
125
137
153
153
Recurring PBT
600
355
629
1,080
1,232
1,491
% chg
(55.4)
(40.8)
77.0
71.8
14.2
21.0
Extraordinary items
0
0
77
39
0
0
PBT (reported)
600
355
551
1,041
1,232
1,491
Tax
180
173
210
359
413
506
(% of PBT)
29.9
48.6
38.1
34.5
33.5
33.9
Profit before MI
420
182
341
682
819
986
Share of associate
0
0
0
0
0
0
Minority interest (MI)
7
(45)
(3)
(3)
0
0
PAT (reported)
413
228
344
685
819
986
ADJ. PAT
413
228
267
646
819
986
% chg
(65.6)
(44.9)
17.3
142.0
26.8
20.3
(% of total op. income)
6.6
4.0
4.0
8.5
10.2
10.7
Basic EPS (`)
17.8
9.8
14.8
29.4
35.2
42.3
Adj. EPS (`)
17.8
9.8
11.5
27.8
35.2
42.3
% chg
(65.6)
(44.9)
17.3
142.0
26.8
20.3
November 2, 2015
7
Bharat Forge | 2QFY2016 Result Update
Balance sheet statement (Consolidated)
Y/E March (` cr)
FY2012 FY2013 FY2014
FY2015
FY2016E
FY2017E
SOURCES OF FUNDS
Equity share capital
47
47
47
47
47
47
Reserves & surplus
2,137
2,210
2,637
3,398
4,109
5,005
Shareholders’ funds
2,184
2,256
2,683
3,444
4,155
5,051
Minority interest
196
164
17
(2)
(2)
(2)
Total loans
2,419
2,333
2,007
2,365
2,065
1,865
Deferred tax liability
89
135
164
164
164
164
Other long term liabilities
22
38
18
60
60
60
Long term provisions
88
107
116
120
120
120
Total Liabilities
4,997
5,033
5,006
6,150
6,561
7,257
APPLICATION OF FUNDS
Goodwill
3
3
6
54
54
54
Gross block
5,019
5,644
5,389
5,645
6,095
6,545
Less: Acc. depreciation
2,370
2,737
2,860
3,070
3,461
3,881
Net Block
2,649
2,907
2,528
2,575
2,634
2,663
Capital work-in-progress
517
632
583
859
759
659
Investments
445
416
801
496
529
585
Long term loans and adv.
392
253
236
240
240
240
Other noncurrent assets
51
37
26
23
23
23
Current assets
3,277
3,190
3,354
3,988
4,469
5,458
Cash
634
555
423
682
591
822
Loans & advances
733
892
1,027
1,418
1,731
2,158
Other
1,909
1,743
1,905
1,887
2,146
2,478
Current liabilities
2,337
2,406
2,529
2,084
2,146
2,425
Net current assets
939
784
826
1,903
2,323
3,033
Total Assets
4,997
5,033
5,006
6,150
6,561
7,257
November 2, 2015
8
Bharat Forge | 2QFY2016 Result Update
Cash flow statement (Consolidated)
Y/E March (` cr)
FY2012 FY2013 FY2014 FY2015 FY2016E FY2017E
Profit before tax
600
375
706
1,118
1,232
1,510
Depreciation
331
368
123
209
391
420
Change in working capital
218
77
(174)
(818)
(511)
(479)
Others
(31)
94
27
(0)
-
-
Direct taxes paid
(180)
(173)
(210)
(359)
(413)
(506)
Cash Flow from Operations
938
741
472
150
700
945
(Inc.)/Dec. in fixed assets
(834)
(740)
305
(532)
(350)
(350)
(Inc.)/Dec. in investments
(184)
29
(385)
306
(33)
(56)
Other income
(67)
139
17
(4)
-
-
Cash Flow from Investing
(1,085)
(572)
(63)
(230)
(383)
(406)
Issue of equity
-
-
-
-
-
-
Inc./(Dec.) in loans
532
(86)
(325)
357
(300)
(200)
Dividend paid (Incl. Tax)
(108)
(92)
(109)
(108)
(108)
(108)
Others
(40)
(69)
(107)
91
0
-
Cash Flow from Financing
385
(247)
(541)
339
(408)
(308)
Inc./(Dec.) in cash
237
(78)
(133)
259
(91)
231
Opening Cash balances
396
634
555
423
682
591
Closing Cash balances
634
555
423
682
591
822
November 2, 2015
9
Bharat Forge | 2QFY2016 Result Update
Key ratios
Y/E March
FY2012
FY2013
FY2014
FY2015
FY2016E
FY2017E
Valuation Ratio (x)
P/E (on FDEPS)
48.6
81.1
40.3
26.3
24.5
20.4
P/CEPS
28.1
34.4
23.5
17.8
16.6
14.3
P/BV
9.2
8.9
7.5
5.8
4.8
4.0
Dividend yield (%)
0.5
0.4
0.5
0.5
0.5
0.5
EV/Sales
3.3
3.7
3.0
2.7
2.6
2.2
EV/EBITDA
21.5
27.9
20.2
14.8
13.1
10.9
EV / Total Assets
4.3
4.3
4.2
3.5
3.2
2.8
Per Share Data (`)
EPS (Basic)
17.7
10.6
21.4
32.7
35.2
42.3
EPS (fully diluted)
17.8
9.8
11.5
27.8
35.2
42.3
Cash EPS
30.7
25.1
36.7
48.3
52.0
60.4
DPS
4.0
3.4
4.0
4.0
4.0
4.0
Book Value
93.8
96.9
115.2
147.9
178.5
216.9
Dupont Analysis
EBIT margin
11.1
7.6
10.0
14.1
15.1
15.8
Tax retention ratio
0.7
0.5
0.6
0.7
0.7
0.7
Asset turnover (x)
1.5
1.3
1.5
1.5
1.4
1.5
ROIC (Post-tax)
11.9
5.0
9.2
14.1
14.2
15.7
Cost of Debt (Post Tax)
6.1
4.1
4.8
4.1
4.0
4.0
Leverage (x)
0.6
0.6
0.4
0.3
0.3
0.2
Operating ROE
15.5
5.6
11.1
17.4
17.1
17.4
Returns (%)
ROCE (Pre-tax)
15.1
8.6
13.4
19.3
19.1
21.1
Angel ROIC (Pre-tax)
15.9
9.7
14.7
19.9
20.5
22.8
ROE
20.0
10.3
10.8
21.1
21.6
21.4
Turnover ratios (x)
Asset Turnover (Gross Block)
1.3
1.1
1.2
1.4
1.4
1.5
Inventory / Sales (days)
55
71
59
50
52
52
Receivables (days)
46
46
40
41
46
46
Payables (days)
126
147
128
91
89
87
WC cycle (ex-cash) (days)
18
15
22
58
79
87
Solvency ratios (x)
Net debt to equity
0.6
0.6
0.3
0.3
0.2
0.1
Net debt to EBITDA
1.3
1.8
0.8
0.8
0.6
0.2
Interest Coverage (EBIT / Int.)
3.7
2.3
4.0
8.0
9.2
12.2
November 2, 2015
10
Bharat Forge | 2QFY2016 Result Update
Research Team Tel: 022 - 39357800
DISCLAIMER
Angel Broking Private Limited (hereinafter referred to as “Angel”) is a registered Member of National Stock Exchange of India Limited,
Bombay Stock Exchange Limited and Metropolitan Stock Exchange of India Limited. It is also registered as a Depository Participant with
CDSL and Portfolio Manager with SEBI. It also has registration with AMFI as a Mutual Fund Distributor. Angel Broking Private Limited is
a registered entity with SEBI for Research Analyst in terms of SEBI (Research Analyst) Regulations, 2014 vide registration number
INH000000164. Angel or its associates has not been debarred/ suspended by SEBI or any other regulatory authority for accessing
/dealing in securities Market. Angel or its associates including its relatives/analyst do not hold any financial interest/beneficial
ownership of more than 1% in the company covered by Analyst. Angel or its associates/analyst has not received any compensation /
managed or co-managed public offering of securities of the company covered by Analyst during the past twelve months. Angel/analyst
has not served as an officer, director or employee of company covered by Analyst and has not been engaged in market making activity
of the company covered by Analyst.
This document is solely for the personal information of the recipient, and must not be singularly used as the basis of any investment
decision. Nothing in this document should be construed as investment or financial advice. Each recipient of this document should
make such investigations as they deem necessary to arrive at an independent evaluation of an investment in the securities of the
companies referred to in this document (including the merits and risks involved), and should consult their own advisors to determine
the merits and risks of such an investment.
Reports based on technical and derivative analysis center on studying charts of a stock's price movement, outstanding positions and
trading volume, as opposed to focusing on a company's fundamentals and, as such, may not match with a report on a company's
fundamentals.
The information in this document has been printed on the basis of publicly available information, internal data and other reliable
sources believed to be true, but we do not represent that it is accurate or complete and it should not be relied on as such, as this
document is for general guidance only. Angel Broking Pvt. Limited or any of its affiliates/ group companies shall not be in any way
responsible for any loss or damage that may arise to any person from any inadvertent error in the information contained in this report.
Angel Broking Pvt. Limited has not independently verified all the information contained within this document. Accordingly, we cannot
testify, nor make any representation or warranty, express or implied, to the accuracy, contents or data contained within this document.
While Angel Broking Pvt. Limited endeavors to update on a reasonable basis the information discussed in this material, there may be
regulatory, compliance, or other reasons that prevent us from doing so.
This document is being supplied to you solely for your information, and its contents, information or data may not be reproduced,
redistributed or passed on, directly or indirectly.
Neither Angel Broking Pvt. Limited, nor its directors, employees or affiliates shall be liable for any loss or damage that may arise from
or in connection with the use of this information.
Note: Please refer to the important ‘Stock Holding Disclosure' report on the Angel website (Research Section). Also, please refer to the
latest update on respective stocks for the disclosure status in respect of those stocks. Angel Broking Pvt. Limited and its affiliates may
have investment positions in the stocks recommended in this report.
Disclosure of Interest Statement
Bharat Forge
1. Analyst ownership of the stock
No
2. Angel and its Group companies ownership of the stock
No
3. Angel and its Group companies' Directors ownership of the stock
No
4. Broking relationship with company covered
No
Note: We have not considered any Exposure below ` 1 lakh for Angel, its Group companies and Directors
Ratings (Based on expected returns
Buy (> 15%)
Accumulate (5% to 15%)
Neutral (-5 to 5%)
over 12 months investment period):
Reduce (-5% to -15%)
Sell (< -15)
November 2, 2015
11