1QFY2017 Result Update | Capital Goods
August 11, 2016
Bharat Electronics (BEL)
BUY
CMP
`1,232
Performance Highlights
Target Price
`1,414
Quarterly highlights - Standalone
Investment Period
12 Months
Y/E March (` cr)
1QFY17
1QFY16
% chg (yoy)
Stock Info
Net sales
847
1,071
(20.9)
Sector
Capital Goods
EBITDA
(71)
(21)
nmf
Market Cap (` cr)
29,572
PAT
36
77
(52.9)
Net debt (` cr)
(7,524)
Source: Company, Angel Research; Note- nmf- Not Meaningful
Beta
1.1
Bharat Electronics Ltd (BEL) reported bad set of numbers for 1QFY2017. Its
52 Week High / Low
1,417/983
top-line declined by 20.9% yoy to `847cr, which is below our estimate. For the
Avg. Daily Volume
330,665
Face Value (`)
10
quarter, BEL reported below than expected negative EBITDA of `71cr. Negative
operating leverage in our view led to EBITDA de-growth. In-line with EBITDA de-
BSE Sensex
27,775
growth, PAT de-grew 52.9% yoy to `36cr. PAT margins were down 290bps yoy to
Nifty
8,575
4.3%, which is below our expectation.
Reuters Code
BAJE.BO
Bloomberg Code
BHE@IN
For 1QFY2017, BEL reported order inflows of
`1,003cr, which includes
Homeland Security, Navigational Complex System, and Next generation Main
Automatic Exchange order wins. Post these wins, order book as of 1QFY2017-
Shareholding Pattern (%)
end stood at `32,139cr. Order book/ last twelve month (LTM) sales ratio as of
Promoters
75.0
1QFY2017-end stood at 4.5x.
MF / Banks / Indian Fls
14.7
FII / NRIs / OCBs
3.9
Valuation: Despite disappointing quarterly results, we maintain our positive view
Indian Public / Others
6.4
towards the stock. Considering the delays in clearance from customer side, there
exists possibility of better 2Q revenue booking. On the back of continuous order
wins and strong order book, there exists some scope for the company delivering
Abs. (%)
3m 1yr 3yr
favorable performance going forward.
Sensex
8.5
(1.2)
46.6
On the back of strong market positioning, large order book, debt free status, we
BEL
6.5
(5.6)
211.6
expect BEL to report increased traction in sales and earnings growth, going
forward. We recommend BUY on the stock with price target of `1,414.
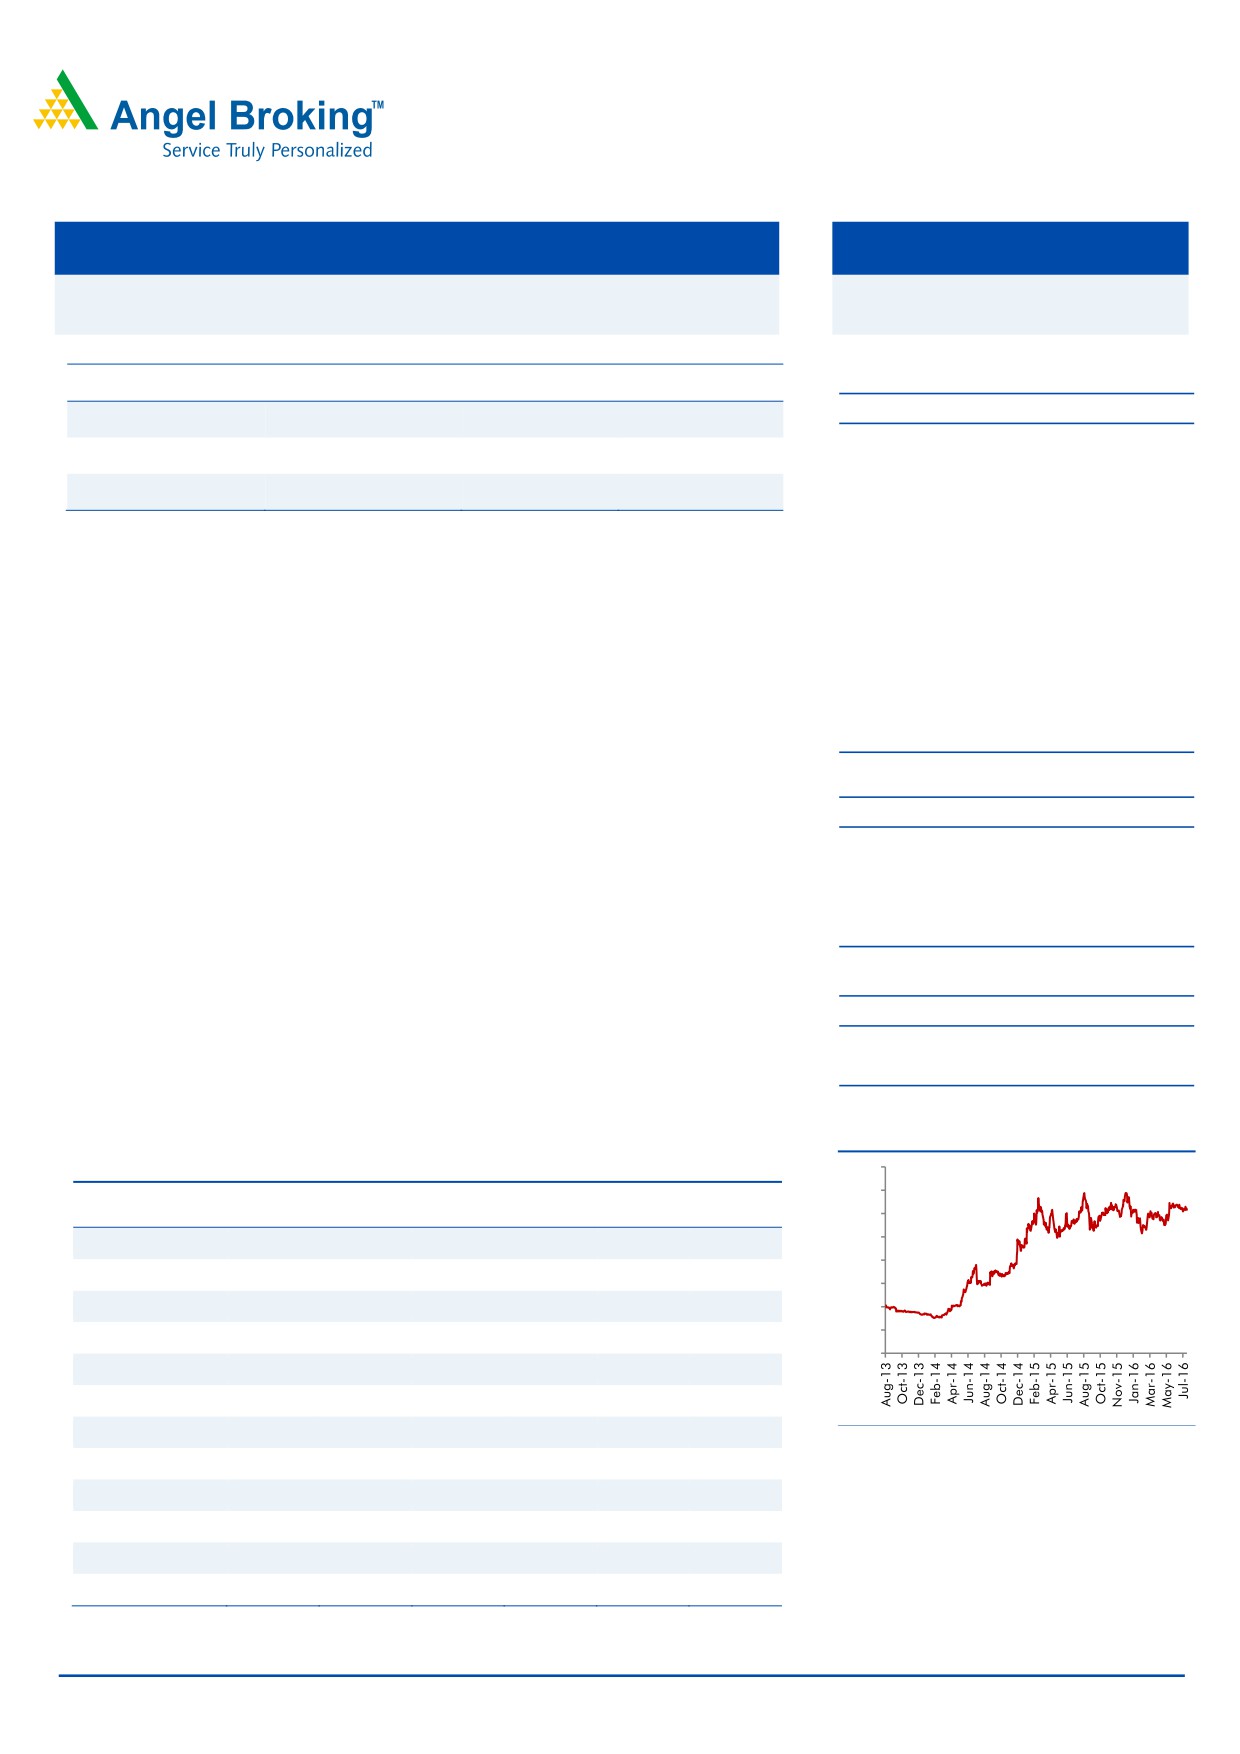
3-Year Daily Price Chart
Key Financials (Consolidated)
1600
1400
Y/E March (` cr)
FY13
FY14
FY15
FY16
FY17E
FY18E
1200
1000
Net Sales
6,273
6,518
7,093
7,549
8,137
9,169
800
% chg
6.1
3.9
8.8
6.4
7.8
12.7
600
Net Profit
906
951
1,197
1,394
1,410
1,499
400
200
% chg
7.0
5.0
25.8
16.5
1.1
6.3
0
EBITDA (%)
10.6
14.1
16.6
20.4
16.8
17.2
EPS (`)
38
40
50
58
59
62
P/E (x)
32.5
31.1
24.7
21.3
21.0
19.7
Source: Company, Angel Research
P/BV (x)
4.6
4.1
3.6
3.3
3.0
2.8
Adj. RoE (%)
30.3
20.1
36.8
66.4
44.6
46.3
RoCE (%)
26.6
23.9
30.7
34.1
28.2
27.7
Yellapu Santosh
EV/Sales (x)
3.9
3.9
3.4
3.0
2.7
2.4
022 - 3935 7800 Ext: 6811
EV/EBITDA (x)
36.6
27.1
20.1
14.3
15.7
13.8
Source: Company, Angel Research; CMP as of August 10, 2016; Reported as per Ind AS, FY2016 numbers
& other remaining quarters continue to be reported as per Indian GAAP; It needs to be noted that yoy
growth for FY2017E is not comparable as FY2016 continues to be reported under Indian GAAP
Please refer to important disclosures at the end of this report
1
BEL | 1QFY2017 Result Update
Exhibit 1: Quarterly Performance (Standalone)
Particulars (` cr)
1QFY17*
1QFY16*
% chg (yoy)
Net Sales
847
1,071
(20.9)
Total Expenditure
918
1,092
(15.9)
Cost of materials consumed
673
683
(1.5)
Purchases of stock-in-trade
(203)
10
nmf
Employee benefits Expense
316
295
7.4
Other Expenses
132
104
27.1
EBITDA
(71)
(21)
nmf
EBIDTA %
(8.4)
(2.0)
Depreciation
43
41
6.7
EBIT
(115)
(62)
85.8
Interest and Financial Charges
0
0
nmf
Other Income
163
163
0.5
PBT before Exceptional Items
49
101
(51.8)
Exceptional Items
0
0
PBT after Exceptional Items
49
101
(51.8)
Tax
13
24
(48.0)
% of PBT
25.7
23.9
7.7
PAT from ordinary items
36
77
(52.9)
Other Comprehensive Items
13
13
Total Comprehensive Income
23
63
(63.5)
PAT %
4.3
7.2
Dil. EPS (after extra-ord. Items)
1.50
3.20
(53.1)
Source: Company, Angel Research; Note: nmf- Not meaningful;*Reported as per Ind AS, FY2016 numbers &
other remaining quarters continue to be reported as per Indian GAAP; It needs to be noted that yoy growth
for FY2017E is not comparable as FY2016 continues to be reported under Indian GAAP
Revenue reports 20.9% yoy sales de-growth
BEL reported 20.9% yoy sales de-growth in 1QFY2017 to `847cr, which is below
our expectation. Management attributed delays in customer clearances, to be the
key reason for miss on expected revenues front. Majority of the revenues for the
quarter has been from 3D Tactical Control Radar, Akash Weapons System for the
Indian Army.
Exhibit 2: Projects contributing to 1QFY2017 revenues
3D Tactical Control Radar
Akash Weapon System (Army)
New Generation Hull Mounted Sonar
L70 Gun Upgrade
Fire Control Systems
Source: Company, Angel Research
Management expects better revenue booking from 2QFY17 onwards, and has
maintained its 10% yoy top-line growth target for FY2017E.
Exports for 1QFY2017 grew ~47% yoy to $17mn (`116cr) in 1QFY2017.
August 11, 2016
2
BEL | 1QFY2017 Result Update
Reports negative operating margins
For the quarter, BEL reported below than expected, negative EBITDA of `71cr.
Negative operating leverage led to yoy EBITDA de-growth. EBITDA was impacted
on account of 27.1% yoy increase in other expenses to `132cr.
Operating performance restricts PAT growth
In-line with EBITDA de-growth, PAT de-grew 52.9% yoy to `36cr. PAT margins on
yoy basis were down 290bps to 4.3%, which is below our expectation. PAT margin
was also impacted on account of (1) just 0.5% yoy increase in other income to
`163cr, (2) 6.7% increase in depreciation expenses to `43cr, (3) higher effective
tax rate of 25.7%.
1QFY2017 Order Inflows at `1,003cr
BEL in 1QFY2017 reported `1,003cr of order inflows, which include Homeland
Security, Navigational Complex System, and Next generation Main Automatic
Exchange order wins.
We maintain our view that BEL would report order inflows of `18,000cr/`20,000cr
for FY2017/18E, respectively, considering the strong emerging bid pipeline.
Amongst the projects in the pipeline, we expect the company to report order wins
from Akash Missile Systems (7 sqdn), Tactical Communication System, Early
Warning Suite for Fighter Aircraft, Mobile Cellular Communication System, Ship
Data Network, Commander TI sights and Advanced Composite Communication
Systems.
The order book as of 1QFY2017-end stood at `32,139cr which gives revenue
visibility for the next two years. The order book/LTM sales ratio at 1QFY2017-end
stood at 4.5x.
Valuation
Despite weak quarterly numbers, we expect BEL to report strong financial
performance in the coming quarters (revenue booking post project clearance to be
seen in 2QFY2017). We expect BEL to report strong order inflows and revenues,
on the back of strong market positioning, large Order Book (which gives visibility
for next few quarters).
On the back of increase in order inflows, we are optimistic that the company
should see increased traction in sales and earnings growth, going forward. Since
our initiation report, the stock has attained our then recommended target price of
`1,414 but has thereafter corrected. Post the correction seen in the stock price, the
valuations has turned attractive. We maintain BUY on the stock with price target of
`1,414.
August 11, 2016
3
BEL | 1QFY2017 Result Update
Company background
BEL is a Bangalore based public sector undertaking (PSU) established in 1954
under the control of Ministry of Defence (MoD) to cater to specialised electronic
needs of the Indian Defense. BEL, a Nava-Ratna company, has over the years
grown to be a multi-segment, multi-technology company servicing a diverse range
of clients across India and in the international markets.
Business segments
BEL operates across 8 business segments, with ~20-30% of its current order book
contributed by its largest business segment- Radars, Sonars & Weapons Systems.
Exhibit 3: Business Segments
Radars, Sonars & Weapon Systems
Communication
Electronic Warfare
Network Centric Systems
Anti Submarine Warfare
Electro-Optics
Tank Electronics
Civilian Products (such as EVM machines
Source: Company, Angel Research
Details of Manufacturing Plants
To-date BEL has set-up 9 manufacturing plants across Bangalore (headquarters),
Chennai, Machilipatnam (post take-over of Andhra Scientific Company in 1983),
Hyderabad, Pune, Navi Mumbai, Panchkula, Kotdwara, and Ghaziabad, which
are into manufacture of entire range of defense products offered by the company.
Exhibit 4: Details of Manufacturing facilities
Production Facilities
Production details
(since)
Military Communication Equipment, Network Centric Systems,
Military Radars, Naval Systems, Electronic Warfare (Air-force),
Avionics, Weapon Management System, Telecom and
Bangalore (1966)
Broadcast System, Components, Coastal Surveillance System,
Electronic Voting Machines, Solar Products, Traffic Signals,
Security Systems, Microwave Super Components
Tank Electronics, Gun Upgrades, Multi-purpose Advanced
Chennai
Stabilized systems
Machilipatnam (1983) Electro-Optics (Night Vision Devices)
Hyderabad
Electronic Warfare Systems
Pune (1981)
X-ray Tubes, Batteries, Laser Products
Navi Mumbai
Shelters, Masks
Panchkula
Military Communication Equipment, Encryption Products
Kotdwara
Telecommunication Systems, Military Communication Systems
Network Centric Systems, Radars, Satcom (Defense),
Ghaziabad
Microwave components
Source: Company AR’s, Angel Research
August 11, 2016
4
BEL | 1QFY2017 Result Update
Investment Arguments
BEL is a PSU and a leader in the domestic defense electronics space, with a major
proportion of its revenue coming in from the Indian Navy and Army.
Defense spending at an inflexion point: After years of lull, the government
announced a 6.9% yoy increase in Defense Capital Budget to `69,705cr. In our
view, the company is at an inflexion point where Indian Defense capex cycle, led
by government spending is entering new era of growth. Our view strengthens on
account of the following developments, (1) Defense sector getting high priority in
government’s ‘Make in India’ campaign, with increased emphasis on the
indigenization aspect, (2) increase in FDI limits in defense from 26% to 49%, and
(3)
$50bn worth of projects cleared by Defense Acquisition Council (DAC) since the
new government has come to power, indicating faster clearances in place. Also the
recently released Defense Procurement Procedures (DPP) is good for the industry.
The current bid pipeline, which could lead to strong award activity for the next few
years, along with above-mentioned factors indicate that good times are ahead for
the Defense sector.
BEL to emerge as key beneficiary: At the backdrop of higher allocation made
towards defense capex with ~$50bn worth of projects cleared by DAC, we expect
good times ahead for defense players, including for BEL. BEL in FY2016 had a
market share of
~35% in domestic defense electronics.
(1) A bid-pipeline
dominated by Indian Airforce and Navy’s platform projects, which have high
Defense Electronics components requirement, (2) BEL’s in-house R&D capabilities,
(3) tie-up with Thales, France for product development, and (4) zero net debt status
with potential for further improvement in working capital cycle, all point out that
BEL would be able to maintain its strong market positioning in the Defense
Electronics space. On the whole, we expect BEL to emerge as a key beneficiary of
the revival in the defense capex cycle.
Risks & Concerns
To increase indigenization in the defense sector, the Government of India
(GoI) increased the FDI limit in the Defense sector to 49% in Jul-2014. Till
now, recent developments/ announcements have failed to attract any major
international defense players into India. With more positive announcements
expected and a fast growing bid pipeline, international defense giants could
be compelled to forge partnership with domestic players at the time of
bidding. This could possibly lead to loss of market share for BEL, which we
have not incorporated in to our estimates.
Last few years have seen sluggish ordering activity from the Defense sector.
Even though the Defense sector in the last few months has seen positive
announcements, any further delays in the awarding activity, could act as a risk
to our estimates.
Defense is a highly technology focused sector. BEL would have to continuously
spend on R&D to regularly upgrade its product profile. Any shift away from the
R&D could make their products unattractive (vs the peers), resulting in loss of
market share and further delays in execution.
August 11, 2016
5
BEL | 1QFY2017 Result Update
Any government announcement to de-list the products manufactured by BEL
could open up the competition and further impact their market positioning
within the domestic markets, which again acts as a risk to our market share
assumptions and threatens our earnings growth estimates.
Profit & Loss Statement (Consolidated)
Y/E March (` cr)
FY13
FY14
FY15
FY16
FY17E
FY18E
Net Sales
6,273
6,518
7,093
7,549
8,137
9,169
% Chg
6.1
3.9
8.8
6.4
7.8
12.7
Total Expenditure
5,610
5,596
5,918
6,008
6,773
7,589
Raw Materials Consumed
3,156
3,344
3,495
3,578
4,146
4,658
Purchase of stock-in-trade
760
444
440
339
423
452
Employee benefits Expense
1,125
1,046
1,281
1,323
1,406
1,564
Other Expenses
569
762
702
768
798
915
EBITDA
663
922
1,175
1,541
1,364
1,579
% Chg
4.3
39.1
27.4
31.2
(11.5)
15.8
EBIDTA %
10.6
14.1
16.6
20.4
16.8
17.2
Depreciation
136
150
166
200
218
243
EBIT
526
772
1,008
1,341
1,145
1,337
% Chg
3.2
46.6
30.6
33.0
(14.6)
16.7
Interest and Fin. Charges
1
4
3
6
7
7
Other Income
625
437
507
533
653
668
EBT before Excep & prior-
1,151
1,205
1,513
1,869
1,791
1,997
period items
Excep. & Prior period Items
(9)
1
1
0
0
0
EBT
1,142
1,206
1,513
1,869
1,791
1,997
Tax Expenses
236
254
316
475
381
498
% of PBT
20.7
21.1
20.9
25.4
21.3
24.9
PAT before Minority Interest
906
952
1,197
1,394
1,410
1,499
Minority Interest
0
0
(0)
(1)
0
1
PAT
906
951
1,197
1,394
1,410
1,499
% Chg
7.0
5.0
25.8
16.5
1.1
6.3
PAT %
14.4
14.6
16.9
18.5
17.3
16.3
Diluted EPS
38
40
50
57.8
58.7
62.5
% Chg
7.6
4.4
25.8
15.9
1.6
6.3
Reported as per Ind AS, FY2016 numbers & other remaining quarters continue to be reported as per
Indian GAAP; It needs to be noted that yoy growth for FY2017E is not comparable as FY2016
continues to be reported under Indian GAAP
August 11, 2016
6
BEL | 1QFY2017 Result Update
Balance Sheet (Consolidated)
Y/E March (` cr)
FY13
FY14
FY15
FY16E FY17E FY18E
Sources of Funds
Equity Capital
80
80
80
240
240
240
Reserves & Surplus
6,407
7,140
8,037
8,746
9,579
10,444
Networth
6,487
7,220
8,117
8,986
9,819
10,684
Total Debt
0
0
25
29
30
35
Minority Interest & Govt. Grants
163
224
207
182
181
181
Other Long-term Liab. & Prov.
386
365
435
517
536
553
Total Liabilities
7,037
7,809
8,784
9,713
10,567
11,454
Application of Funds
Gross Block
2,106
2,366
2,894
3,254
3,659
4,082
Accumulated Depreciation
1,506
1,671
1,821
2,021
2,239
2,482
Net Block
600
695
1,073
1,233
1,420
1,600
Cap. WIP & Intan. Assets under
328
458
140
432
305
300
Develop.
Investments
0
0
0
242
242
242
Current Assets
Inventories
3,255
3,340
3,424
4,213
4,077
4,356
Sundry Debtors
3,364
4,156
3,805
3,741
3,966
4,431
Cash and Bank Balance
5,331
4,605
6,038
7,553
8,125
7,867
Loans & Advances
1,378
1,190
684
487
500
680
Other Current Asset
81
69
54
59
57
59
Current Liabilities
7,814
7,166
6,941
8,811
8,704
8,693
Net Current Assets
5,594
6,192
7,064
7,242
8,021
8,700
Other Assets
515
464
506
565
580
612
Total Assets
7,037
7,809
8,784
9,713
10,567
11,454
August 11, 2016
7
BEL | 1QFY2017 Result Update
Cash Flow Statement (Consolidated)
Y/E March (` cr)
FY13
FY14 FY15 FY16E FY17E FY18E
Profit before tax
1,147
1,206
1,513
1,869
1,791
1,997
Dep. & Other Non-cash Charges
(338)
(336)
(163)
(417)
(238)
(238)
Change in Working Capital
(2,104)
(1,237)
436
1,338
(207)
(938)
Interest & Financial Charges
1
4
3
6
7
7
Direct taxes paid
(245)
(206)
(356)
(475)
(381)
(498)
Cash Flow from Operations
(1,540)
(569)
1,434
2,320
972
331
(Inc)/ Dec in Fixed Assets
(353)
(369)
(225)
(650)
(278)
(418)
(Inc)/ Dec in Invest. & Oth. Adj.
2,106
1,128
(614)
(141)
438
142
Cash Flow from Investing
1,753
759
(839)
(791)
160
(277)
Issue/ (Buy Back) of Equity
0
0
0
160
0
0
Inc./ (Dec.) in Borrowings
0
(0)
25
4
2
5
Dividend Paid (Incl. Tax)
(157)
(209)
(220)
(504)
(555)
(610)
Interest Expenses & Oth. Adj.
(1)
(4)
(14)
(6)
(7)
(7)
Cash Flow from Financing
(157)
(213)
(209)
(347)
(560)
(613)
Inc./(Dec.) in Cash
56
(23)
386
1,182
572
(558)
Opening Cash balances
1,752
1,809
1,786
2,171
3,353
3,925
Closing Cash balances
1,809
1,786
2,171
3,353
3,925
3,367
August 11, 2016
8
BEL | 1QFY2017 Result Update
Key Ratios (x)
Y/E March
FY13
FY14
FY15
FY16E FY17E FY18E
Valuation Ratio (x)
Adj. P/E (on FDEPS)
32.5
31.1
24.7
21.3
21.0
19.7
Adj. P/E (on FDEPS)
28.2
26.9
21.7
18.6
18.2
17.0
Dividend yield (%)
1.7
1.6
1.3
0.7
0.6
0.6
EV/Sales
3.9
3.9
3.4
3.0
2.7
2.4
EV/EBITDA
36.6
27.1
20.1
14.3
15.7
13.8
EV / Total Assets
3.4
3.2
2.7
2.3
2.0
1.9
Per Share Data (`)
Adj. EPS (fully diluted)
38
40
50
58
59
62
Cash EPS
44
46
57
66
68
73
DPS
7.4
7.8
9.7
18.0
19.8
21.7
Book Value
270
301
338
374
409
445
Returns (%)
RoCE (Pre-tax)
26.6
23.9
30.7
34.1
28.2
27.7
Angel RoIC (Pre-tax)
35.8
35.0
36.4
62.4
60.4
50.1
Adj. RoE
30.3
20.1
36.8
66.4
44.6
46.3
Turnover ratios (x)
Asset Turnover (Gross Block) (x)
2.9
2.8
2.6
2.4
2.3
2.3
Inventory / Sales (days)
178
190
179
189
191
172
Receivables (days)
180
217
211
187
177
171
Payables (days)
541
489
435
479
472
418
WC (days)
(183)
(82)
(45)
(103)
(104)
(76)
Leverage Ratios (x)
D/E ratio (x)
0.0
0.0
0.0
0.0
0.0
0.0
August 11, 2016
9
BEL | 1QFY2017 Result Update
Research Team Tel: 022 - 39357800
DISCLAIMER
Angel Broking Private Limited (hereinafter referred to as “Angel”) is a registered Member of National Stock Exchange of India Limited,
Bombay Stock Exchange Limited and Metropolitan Stock Exchange Limited. It is also registered as a Depository Participant with CDSL
and Portfolio Manager with SEBI. It also has registration with AMFI as a Mutual Fund Distributor. Angel Broking Private Limited is a
registered entity with SEBI for Research Analyst in terms of SEBI (Research Analyst) Regulations, 2014 vide registration number
INH000000164. Angel or its associates has not been debarred/ suspended by SEBI or any other regulatory authority for accessing
/dealing in securities Market. Angel or its associates/analyst has not received any compensation / managed or co-managed public
offering of securities of the company covered by Analyst during the past twelve months.
This document is solely for the personal information of the recipient, and must not be singularly used as the basis of any investment
decision. Nothing in this document should be construed as investment or financial advice. Each recipient of this document should
make such investigations as they deem necessary to arrive at an independent evaluation of an investment in the securities of the
companies referred to in this document (including the merits and risks involved), and should consult their own advisors to determine
the merits and risks of such an investment.
Reports based on technical and derivative analysis center on studying charts of a stock's price movement, outstanding positions and
trading volume, as opposed to focusing on a company's fundamentals and, as such, may not match with a report on a company's
fundamentals. Investors are advised to refer the Fundamental and Technical Research Reports available on our website to evaluate the
contrary view, if any.
The information in this document has been printed on the basis of publicly available information, internal data and other reliable
sources believed to be true, but we do not represent that it is accurate or complete and it should not be relied on as such, as this
document is for general guidance only. Angel Broking Pvt. Limited or any of its affiliates/ group companies shall not be in any way
responsible for any loss or damage that may arise to any person from any inadvertent error in the information contained in this report.
Angel Broking Pvt. Limited has not independently verified all the information contained within this document. Accordingly, we cannot
testify, nor make any representation or warranty, express or implied, to the accuracy, contents or data contained within this document.
While Angel Broking Pvt. Limited endeavors to update on a reasonable basis the information discussed in this material, there may be
regulatory, compliance, or other reasons that prevent us from doing so.
This document is being supplied to you solely for your information, and its contents, information or data may not be reproduced,
redistributed or passed on, directly or indirectly.
Neither Angel Broking Pvt. Limited, nor its directors, employees or affiliates shall be liable for any loss or damage that may arise from
or in connection with the use of this information.
Disclosure of Interest Statement
Bharat Electronics
1. Financial interest of research analyst or Angel or his Associate or his relative
No
2. Ownership of 1% or more of the stock by research analyst or Angel or associates or relatives
No
3. Served as an officer, director or employee of the company covered under Research
No
4. Broking relationship with company covered under Research
No
Ratings (Based on expected returns
Buy (> 15%)
Accumulate (5% to 15%)
Neutral (-5 to 5%)
over 12 months investment period):
Reduce (-5% to -15%)
Sell (< -15)
August 11, 2016
10