2QFY2016 Result Update | Banking
November 10, 2015
Bank of Baroda
NEUTRAL
CMP
`171
Performance Highlights
Target Price
-
Particulars (`cr)
2QFY16 1QFY16
% chg (qoq) 2QFY15
% chg (yoy)
Investment Period
-
NII
3,244
3,460
(6.2)
3,401
(4.6)
Stock Info
Pre-prov. profit
2,337
2,202
6.1
2,403
(2.7)
Sector
Banking
PAT
124
1,052
(88.2)
1,104
(88.7)
Market Cap (` cr)
39,399
Source: Company, Angel Research
Beta
1.4
For 2QFY2016, Bank of Baroda reported a PAT decline of 88.7% yoy to `124cr,
52 Week High / Low
229/138
Avg. Daily Volume
1,01,02,938
largely due to higher-than-expected provisions.
Face Value (`)
2
Slippages spike, NIM dips qoq
BSE Sensex
26,121
Nifty
7,915
During the quarter, the loan book and deposits grew by 7.6% and 8.0% yoy,
Reuters Code
BOB.BO
respectively. Advances growth was slower than the last 4 years’ average growth.
Bloomberg Code
BOB@IN
Total CASA deposits growth was muted at 4.11% yoy with overseas CASA deposits
showing a decline of 30.8% yoy while domestic CASA deposits grew by 11.9%
yoy; as a result, the domestic CASA ratio improved marginally to 32.0% as against
Shareholding Pattern (%)
31.9% in 2QFY2015. The Global NIM dipped by 18bp qoq with a decline in
Promoters
59.2
domestic as well as international NIM by 20bp and 7bp qoq, respectively. The
MF / Banks / Indian Fls
21.2
NIM dip was led by a 57bp yoy fall in yield on earning assets and more than the
FII / NRIs / OCBs
12.0
26bp yoy fall in cost of funds as well as elevated slippages.
Indian Public / Others
7.6
On the asset quality front, the Gross NPA ratio rose substantially to 5.56% in
2QFY2016 from 4.13% in 1QFY2016 marking a rise of 143bp sequentially,
whereas the Net NPA ratio was at 3.08% in the quarter as compared to 2.07% in
Abs. (%)
3m 1yr
3yr
1QFY2016. There was a sharp spurt in fresh slippages for the quarter which came
Sensex
(7.0)
(5.9)
39.6
at
`6,816cr as compared to
`1,685cr in 1QFY2016 with slippages from
Bank of Baroda
(9.6)
(12.1)
11.1
restructured book at `1,391cr, resulting in a sudden spike in annualized slippage
ratio to 6.5% as against 1.8% in 1QFY2016. The bank restructured loans worth
`115cr in 1QFY2016, while it has not refinanced any accounts under the 5/25
3-year price chart
250
schemer nor has it sold any assets to ARCs during the quarter.
200
Outlook and valuation: Bank of Baroda is currently trading at a higher valuation
multiple as compared to peers on account of market optimism about the bank’s
150
performance, given the new Management at the helm of affairs. However, the key
100
lies in the execution of the new strategy, going forward. At the current market price,
50
the stock trades at a valuation of 0.9x its FY2017E ABV. In our view, the bank is
factoring all the positives. Hence, we maintain our Neutral view on the stock.
0
Key financials (Standalone)
Y/E March (` cr)
FY2014
FY2015
FY2016E
FY2017E
Source: Company, Angel Research
NII
11,965
13,187
13,687
15,730
% chg
5.7
10.2
3.8
14.9
Net profit
4,541
3,398
2,984
4,688
% chg
1.3
(25.2)
(12.2)
57.1
Vaibhav Agrawal
NIM (%)
2.0
2.0
1.9
2.0
022 - 3935 7800 Ext: 6808
EPS (`)
21.1
15.3
13.5
21.1
P/E (x)
7.1
9.8
11.2
7.1
P/ABV (x)
0.9
0.9
0.9
0.8
Chintan Shah
RoA (%)
0.8
0.5
0.4
0.6
022 - 4000 3600 Ext: 6828
RoE (%)
13.4
9.0
7.3
10.6
Source: Company, Angel Research; Note: CMP as of November 9, 2015
Please refer to important disclosures at the end of this report
1
Bank of Baroda | 2QFY2016 Result Update
Exhibit 1: 2QFY2016 performance (Standalone)
Particulars (` cr)
2QFY16
1QFY16
% chg (qoq)
2QFY15
% chg (yoy)
FY2015
FY2014
% chg
Interest earned
11,156
11,276
(1.1)
10,826
3.1
42,964
38,940
10.3
- on Advances / Bills
7,712
8,033
(4.0)
7,807
(1.2)
30,803
27,878
10.5
- on investments
2,739
2,651
3.3
2,348
16.7
9,701
8,696
11.6
- on balance with RBI & others
291
296
(1.6)
443
(34.3)
1,550
1,534
1.0
- on others
414
297
39.3
227
82.6
910
832
9.4
Interest Expended
7,912
7,817
1.2
7,425
6.6
29,776
26,974
10.4
Net Interest Income
3,244
3,460
(6.2)
3,401
(4.6)
13,187
11,965
10.2
Other income
1,144
967
18.3
992
15.4
4,402
4,463
(1.4)
Other income excl. treasury
920
810
13.5
813
13.2
3,395
3,719
(8.7)
- CEB
361
346
4.3
333
8.6
1,482
1,437
3.1
- Treasury Income
224
157
42.7
179
25.3
1,007
744
35.4
- Recoveries from written off a/cs
79
13
507.1
31
157.2
189
563
(66.5)
- Others
479
451
6.4
449
6.7
1,724
1,718
0.4
Operating income
4,389
4,427
(0.9)
4,393
(0.1)
17,589
16,428
7.1
Operating expenses
2,051
2,225
(7.8)
1,990
3.1
7,674
7,075
8.5
- Employee expenses
1,044
1,345
(22.4)
1,108
(5.8)
4,261
4,140
2.9
- Other Opex
1,008
880
14.5
882
14.2
3,413
2,935
16.3
Pre-provision Profit
2,337
2,202
6.1
2,403
(2.7)
9,915
9,353
6.0
Provisions & Contingencies
1,892
600
215.4
888
113.0
4,495
3,856
16.6
- Provisions for NPAs
1,844
568
224.7
584
215.6
3,997
2,968
34.7
- Provisions for Standard adv.
(79)
12
(757.4)
13
(727.3)
548
535
2.4
- Provisions for Investments
112
19
492.3
182
(38.4)
(149)
199
(175.2)
- Other Provisions
15
1
1,545.2
109
(86.0)
(51)
353
(114.4)
PBT
445
1,602
(72.2)
1,515
(70.6)
5,421
5,497
(1.4)
Provision for Tax
321
550
(41.7)
411
(21.9)
2,022
956
111.5
PAT
124
1,052
(88.2)
1,104
(88.7)
3,398
4,541
(25.2)
Effective Tax Rate (%)
72.0
34.3
3771bp
27.1
4494bp
37.3
17.4
1991bp
Source: Company, Angel Research
November 10, 2015
2
Bank of Baroda | 2QFY2016 Result Update
Exhibit 2: 2QFY2016 performance analysis (Standalone)
Particulars
2QFY16 1QFY16 % chg (qoq) 2QFY15
% chg (yoy)
Balance sheet
Advances (` cr)
4,14,900
4,08,388
1.6
3,85,766
7.6
Deposits (` cr)
6,12,458
5,93,087
3.3
5,66,926
8.0
Credit-to-Deposit Ratio (%)
67.7
68.9
(111)bp
68.0
(30)bp
Current deposits (` cr)
42,532
45,663
(6.9)
47,487
(10.4)
Saving deposits (` cr)
1,11,582
1,07,881
3.4
1,00,542
11.0
CASA deposits (` cr)
1,54,114
1,53,544
0.4
1,48,029
4.1
Global CASA ratio (%)
25.2
25.9
(73)bp
26.1
(95)bp
Domestic CASA ratio (%)
32.0
31.9
6bp
31.9
6bp
CAR (%)*
12.5
12.0
53bp
12.2
32bp
Tier 1 CAR (%)*
9.4
9.7
(32)bp
9.3
15bp
Profitability Ratios (%)
Dom. Cost of deposits
6.9
6.9
(2)bp
7.2
(32)bp
Dom. Yield on advances
10.4
10.6
(20)bp
11.2
(73)bp
Dom. Yield on investments
7.8
8.0
(28)bp
8.2
(43)bp
Dom. Reported NIM
2.7
2.9
(20)bp
3.0
(33)bp
Cost-to-income ratio
46.7
50.3
(351)bp
45.3
145bp
Asset quality
Gross NPAs (` cr)
23,710
17,274
37.3
13,058
81.6
Gross NPAs (%)
5.6
4.1
143bp
3.3
224bp
Net NPAs (` cr)
12,798
8,470
51.1
6,705
90.9
Net NPAs (%)
3.1
2.1
101bp
1.7
134bp
PCR incl. tech. w/offs (%)
58.2
64.9
(671)bp
65.4
(716)bp
Annualized slippage ratio (%)
6.4
1.9
445bp
1.8
460bp
NPA prov. to avg. assets (%)
1.1
0.3
74bp
0.4
70bp
Source: Company, Angel Research * Basel III not comparable
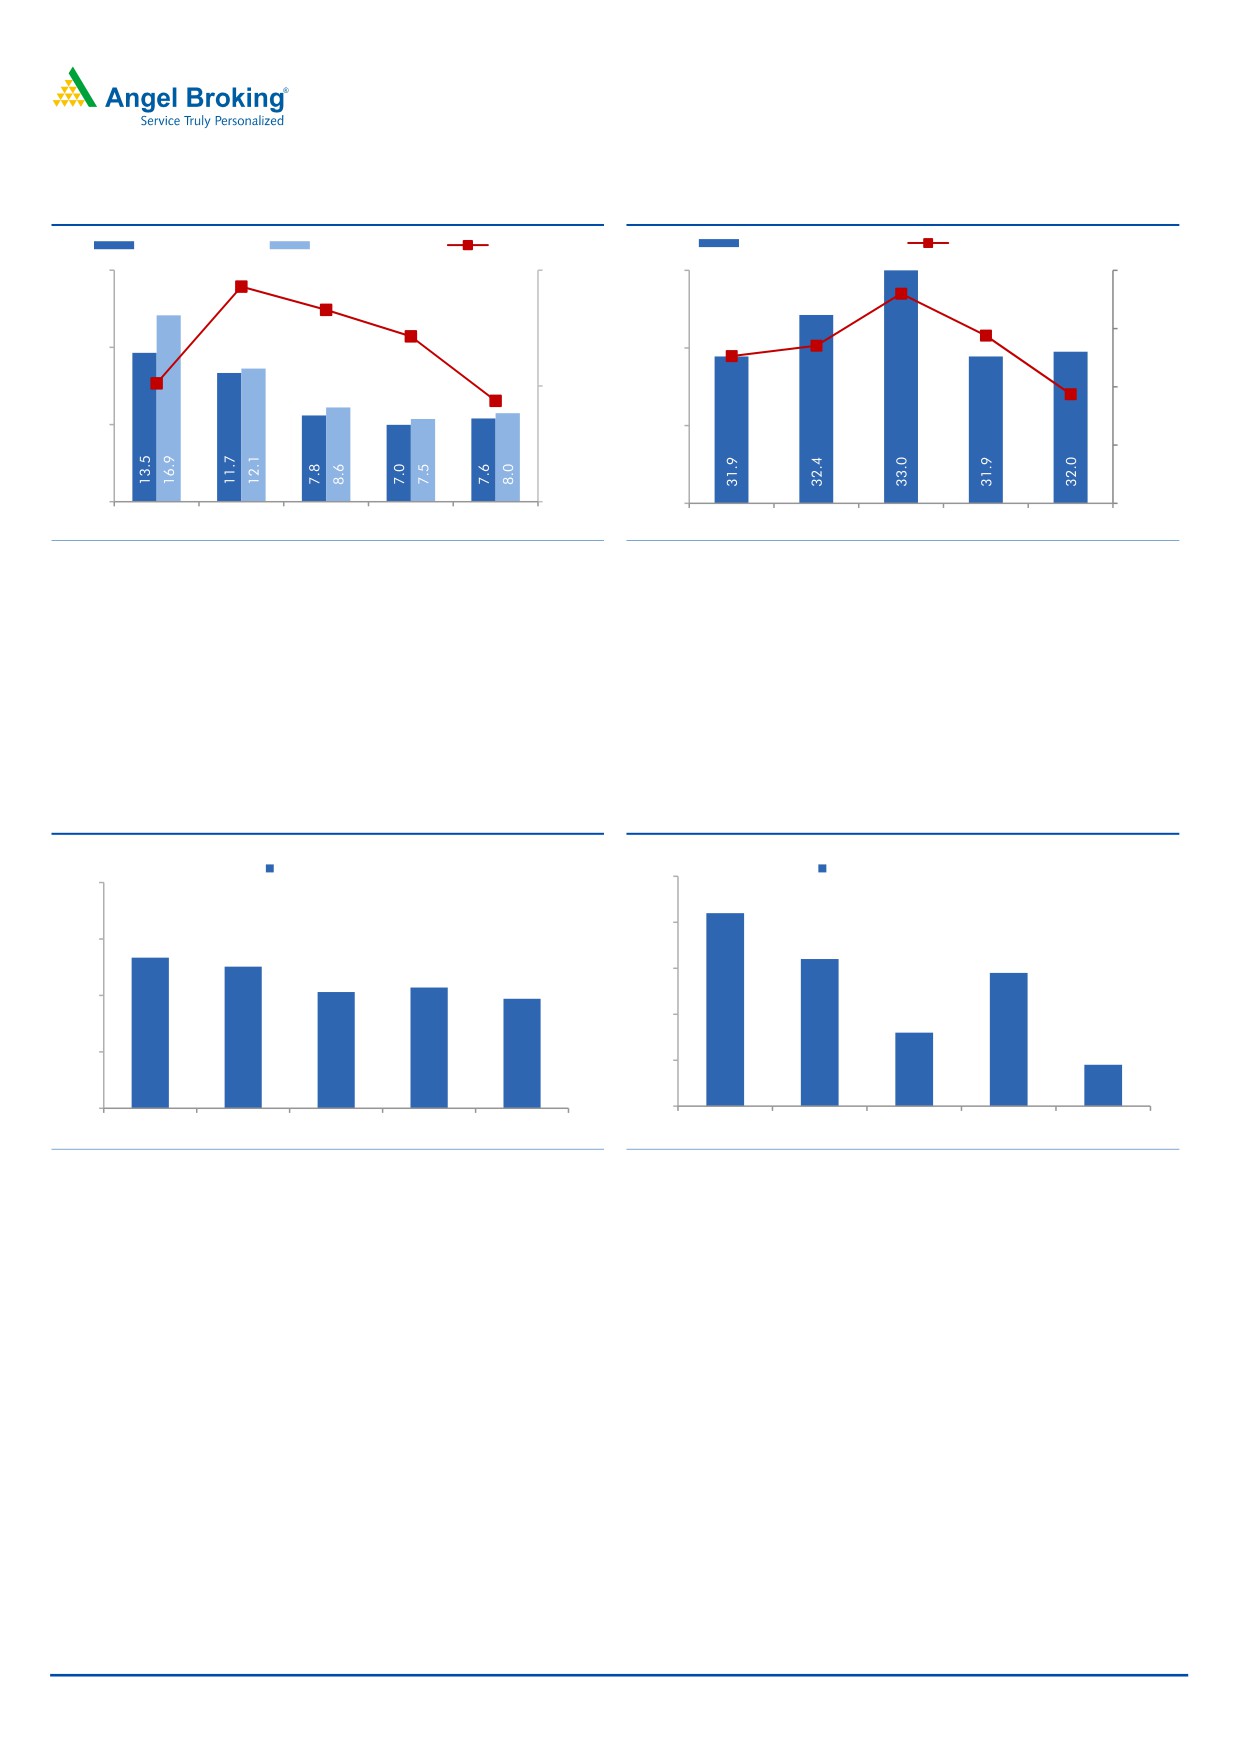
Advances growth slows
During the quarter, the loan book and deposits grew by 7.6% and 8.0% yoy,
respectively. Advances growth was slower than the last 4 years’ average growth.
Home loans and Farm Credit segments continued their growth trajectory recording
a strong yoy growth of 12.9% and 17.0% yoy, respectively. The overseas business
contributed 31.8% to the bank’s total business, with 50.9% of total overseas loan
book coming from Buyers Credit/BP/BD portfolio where the exposure is on the
banks.
Total CASA deposits growth was muted at 4.11% yoy with overseas CASA deposits
showing a decline of 30.8% yoy while domestic CASA deposits grew by 11.9% yoy;
as a result, the domestic CASA ratio improved marginally to 32.0% as against
31.9% in 2QFY2015.
November 10, 2015
3
Bank of Baroda | 2QFY2016 Result Update
Exhibit 3: Modest loan book growth
Exhibit 4: Domestic CASA ratio rises marginally yoy
Adv. yoy chg (%)
Dep. yoy chg (%)
CDR (%, RHS)
Domestic CASA ratio
CASA yoy growth (%, RHS)
13.6
21.0
69.7
70.0
33.0
14.0
69.3
12.9
12.7
68.9
13.0
12.5
14.0
32.0
68.0
11.9
67.7
68.0
12.0
7.0
31.0
11.0
-
66.0
30.0
10.0
2QFY15
3QFY15
4QFY15
1QFY16
2QFY16
2QFY15
3QFY15
4QFY15
1QFY16
2QFY16
Source: Company, Angel Research
Source: Company, Angel Research
NIM falls qoq
Global NIM dipped by 18bp qoq with decline in domestic as well as international
NIM by 20bp and 7bp qoq respectively. NIM dip was led by a 57bp yoy fall in
yield on earning assets and more than the 26bp yoy fall in cost of funds as well as
elevated slippages. In addition to that, Global and domestic NIM of the bank will
remain under pressure due to reduction in base rate.
Exhibit 5: Yield on advances declines qoq
Exhibit 6: NIM dips qoq
(%)
(%)
Yield on advances
Reported NIM - Domestic
3.10
12.5
3.02
3.00
11.5
11.17
2.92
11.01
2.89
10.64
2.90
10.56
10.44
10.5
2.80
2.76
2.69
9.5
2.70
8.5
2.60
2QFY15
3QFY15
4QFY15
1QFY16
2QFY16
2QFY15
3QFY15
4QFY15
1QFY16
2QFY16
Source: Company, Angel Research
Source: Company, Angel Research
Strong non-interest income supported earnings
During 2QFY2016, the bank’s non-interest income (excluding treasury) went up by
13.2% yoy led by fee income growth of 8.6% yoy to `361cr. Treasury income rose
by 25.3% yoy, which supported other income to grow at 15.4% yoy to `1,144cr.
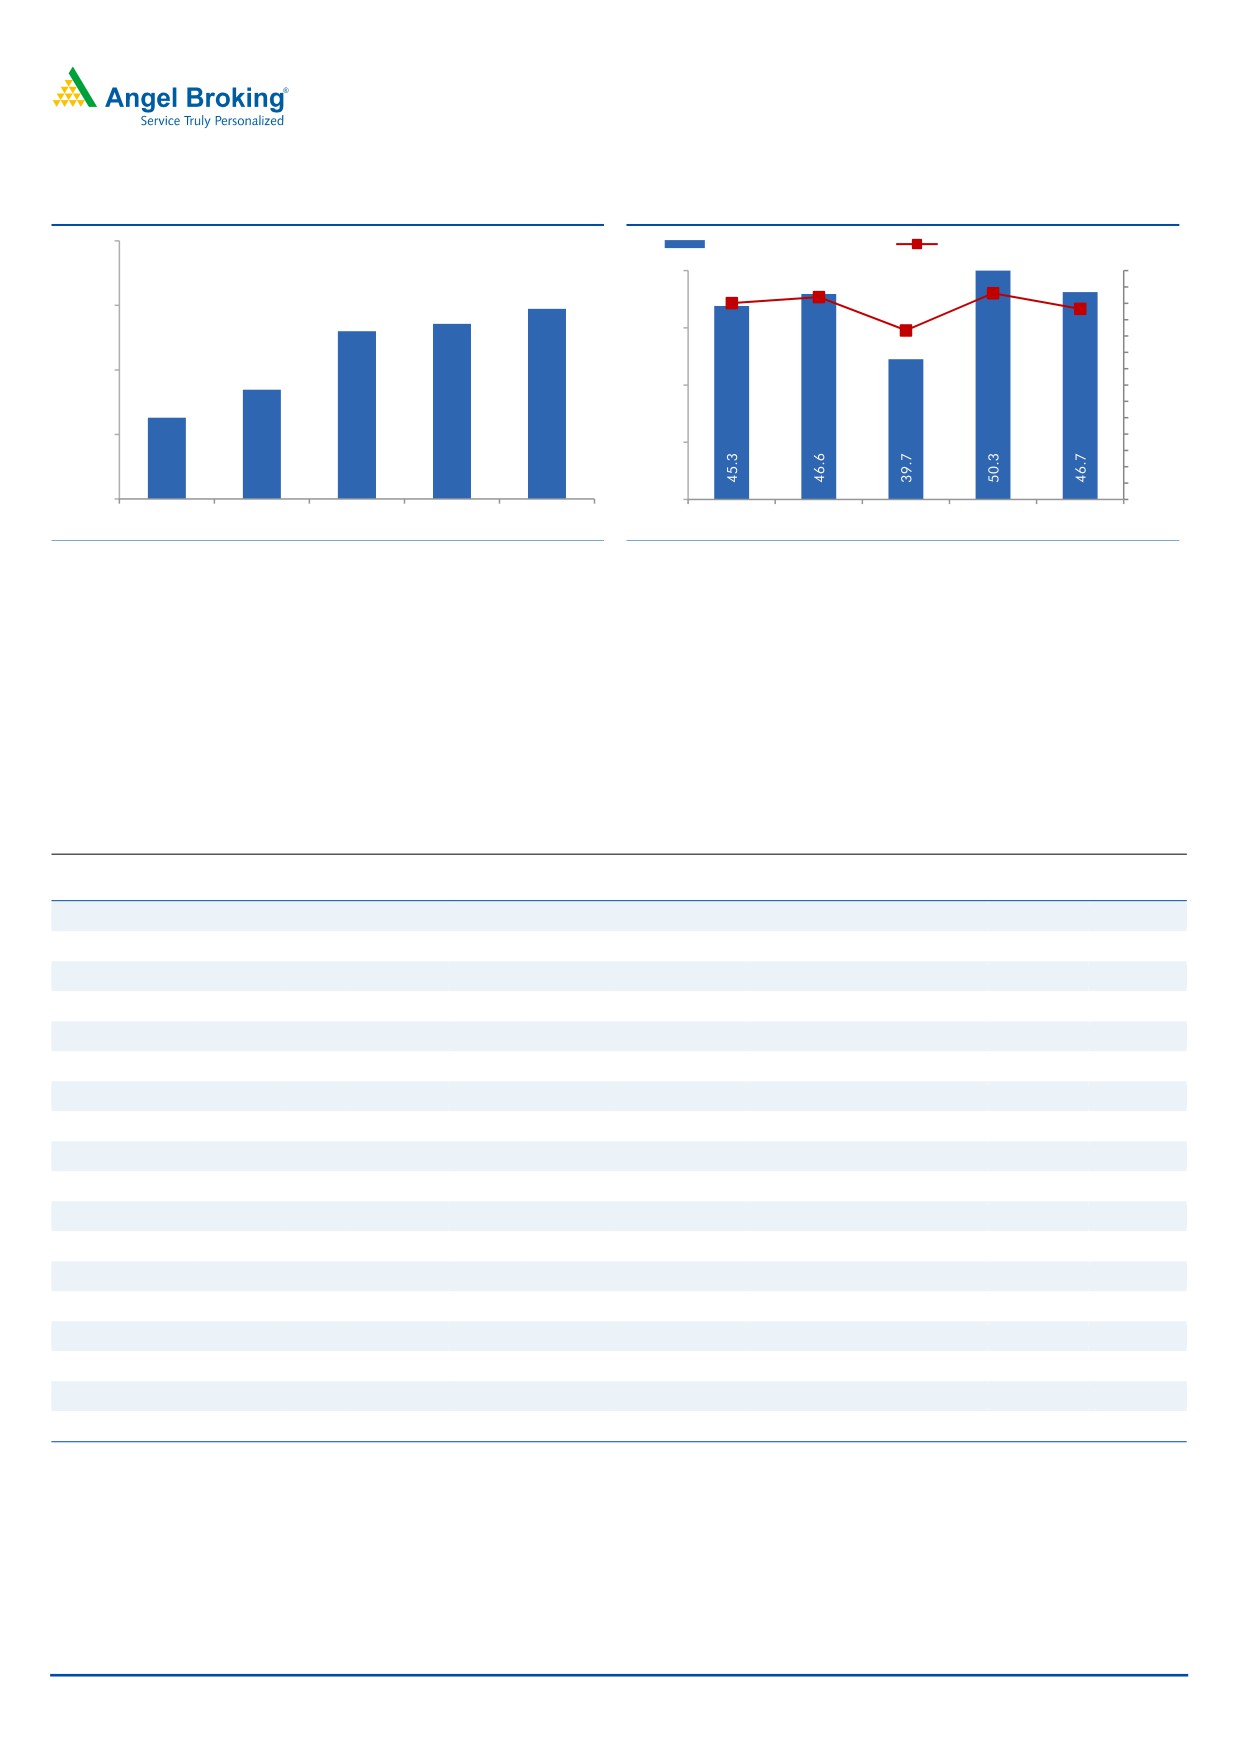
Lower employee expenses supports lower opex
Operating expenses grew by 3.1% yoy; employee expenses declined by 5.8% yoy.
However, other expenses for the bank grew by 14.2% yoy. The bank opened 35
branches during 2QFY2016. The Cost to income ratio stood at 46.8% as against
45.3% in 2QFY2015.
November 10, 2015
4
Bank of Baroda | 2QFY2016 Result Update
Exhibit 7: Other income growth led by higher treasury gains
Particulars (` cr)
2QFY16
1QFY16
% chg (qoq) 2QFY15
% chg (yoy)
CEB
361
346
4.3
333
8.6
Treasury
224
157
42.7
179
25.3
Forex
253
278
(9.0)
252
0.1
Recoveries
79
13
507.1
31
157.2
Others
227
173
31.0
197
15.3
Other income
1,144
967
18.3
992
15.4
Other income excl. treasury
920
810
13.5
813
13.2
Source: Company, Angel Research
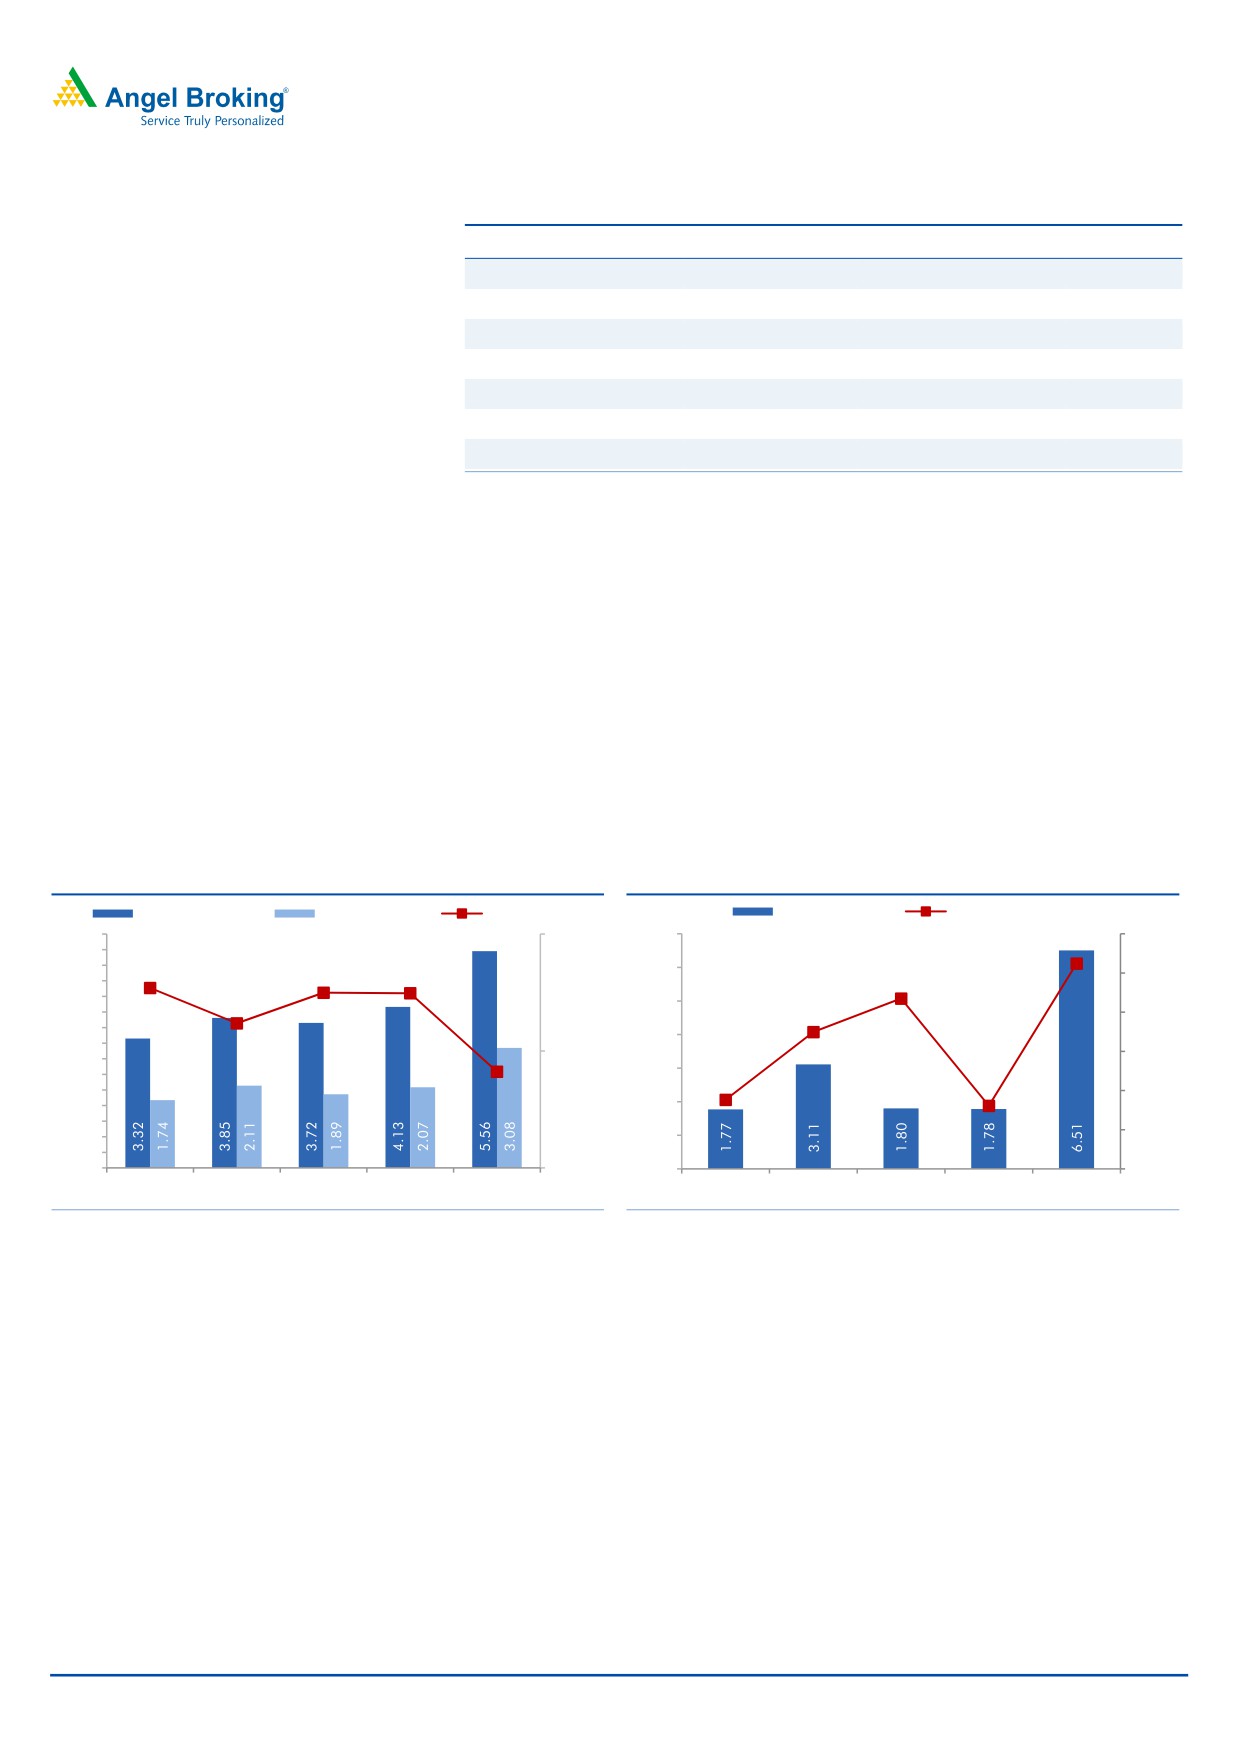
Asset quality deteriorates sharply
On the asset quality front, the Gross NPA ratio rose substantially to 5.56% in
2QFY2016 from 4.13% in 1QFY2016 marking a rise of 143bp sequentially,
whereas the Net NPA ratio was at 3.08% in the quarter as compared to 2.07% in
1QFY2016. There was a sharp spurt in fresh slippages for the quarter which came
at
`6,816cr as compared to
`1,685cr in 1QFY2016 with slippages from
restructured book at `1,391cr, resulting in a sudden spike in annualized slippage
ratio to 6.5% as against 1.8% in 1QFY2016. The bank restructured loans worth
`115cr in 1QFY2016, while it has not refinanced any accounts under the 5/25
schemer nor has it sold any assets to ARCs during the quarter.
Exhibit 8: NPA ratios rises sharply
Exhibit 9: Slippages elevated at 6.5%
Gross NPAs (%)
Net NPAs (%)
PCR (%, RHS)
Slippages (%)
Credit cost (%, RHS)
6.00
70.0
7.00
1.05
1.20
5.60
0.87
5.20
65.4
6.00
65.0
64.9
1.00
4.80
4.40
5.00
62.4
0.70
4.00
0.80
3.60
4.00
3.20
58.2
60.0
0.60
2.80
3.00
2.40
0.35
0.32
2.00
0.40
1.60
2.00
1.20
0.20
0.80
1.00
0.40
-
50.0
-
-
2QFY15
3QFY15
4QFY15
1QFY16
2QFY16
2QFY15
3QFY15
4QFY15
1QFY16
2QFY16
Source: Company, Angel Research
Source: Company, Angel Research
November 10, 2015
5
Bank of Baroda | 2QFY2016 Result Update
Exhibit 10: Steady Branch expansion
Exhibit 11: Cost to income ratio falls sequentially
5,400
Cost-to-income ratio (%)
Opex to average assets (%, RHS)
1.3
49.0
1.2
1.4
1.2
1.2
1.3
5,242
5,250
5,207
1.0
1.2
5,190
1.1
43.0
1.0
0.9
5,100
5,054
0.8
37.0
0.7
4,989
0.6
0.5
4,950
0.4
31.0
0.3
0.2
0.1
4,800
25.0
0.0
2QFY15
3QFY15
4QFY15
1QFY16
2QFY16
2QFY15
3QFY15
4QFY15
1QFY16
2QFY16
Source: Company, Angel Research
Source: Company, Angel Research
Outlook and valuation: Bank of Baroda is currently trading at a higher valuation
multiple as compared to peers on account of market optimism about the bank’s
performance, given the new Management at the helm of affairs. However, the key
lies in the execution of the new strategy, going forward. At the current market
price, the stock trades at a valuation of 0.9x its FY2017E ABV. In our view, the
bank is factoring all the positives. Hence, we maintain our Neutral view on the
stock.
Exhibit 12: Recommendation summary
CMP
Tgt. Price
Upside
FY2017E
FY2017E Tgt.
FY2017E
FY15-17E EPS
FY2017E
FY2017E
Company
Reco.
(`)
(`)
(%)
P/ABV (x)
P/ABV (x)
P/E (x)
CAGR (%)
RoA (%)
RoE (%)
HDFCBk
Buy
1,066
1,262
18.4
3.2
3.8
17.5
22.4
1.9
19.7
ICICIBk*
Buy
263
348
32.3
1.8
2.0
10.4
15.3
1.6
15.2
YesBk
Buy
762
914
19.8
2.0
2.4
11.0
20.2
1.6
19.6
AxisBk
Buy
465
630
35.4
1.9
2.6
10.7
18.4
1.8
18.9
SBI*
Buy
246
283
15.0
1.2
1.2
10.1
17.8
0.7
12.8
FedBk
Neutral
54
-
-
1.0
1.0
8.7
3.1
1.0
11.9
SIB
Neutral
21
-
-
0.7
0.8
6.2
21.6
0.7
11.6
BOB
Neutral
171
-
-
0.9
0.9
8.1
17.5
0.6
10.6
PNB
Neutral
135
-
-
0.6
0.6
5.0
28.5
0.7
12.0
BOI
Neutral
133
-
-
0.3
0.8
4.0
14.0
0.3
7.6
IndBk
Neutral
127
-
-
0.4
0.4
4.3
19.4
0.7
9.3
Vijaya Bank
Neutral
33
-
-
0.4
0.5
5.0
14.1
0.4
8.8
OBC
Neutral
147
-
-
0.3
0.5
3.2
65.5
0.5
9.4
Allahabad Bank Neutral
78
-
-
0.3
0.3
3.1
53.5
0.6
10.9
UnionBk
Neutral
163
-
-
0.5
0.4
4.2
18.1
0.6
11.4
CanBk
Neutral
277
-
-
0.4
0.3
4.0
9.8
0.5
10.7
AllBk
Neutral
78
-
-
0.3
0.4
3.1
53.5
0.6
10.9
IDBI#
Neutral
85
-
-
0.6
0.6
6.0
61.6
0.6
9.3
Source: Company, Angel Research; Note:*Target multiples=SOTP Target Price/ABV (including subsidiaries), #Without adjusting for SASF
November 10, 2015
6
Bank of Baroda | 2QFY2016 Result Update
Company Background
Bank of Baroda (BoB) is the second-largest public sector bank in India, with a
balance sheet size of ~`7.0lakh cr. The bank has a network of 5,242 domestic
branches and more than 8,600 ATMs, mainly in western India (~40% of total
branch network). The bank has a strong presence overseas, with more than 32%
of its advances coming from overseas branches.
November 10, 2015
7
Bank of Baroda | 2QFY2016 Result Update
Income statement (Standalone)
Y/E March (` cr)
FY12
FY13
FY14
FY15
FY16E
FY17E
NII
10,317
11,315
11,965
13,187
13,687
15,730
- YoY Growth (%)
17.2
9.7
5.7
10.2
3.8
14.9
Other Income
3,422
3,631
4,463
4,402
4,798
5,295
- YoY Growth (%)
21.8
6.1
22.9
(1.4)
9.0
10.4
Operating Income
13,739
14,946
16,428
17,589
18,485
21,025
- YoY Growth (%)
18.3
8.8
9.9
7.1
5.1
13.7
Operating Expenses
5,159
5,947
7,137
7,674
8,740
9,396
- YoY Growth (%)
11.4
15.3
20.0
7.5
13.9
7.5
Pre - Provision Profit
8,581
8,999
9,291
9,915
9,745
11,629
- YoY Growth (%)
22.9
4.9
3.2
6.7
(1.7)
19.3
Prov. & Cont.
2,555
4,168
3,794
4,495
5,182
4,460
- YoY Growth (%)
91.9
63.1
(9.0)
18.5
15.3
(13.9)
Profit Before Tax
6,026
4,831
5,497
5,421
4,563
7,170
- YoY Growth (%)
6.6
(19.8)
13.8
(1.4)
(15.8)
57.1
Prov. for Taxation
1,019
351
956
2,022
1,579
2,481
- as a % of PBT
16.9
7.3
17.4
37.3
34.6
34.6
PAT
5,007
4,481
4,541
3,398
2,984
4,688
- YoY Growth (%)
18.0
(10.5)
1.3
(25.2)
(12.2)
57.1
Balance sheet (Standalone)
Y/E March (` cr)
FY12
FY13
FY14
FY15
FY16E
FY17E
Share Capital
412
423
431
444
444
444
Reserves & Surplus
27,064
31,547
35,555
39,391
41,798
45,577
Deposits
3,84,871
4,73,883
5,68,894
6,17,560
6,60,789
7,40,083
- Growth (%)
26.0
23.1
20.0
8.6
7.0
12.0
Borrowings
14,171
17,178
25,411
23,709
25,361
28,306
Tier 2 Capital
9,402
9,402
11,402
11,555
11,266
10,984
Other Liab & Prov.
11,400
14,703
17,812
22,330
25,144
28,219
Total Liabilities
4,47,322
5,47,135
6,59,505
7,14,989
7,64,802
8,53,614
Cash balances
21,651
13,452
18,629
22,489
33,039
37,004
Bank balances
42,517
71,947
1,12,249
1,25,865
1,10,896
1,10,970
Investments
83,209
1,21,394
1,16,113
1,22,320
1,41,265
1,59,408
Advances
2,87,377
3,28,186
3,97,006
4,28,065
4,62,310
5,27,034
- Growth (%)
25.7
14.2
21.0
7.8
8.0
14.0
Fixed Assets
2,342
2,453
2,734
2,875
2,983
3,229
Other Assets
10,225
9,704
12,774
13,376
14,308
15,969
Total Assets
4,47,322
5,47,135
6,59,505
7,14,989
7,64,802
8,53,614
- Growth (%)
24.8
22.3
20.5
8.4
7.0
11.6
November 10, 2015
8
Bank of Baroda | 2QFY2016 Result Update
Ratio analysis (Standalone)
Y/E March
FY12
FY13
FY14
FY15
FY16E
FY17E
Profitability ratios (%)
NIMs
2.6
2.3
2.0
2.0
1.9
2.0
Cost to Income Ratio
37.5
39.8
43.4
43.6
47.3
44.7
RoA
1.2
0.9
0.8
0.5
0.4
0.6
RoE
20.6
15.1
13.4
9.0
7.3
10.6
B/S ratios (%)
CASA Ratio
26.9
25.3
25.7
26.4
27.6
28.1
Credit/Deposit Ratio
74.7
69.3
69.8
69.3
70.0
71.2
CAR
14.7
12.1
12.3
12.4
12.1
11.6
- Tier I
10.8
9.2
9.3
9.5
9.4
9.2
Asset Quality (%)
Gross NPAs
1.5
2.4
2.9
3.7
5.3
5.3
Net NPAs
0.5
1.3
1.5
1.9
2.6
2.2
Slippages
1.5
2.4
2.1
2.1
3.0
2.0
Loan Loss Prov. /Avg. Assets
0.4
0.6
0.5
0.6
0.7
0.5
Provision Coverage
80.1
68.2
65.5
62.5
60.0
65.0
Per Share Data (`)
EPS
24.3
21.2
21.1
15.3
13.5
21.1
ABVPS (75% cover.)
133.3
147.1
159.4
167.5
170.0
192.2
DPS
17.0
21.5
25.2
18.3
13.0
20.5
Valuation Ratios
PER (x)
7.7
8.8
8.8
12.2
13.9
8.8
P/ABVPS (x)
1.4
1.3
1.2
1.1
1.1
1.0
Dividend Yield
9.1
11.5
13.5
9.8
7.0
11.0
DuPont Analysis
NII
2.6
2.3
2.0
1.9
1.8
1.9
(-) Prov. Exp.
0.6
0.8
0.6
0.7
0.7
0.6
Adj. NII
1.9
1.4
1.4
1.3
1.1
1.4
Treasury
0.2
0.1
0.1
0.1
0.2
0.1
Int. Sens. Inc.
2.1
1.6
1.5
1.4
1.3
1.5
Other Inc.
0.7
0.6
0.6
0.5
0.5
0.5
Op. Inc.
2.8
2.2
2.1
1.9
1.8
2.0
Opex
1.3
1.2
1.2
1.1
1.2
1.2
PBT
1.5
1.0
0.9
0.8
0.6
0.9
Taxes
0.3
0.1
0.2
0.3
0.2
0.3
RoA
1.2
0.9
0.8
0.5
0.4
0.6
Leverage
16.6
16.7
17.8
18.1
18.0
18.3
RoE
20.6
15.1
13.4
9.0
7.3
10.6
November 10, 2015
9
Bank of Baroda | 2QFY2016 Result Update
Research Team Tel: 022 - 39357800
DISCLAIMER
Angel Broking Private Limited (hereinafter referred to as “Angel”) is a registered Member of National Stock Exchange of India Limited,
Bombay Stock Exchange Limited and Metropolitan Stock Exchange of India Limited. It is also registered as a Depository Participant with
CDSL and Portfolio Manager with SEBI. It also has registration with AMFI as a Mutual Fund Distributor. Angel Broking Private Limited is
a registered entity with SEBI for Research Analyst in terms of SEBI (Research Analyst) Regulations, 2014 vide registration number
INH000000164. Angel or its associates has not been debarred/ suspended by SEBI or any other regulatory authority for accessing
/dealing in securities Market. Angel or its associates including its relatives/analyst do not hold any financial interest/beneficial
ownership of more than 1% in the company covered by Analyst. Angel or its associates/analyst has not received any compensation /
managed or co-managed public offering of securities of the company covered by Analyst during the past twelve months. Angel/analyst
has not served as an officer, director or employee of company covered by Analyst and has not been engaged in market making activity
of the company covered by Analyst.
This document is solely for the personal information of the recipient, and must not be singularly used as the basis of any investment
decision. Nothing in this document should be construed as investment or financial advice. Each recipient of this document should
make such investigations as they deem necessary to arrive at an independent evaluation of an investment in the securities of the
companies referred to in this document (including the merits and risks involved), and should consult their own advisors to determine
the merits and risks of such an investment.
Reports based on technical and derivative analysis center on studying charts of a stock's price movement, outstanding positions and
trading volume, as opposed to focusing on a company's fundamentals and, as such, may not match with a report on a company's
fundamentals.
The information in this document has been printed on the basis of publicly available information, internal data and other reliable
sources believed to be true, but we do not represent that it is accurate or complete and it should not be relied on as such, as this
document is for general guidance only. Angel Broking Pvt. Limited or any of its affiliates/ group companies shall not be in any way
responsible for any loss or damage that may arise to any person from any inadvertent error in the information contained in this report.
Angel Broking Pvt. Limited has not independently verified all the information contained within this document. Accordingly, we cannot
testify, nor make any representation or warranty, express or implied, to the accuracy, contents or data contained within this document.
While Angel Broking Pvt. Limited endeavors to update on a reasonable basis the information discussed in this material, there may be
regulatory, compliance, or other reasons that prevent us from doing so.
This document is being supplied to you solely for your information, and its contents, information or data may not be reproduced,
redistributed or passed on, directly or indirectly.
Neither Angel Broking Pvt. Limited, nor its directors, employees or affiliates shall be liable for any loss or damage that may arise from
or in connection with the use of this information.
Note: Please refer to the important ‘Stock Holding Disclosure' report on the Angel website (Research Section). Also, please refer to the
latest update on respective stocks for the disclosure status in respect of those stocks. Angel Broking Pvt. Limited and its affiliates may
have investment positions in the stocks recommended in this report.
Disclosure of Interest Statement
Bank of Baroda
1. Analyst ownership of the stock
No
2. Angel and its Group companies ownership of the stock
No
3. Angel and its Group companies' Directors ownership of the stock
No
4. Broking relationship with company covered
No
Note: We have not considered any Exposure below ` 1 lakh for Angel, its Group companies and Directors
Ratings (Based on expected returns
Buy (> 15%)
Accumulate (5% to 15%)
Neutral (-5 to 5%)
over 12 months investment period):
Reduce (-5% to -15%)
Sell (< -15)
November 10, 2015
10