3QFY2017 Result Update | Banking
February 15, 2017
Bank Of Baroda
NEUTRAL
CMP
`168
Performance Highlights
Target Price
-
Particulars (` cr)
Q3FY17
Q2FY17
% chg (qoq)
Q3FY16
% chg (yoy)
Investment Period
NII
3,134
3,426
(8.5)
2,705
15.9
Pre-prov. profit
2,595
2,690
(3.5)
1,704
52.3
Stock Info
PAT
253
552
(54)
(3342)
(107.6)
Source: Company, Angel Research
Sector
Banks
Market Cap (` cr)
37,546
BoB’s 3QFY17 results remained disappointing. The bank continues to face
headwinds on asset quality on one hand, while on the other hand the balance
Beta
1.5
sheet continued to de-grow as the management intentionally downsized some low
52 Week High / Low
192/126
margin business. Coming few quarters might be challenging for the bank.
Avg. Daily Volume
1,148,032
Loan book continued to decline as overseas portfolio downsized: Overall loan
Face Value (`)
2
growth declined by 8.9% YoY, as the overseas loan portfolio decline by 20.1%
BSE Sensex
28,156
YoY. The management has taken a cautious call of downsizing the low margin
Nifty
8,725
portfolio like buyers credit and hence there was de growth in loan book. While the
Reuters Code
BOB.BO
bank intends to focus on profitable segment and lend selectively, this might take a
Bloomberg Code
BOB@IN
toll on the overall growth in the near term. While CASA growth remained strong
up 25% YoY, the bank’s overseas deposit portfolio declined by 14.1%YoY and
hence overall deposit base remained flat YoY, but saw a 3.9% growth QoQ.
Shareholding Pattern (%)
NIM was under pressure, likely to remain subdued in the near term: NIM was
Promoters
59.2
under pressure and declined to 2.06% vs 2.29% QoQ due to interest reversals to
MF / Banks / Indian Fls
22.6
the tune of `260 cr. The bank as a strategy has been downsizing the overseas
FII / NRIs / OCBs
12.1
loan book, which attracts very low margin and higher contribution from the
Indian Public / Others
6.1
domestic business can lead to better margins in the long run, however in the near
term we expect NIM to remain under pressure.
No Respite from asset quality issues: While the bank has been maintaining that
Abs.(%)
3m 1yr 3yr
large part of the asset quality might get over, the slippages remained elevated.
Sensex
7.0
19.5
38.2
Gross slippages of `4135cr (slippages ratio of 4.16%) was much higher than
Bank of Baroda
(6.4)
16.9
52.2
`2,861cr (slippage ratio of 2.84%) in 2QFY17. Though slippages remained high,
aggressive write off resulted in sequential decline in GNPAs. GNPAs % for the
quarter stood at 11.4% vs 11.35% qoq, while NNPA% was at 5.43% vs 5.46%.The
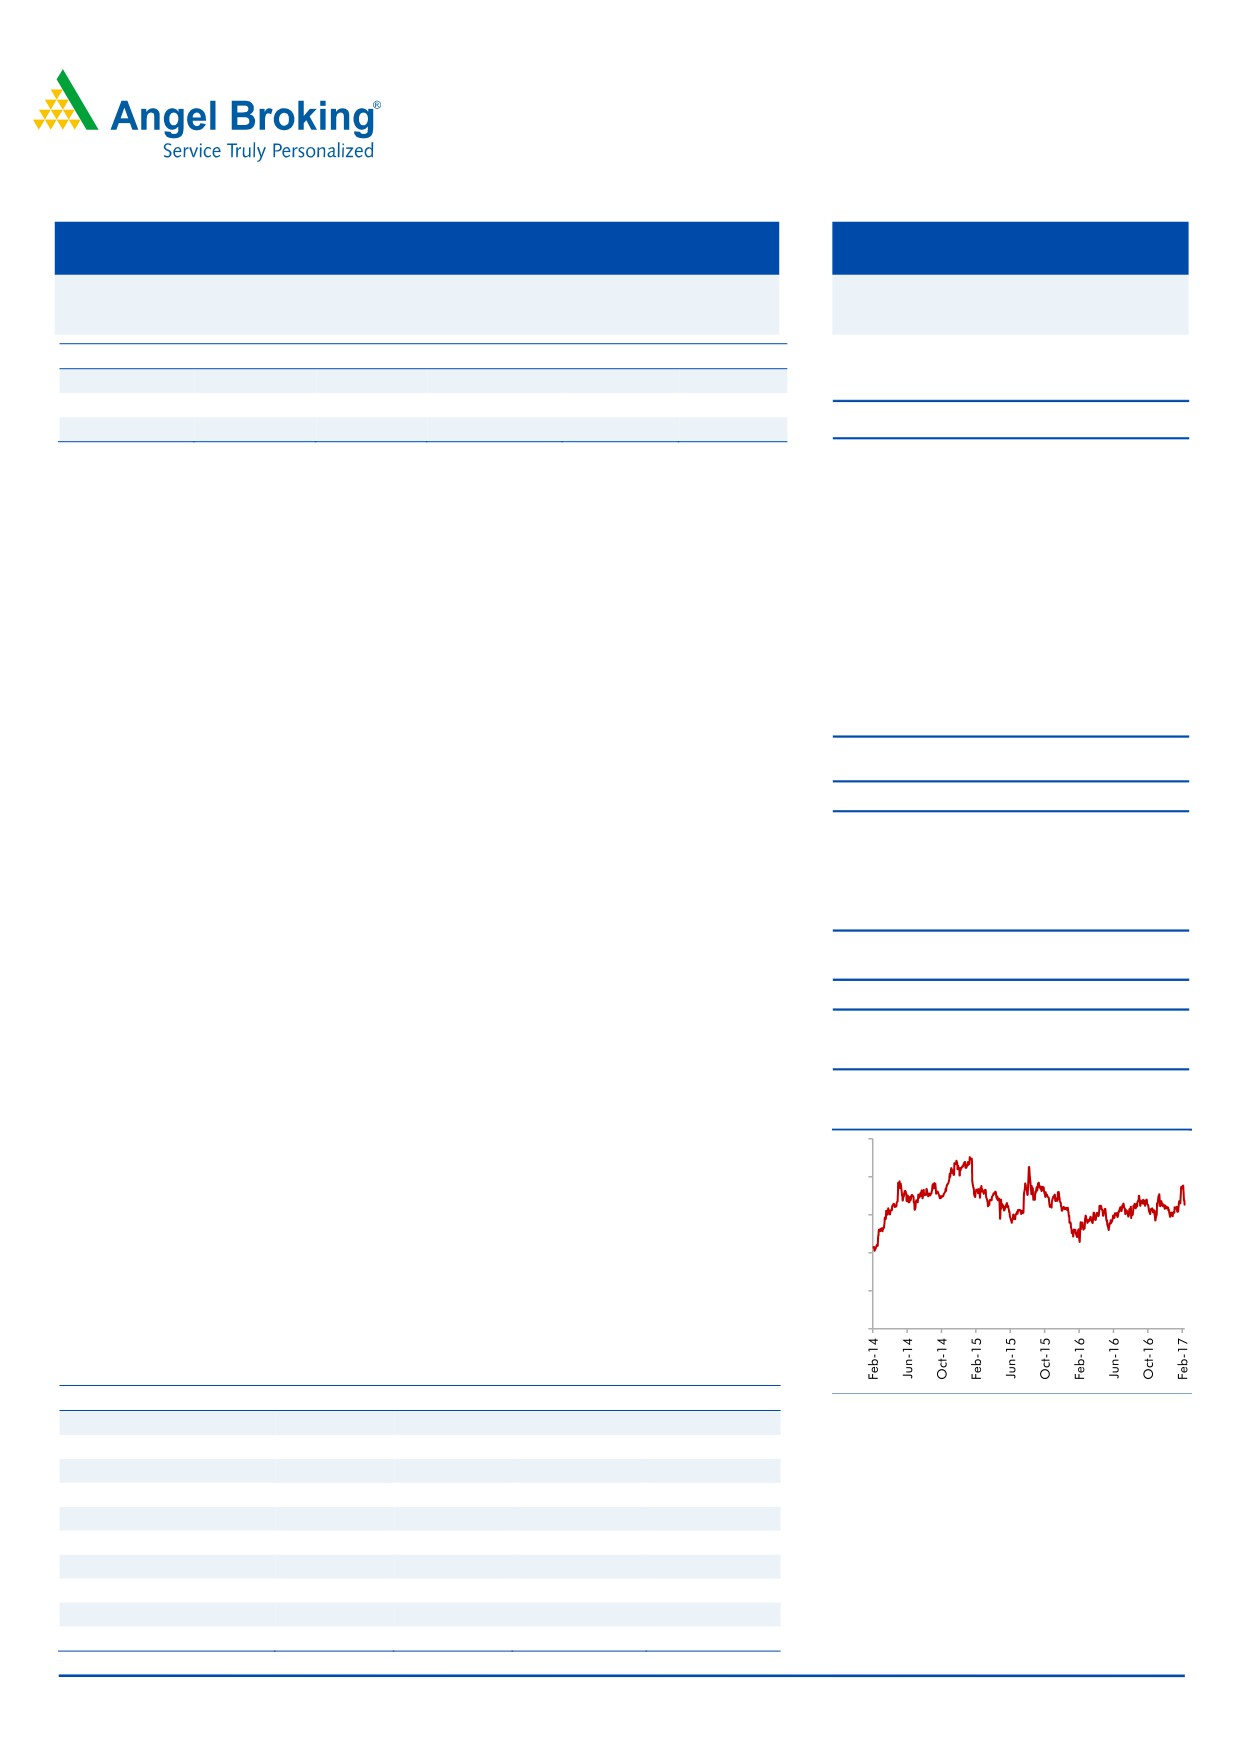
3-year price chart
250
bank intends to improve its provisioning coverage ratio and hence in absolute
terms the provisions might remain high in the quarters to come.
200
Outlook and valuation: With continued pressure on asset quality and resultant
150
credit cost the earnings of the bank might remain under pressure in the near term
100
Further as the bank is looking to downsize the low margin business the overall
loan growth might disappoint and the stock might remain range bound. At the
50
current market price, the stock is trading at 1.7x FY2018E ABV.We have a
0
NEUTRAL rating on the stock.
Key financials (Standalone)
Y/E March (` cr)
FY2015
FY2016
FY2017E
FY2018E
Source: Company, Angel Research
NII
13,187
12,740
13,532
15,445
% chg
10.2
(3.4)
6.2
14.1
Net profit
3,398
(5,393)
1,670
3,417
% chg
(25.7)
(258.7)
(131.0)
104.6
NIM (%)
2.0
1.9
2.1
2.2
EPS (`)
15.3
(23.3)
7.2
14.8
P/E (x)
11.1
(7.3)
23.5
11.5
P/ABV (x)
1.2
1.9
1.8
1.7
Siddharth Purohit
RoA (%)
0.5
(0.8)
0.2
0.5
022 - 3935 7800 Ext: 6872
RoE (%)
9.0
(13.5)
4.1
8.0
Source: Company, Angel Research; Note: CMP as of February 14, 2017
Please refer to important disclosures at the end of this report
1
Bank Of Baroda | 3QFY2017 Result Update
Exhibit 1: 3QFY17 Income Statement ( Standalone)
Particulars (` cr)
Q1FY16
Q2FY16
Q3FY16
Q4FY16
Q1FY17
Q2FY17
Q3FY17
% YoY
% QoQ
Interest earned
11,276
11,156
10,614
11,014
10,434
10,485
10,406
(2.0)
(0.8)
- on Advances / Bills
8,033
7,712
7,169
6,882
7,162
6,840
6,736
(6.0)
(1.5)
- on investments
2,651
2,739
2,686
2,689
2,495
2,533
2,719
1.2
7.3
- on balance with RBI & others
296
291
353
365
325
392
521
47.3
32.9
- on others
297
414
406
1,077
452
721
430
6.1
(40.3)
Interest Expended
7,817
7,912
7,909
7,684
7,062
7,059
7,272
(8.1)
3.0
Net Interest Income
3,460
3,244
2,705
3,330
3,371
3,426
3,134
15.9
(8.5)
Other income
967
1,144
1,113
1,775
1,444
1,561
1,775
59.5
13.7
- Fee income
519
841
799
1162
848
948
887
11.0
(6.4)
- Treasury income
435
224
289
509
557
546
839
190.3
53.7
- Others
13
79
24
104
39
68
49
104.2
(27.9)
Operating income
4,427
4,389
3,818
5,105
4,815
4,988
4,909
28.6
(1.6)
Operating expenses
2,223
2,051
2,114
2,533
2,146
2,297
2,314
9.5
0.7
- Employee expenses
1,343
1,044
1,155
1,434
1,108
1,169
1,139
(1.4)
(2.5)
- Other Opex
880
1,008
959
1,098
1,038
1,129
1,175
22.5
4.1
Pre-provision Profit
2,204
2,337
1,704
2,572
2,669
2,690
2,595
52.3
(3.5)
Provisions & Contingencies
600
1,892
6,165
6,858
2,004
1,796
2,080
(66.3)
15.8
PBT
1,604
445
(4,460)
(4,285)
665
894
516
(111.6)
(42.3)
Provision for Tax
550
321
(1,118)
(1,055)
242
342
263
(123.5)
(23.1)
PAT
1,054
124
(3,342)
(3,230)
424
552
253
(107.6)
(54.2)
Effective Tax Rate (%)
34
72
25
25
36
38
51
Source: Company, Angel Research
February 15, 2017
2
Bank Of Baroda | 3QFY2017 Result Update
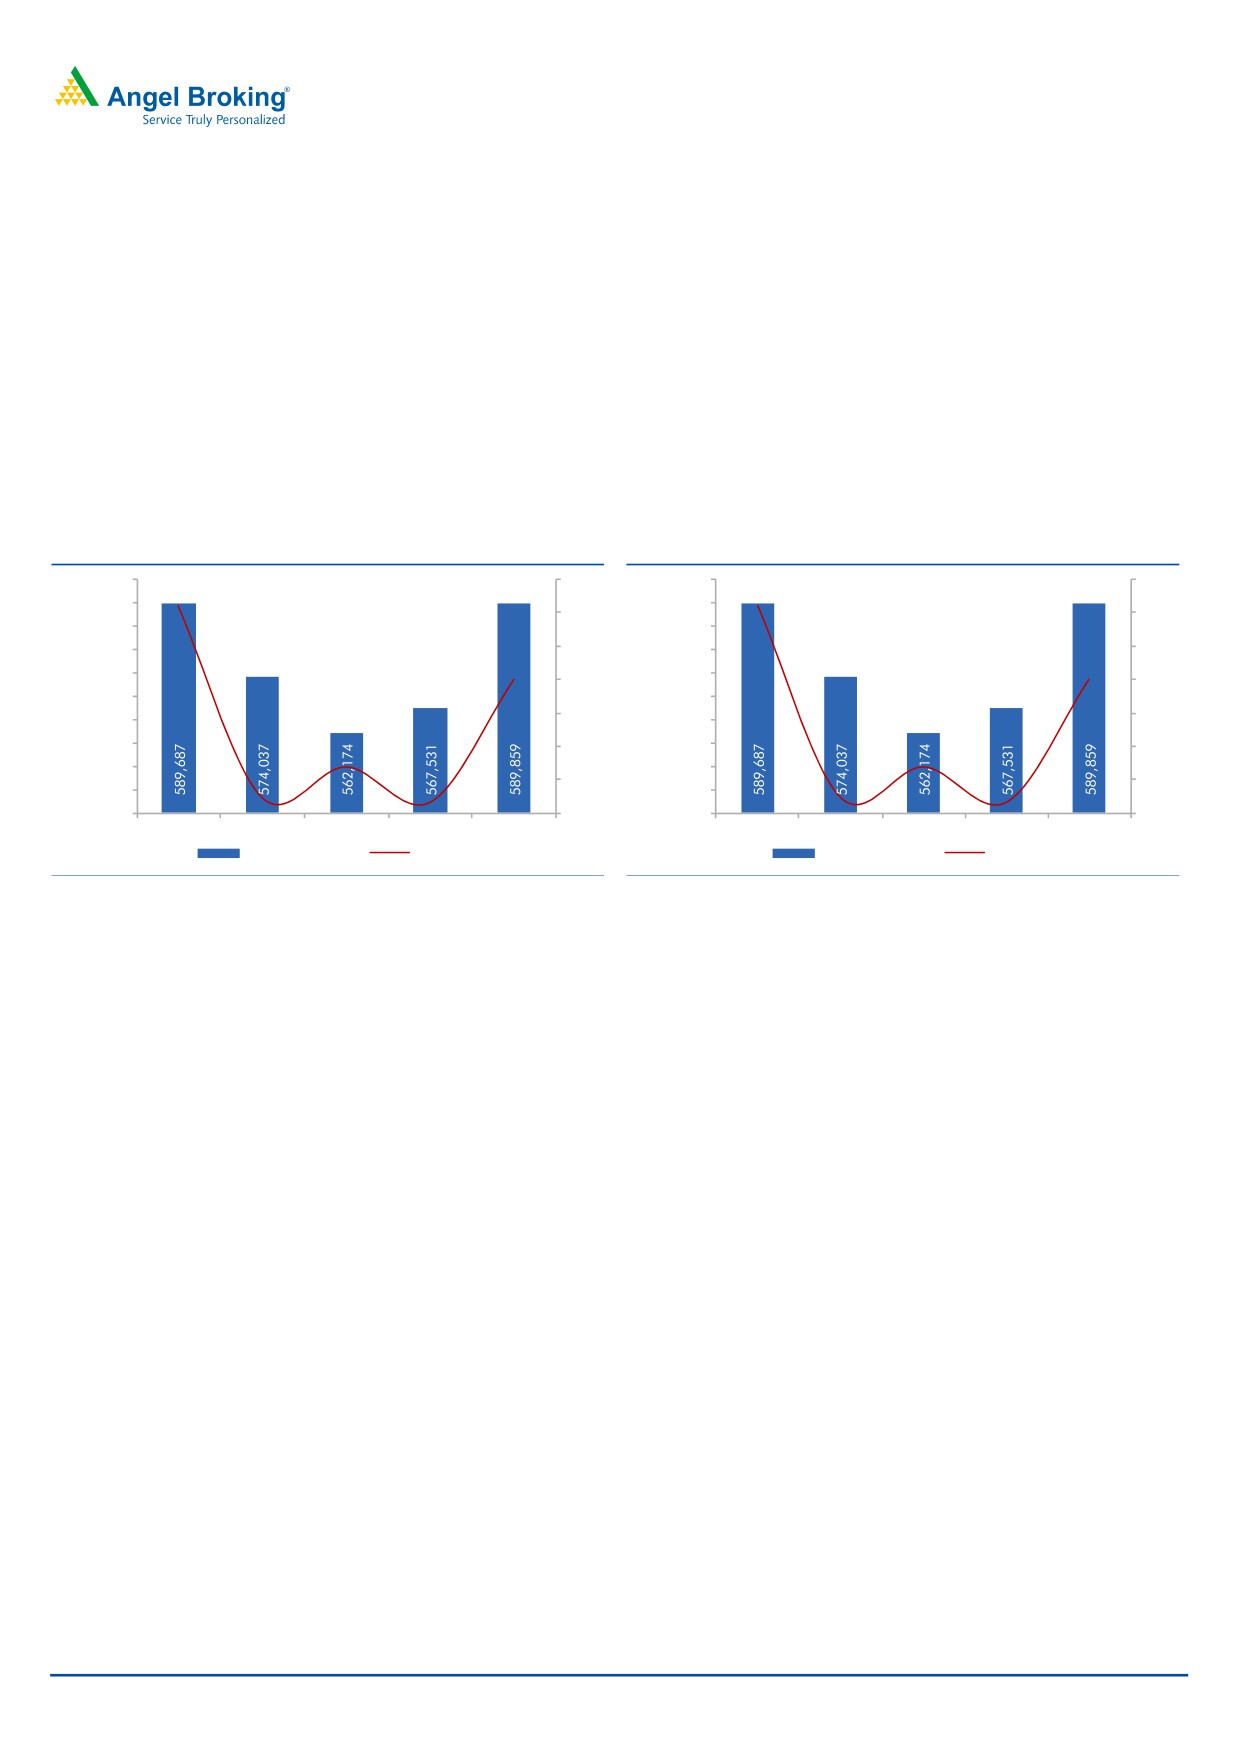
Loan book continued to decline as overseas portfolio downsized: Overall loan
growth declined by
8.9% YoY, as the overseas loan portfolio decline by
20.1% YoY. The management has taken a cautious call of downsizing the low
margin portfolio like buyers credit and hence there was de growth in loan book.
While the bank intends to focus on profitable segment and lend selectively, this
might take a toll on the overall growth in the near term
Despite high growth in CASA, decline in overseas deposits resulted in overall
decline in deposit base: While CASA growth remained strong up 25% YoY, the
bank’s overseas deposit portfolio declined by 14.1%YoY and hence overall deposit
base remained flat YoY, but saw a 3.9% growth QoQ.
Exhibit 2: Loan book continued to decline
Exhibit 3: Deposit base remained flat
595,000
6.0
595,000
6.0
590,000
4.4
590,000
4.4
4.0
4.0
585,000
585,000
580,000
2.0
580,000
2.0
575,000
575,000
0.0
0.0
0.0
0.0
570,000
570,000
(2.0)
(2.0)
565,000
565,000
560,000
(4.0)
560,000
(4.0)
555,000
(5.2)
555,000
(5.2)
(7.0)
(6.0)
(7.0)
(6.0)
550,000
550,000
(7.3)
(7.3)
545,000
(8.0)
545,000
(8.0)
Q3FY16
Q4FY16
Q1FY17
Q2FY17
Q3FY17
Q3FY16
Q4FY16
Q1FY17
Q2FY17
Q3FY17
Deposits (` Cr)
% Growth YoY
Deposits (` Cr)
% Growth YoY
Source: Company, Angel Research
Source: Company, Angel Research
February 15, 2017
3
Bank Of Baroda | 3QFY2017 Result Update
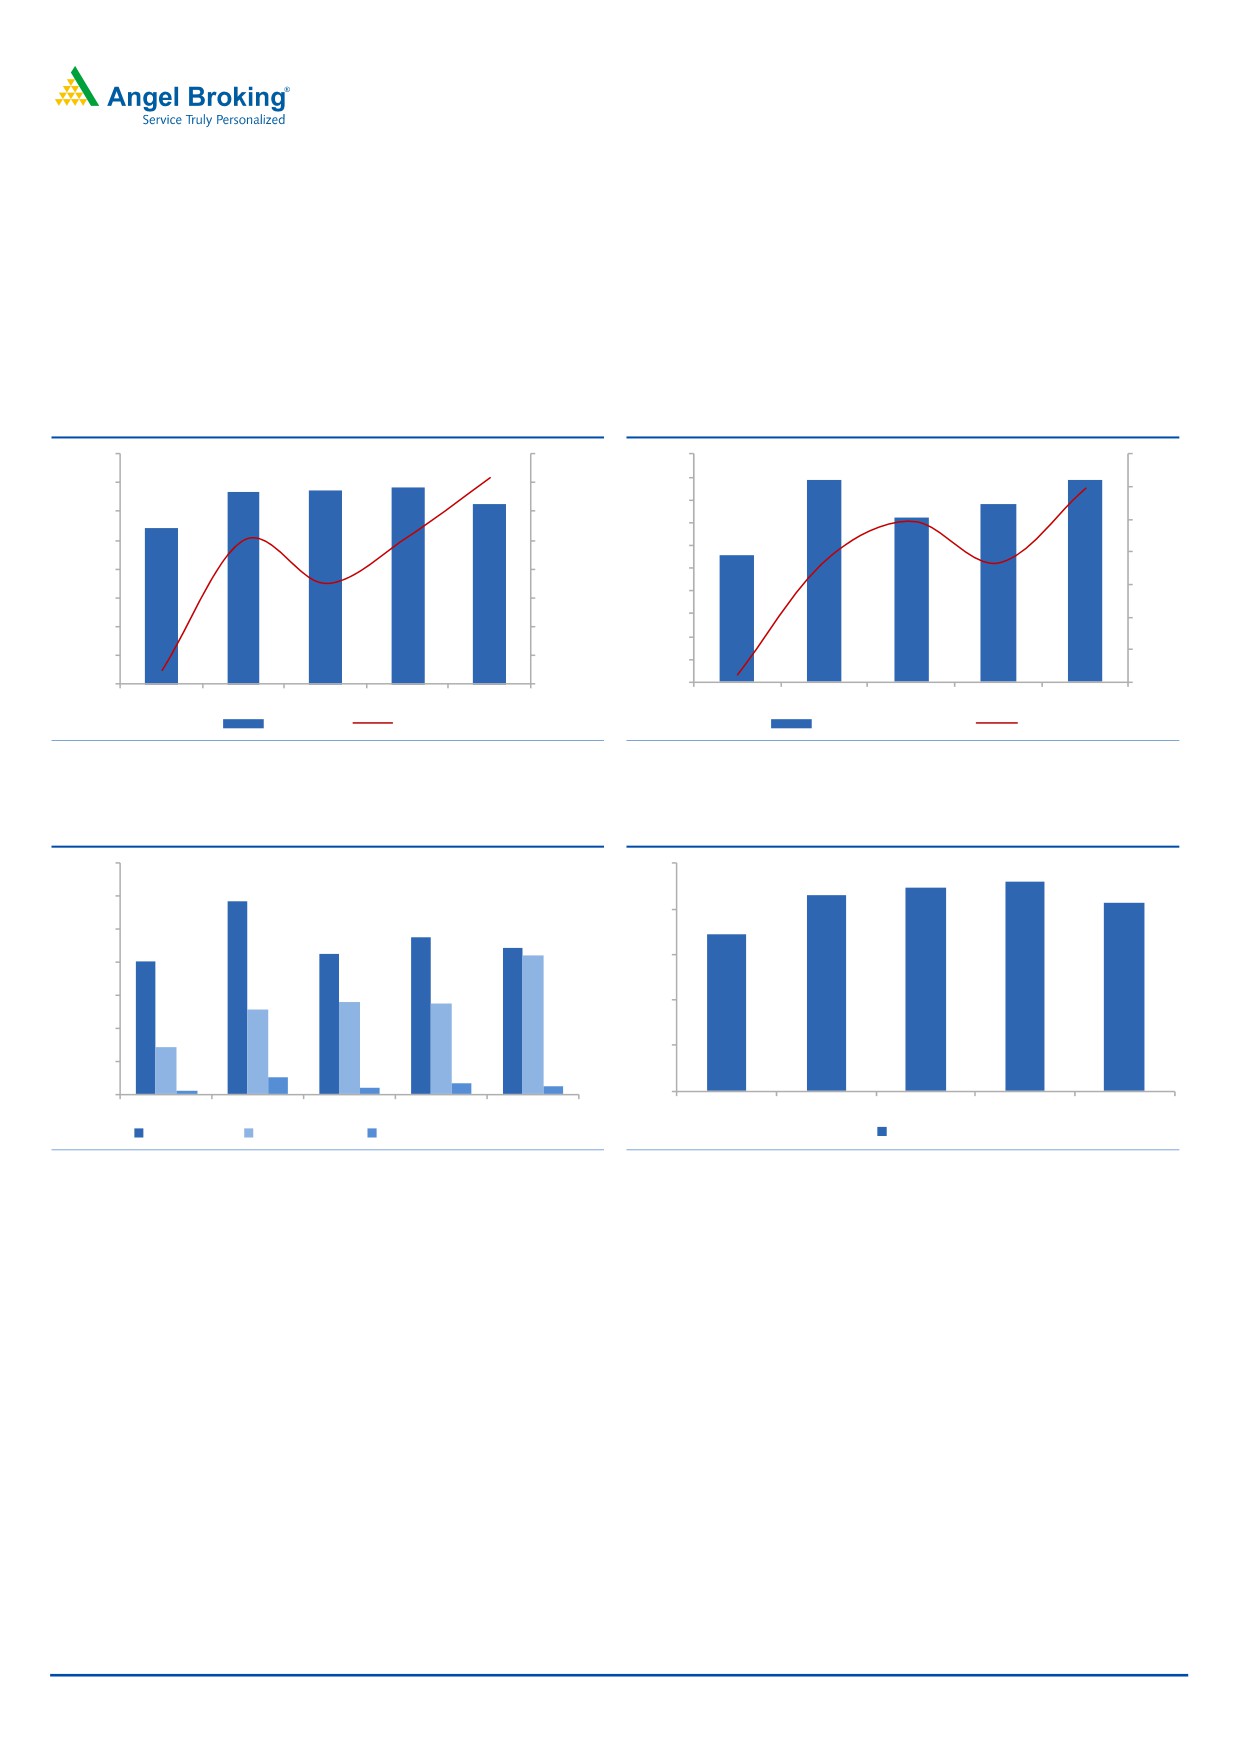
NIM was under pressure, likely to remain subdued in the near term: NIM was
under pressure and declined to 2.06% vs 2.29% QoQ due to interest reversals to
the tune of `260 cr. The bank as a strategy has been downsizing the overseas loan
book, which attracts very low margin and higher contribution from the domestic
business can lead to better margins in the long run, however in the near term we
expect NIM to remain under pressure.
Exhibit 4: NII Growth was on a low base
Exhibit 5: Other income got boost from treasury gain
4,000
20.0
2,000
70.0
15.9
1,775
1,775
3,371
3,426
3,330
1,800
3,500
15.0
1,561
60.0
3,134
59.5
1,600
1,444
3,000
2,705
10.0
1,400
49.3
50.0
5.0
5.6
2,500
5.0
1,113
1,200
40.0
37.0
36.5
2,000
0.0
1,000
(2.6)
800
30.0
1,500
(5.0)
600
20.0
1,000
(10.0)
400
10.0
500
(15.0)
200
(17.7)
2.1
-
(20.0)
-
0.0
Q3FY16
Q4FY16
Q1FY17
Q2FY17
Q3FY17
Q3FY16
Q4FY16
Q1FY17
Q2FY17
Q3FY17
NII (` Cr)
% YoY
Other Income (` Cr)
% YoY
Source: Company, Angel Research
Source: Company, Angel Research
Exhibit 6: Break Up Of Other Income
Exhibit 7: NIM Trend
1,400
2.5
2.3
2.2
2.2
1,162
2.1
1,200
2.0
948
1.7
1,000
887
848
839
799
1.5
800
557
546
600
509
1.0
400
289
0.5
200
104
68
49
24
39
-
-
Q3FY16
Q4FY16
Q1FY17
Q2FY17
Q3FY17
Q3FY16
Q4FY16
Q1FY17
Q2FY17
Q3FY17
Fees Income
Trading Gains
Recovery From Writeen off ac
NIM % ( Global)
Source: Company, Angel Research
Source: Company, Angel Research
February 15, 2017
4
Bank Of Baroda | 3QFY2017 Result Update
No Respite from asset quality issues: While the bank has been maintaining that
large part of the asset quality might get over, the slippages remained elevated.
Gross slippages of `4135 cr (slippages ratio of 4.16%) was much higher than
` 2861 cr (slippage ratio of 2.84%). While recovery and up gradation combined at
`2667 cr remained flat qoq, there was sharp spike in write off - `1775 cr vs ` 216
cr in 2QFY17. Though slippages remained high, aggressive write off resulted in
sequential decline in GNPAs. GNPAs % for the quarter stood at 11.4% vs 11.35%
qoq, while NNPA% was at 5.43% vs 5.46%. Total stressed assets stood at 18.6% of
the book (GNPAs 11.4%+Restructured 7.2%).
Outstanding restructured book was at `29,019 cr vs `28,464 cr, of which
standard restructured was `14,059 cr vs `13,860 cr qoq. Outstanding S4A
accounts were at `1,948 cr, accounts under DSR were at `6,944 cr, while accounts
where 5:25 has been implemented were to the tune of `7,408cr. Asset quality
issues continue to impact the performance of BoB and the trend doesn’t seem to
be reversing any time soon.
Exhibit 8: GNNPAs & NNPAs remained stable
Exhibit 9: Restructured loan book saw marginal rise
12.00
5.80
30,500
5.73
5.67
11.40
29,801
11.35
30,000
11.50
5.60
29,500
11.15
29,004
29,019
11.00
5.40
29,000
5.43
28,464
5.46
10.50
28,500
5.20
28,000
10.00
9.99
5.06
27,500
5.00
9.50
9.68
26,938
27,000
9.00
4.80
26,500
26,000
8.50
4.60
Q3FY16
Q4FY16
Q1FY17
Q2FY17
Q3FY17
25,500
GNPAs (%)
NNPAs (%)
Q3FY16
Q4FY16
Q1FY17
Q2FY17
Q3FY17
Source: Company, Angel Research
Source: Company, Angel Research
Exhibit 10: Slippages ratio remained elevated
Exhibit 11: Credit cost went up further
16.0
8.0
14.6
14.0
7.0
7.1
6.4
12.0
6.0
10.0
5.0
8.0
4.0
6.0
5.8
5.8
3.0
2.4
4.0
4.2
2.0
2.2
2.0
2.0
2.8
1.0
-
-
Q3FY16
Q4FY16
Q1FY17
Q2FY17
Q3FY17
Q3FY16
Q4FY16
Q1FY17
Q2FY17
Q3FY17
Slippages Ratio %
Credit Cost Annualized
Source: Company, Angel Research
Source: Company, Angel Research
February 15, 2017
5
Bank Of Baroda | 3QFY2017 Result Update
Outlook and Valuation
With continued pressure on asset quality and resultant credit cost the earnings of
the bank might remain under pressure in the near term. Further as the bank is
looking to downsize the low margin business the overall loan growth might
disappoint. At the current market price, the stock is trading at 1.7x FY2018E
ABV.We have a NEUTRAL rating on the stock.
Company Background
Bank Of Baroda is one of the leading PSU banks and has large overseas presence.
Looking at the lower margin in the overseas business the management is trimming
down it international business .International business contributed ~27% of the total
business for the bank at the end of the quarter. In the domestic market the bank
has got 5,382 branches and 10,404 ATMs.
February 15, 2017
6
Bank Of Baroda | 3QFY2017 Result Update
Income statement (Standalone)
Y/E March (` cr)
FY14
FY15
FY16
FY17E
FY18E
Net Interest Income
11,965
13,187
12,740
13,532
15,445
- YoY Growth (%)
5.7
10.2
(3.4)
6.2
14.1
Other Income
4,463
4,402
4,999
5,969
5,328
- YoY Growth (%)
22.9
(1.4)
13.6
19.4
(10.7)
Operating Income
16,428
17,589
17,739
19,501
20,772
- YoY Growth (%)
9.9
7.1
0.9
9.9
6.5
Operating Expenses
7,106
7,674
8,921
9,104
9,600
- YoY Growth (%)
19.5
8.0
16.2
2.1
5.4
Pre - Provision Profit
9,322
9,915
8,818
10,396
11,172
- YoY Growth (%)
3.6
6.4
(11.1)
17.9
7.5
Prov. & Cont.
3,794
4,495
15,514
7,690
5,782
- YoY Growth (%)
(9.0)
18.5
245.2
(50.4)
(24.8)
Profit Before Tax
5,529
5,421
(6,696)
2,706
5,390
- YoY Growth (%)
14.4
(2.0)
(223.5)
(140.4)
99.2
Prov. for Taxation
956
2,022
(1,303)
1,036
1,973
- as a % of PBT
172.8
111.5
(164.4)
(179.5)
90.4
PAT
4,572
3,398
(5,393)
1,670
3,417
- YoY Growth (%)
2.0
(25.7)
(258.7)
(131.0)
104.6
Balance sheet (Standalone)
Y/E March (` cr)
FY14
FY15
FY16
FY17E
FY18E
Share Capital
431
444
462
462
462
Reserve & Surplus
35,555
39,392
39,737
41,240
43,672
Net Worth
35,986
39,835
40,199
41,702
44,134
Deposits
568,894
617,560
574,037
595,757
683,401
- Growth (%)
20.0
8.6
-7.0
3.8
14.7
Borrowings
36,813
35,264
33,472
35,745
41,004
- Growth (%)
38.5
-4.2
-5.1
6.8
14.7
Other Liab. & Prov.
17,811
22,329
23,668
23,830
27,336
Total Liabilities
659,505
714,989
671,376
697,035
795,874
Cash in Hand and with RBI
18,629
22,489
21,672
23,830
27,336
Bal.with banks & money at call
112,249
125,865
112,228
107,236
123,012
Investments
116,113
116,812
120,451
166,812
191,352
Advances
397,006
428,065
383,770
362,209
409,609
- Growth (%)
21.0
7.8
-10.3
-5.6
13.1
Fixed Assets
2,734
2,875
6,254
6,553
6,834
Other Assets
12,774
18,883
27,001
30,394
37,731
Total Assets
659,505
714,989
671,376
697,035
795,874
February 15, 2017
7
Bank Of Baroda | 3QFY2017 Result Update
Ratio analysis (Standalone)
Y/E March
FY14
FY15
FY16
FY17E
FY18E
Profitability Ratios (%)
NIMs
2.0
2.0
1.9
2.1
2.2
Cost to Income Ratio
43.3
43.6
50.3
46.7
46.2
RoA
0.8
0.5
-0.8
0.2
0.5
RoE
13.5
9.0
-13.5
4.1
8.0
B/S ratios (%)
CASA Ratio
25.7
26.4
24.1
0.0
0.0
Credit/Deposit Ratio
69.8
69.3
66.9
60.8
59.9
CAR
13.9
12.6
13.2
12.4
12.0
- Tier I
10.8
9.9
10.8
9.2
9.0
Asset Quality (%)
Gross NPAs
2.9
3.7
10.0
10.6
8.5
Net NPAs
1.5
1.9
5.1
5.3
5.1
Slippages
2.0
2.0
6.5
3.9
1.7
Loan Loss Prov./Avg. Assets
1.0
1.0
4.0
2.1
1.4
Provision Coverage
49.2
50.4
52.1
45.0
45.0
Per Share Data (`)
EPS
21.2
15.3
-23.3
7.2
14.8
ABVPS
137
143
90
97
101
DPS
4.4
4.7
4.9
2.5
4.0
Valuation Ratios
PER (x)
8.0
11.1
-7.3
23.5
11.5
P/ABVPS (x)
1.2
1.2
1.9
1.8
1.7
Dividend Yield
2.6
2.8
2.9
1.5
2.4
DuPont Analysis (%)
Interest Income
6.5
6.3
6.4
6.2
6.2
Interest Expenses
4.5
4.3
4.5
4.2
4.1
NII
2.0
1.9
1.8
2.0
2.1
Non Interest Income
0.7
0.6
0.7
0.9
0.7
Total Revenues
2.7
2.6
2.6
2.9
2.8
Operating Cost
1.2
1.1
1.3
1.3
1.3
PPP
1.5
1.4
1.3
1.5
1.5
Total Provisions
0.6
0.7
2.2
1.1
0.8
PreTax Profit
0.9
0.8
-1.0
0.4
0.7
Tax
0.2
0.3
-0.2
0.2
0.3
ROA
0.8
0.5
-0.8
0.2
0.5
Leverage
17.8
18.1
17.3
16.7
17.4
RoE (%)
13.5
9.0
-13.5
4.1
8.0
February 15, 2017
8
Bank Of Baroda | 3QFY2017 Result Update
Research Team Tel: 022 - 39357800
DISCLAIMER
Angel Broking Private Limited (hereinafter referred to as “Angel”) is a registered Member of National Stock Exchange of India Limited,
Bombay Stock Exchange Limited and Metropolitan Stock Exchange Limited. It is also registered as a Depository Participant with CDSL
and Portfolio Manager with SEBI. It also has registration with AMFI as a Mutual Fund Distributor. Angel Broking Private Limited is a
registered entity with SEBI for Research Analyst in terms of SEBI (Research Analyst) Regulations, 2014 vide registration number
INH000000164. Angel or its associates has not been debarred/ suspended by SEBI or any other regulatory authority for accessing
/dealing in securities Market. Angel or its associates/analyst has not received any compensation / managed or co-managed public
offering of securities of the company covered by Analyst during the past twelve months.
This document is solely for the personal information of the recipient, and must not be singularly used as the basis of any investment
decision. Nothing in this document should be construed as investment or financial advice. Each recipient of this document should
make such investigations as they deem necessary to arrive at an independent evaluation of an investment in the securities of the
companies referred to in this document (including the merits and risks involved), and should consult their own advisors to determine
the merits and risks of such an investment.
Reports based on technical and derivative analysis center on studying charts of a stock's price movement, outstanding positions and
trading volume, as opposed to focusing on a company's fundamentals and, as such, may not match with a report on a company's
fundamentals. Investors are advised to refer the Fundamental and Technical Research Reports available on our website to evaluate the
contrary view, if any.
The information in this document has been printed on the basis of publicly available information, internal data and other reliable
sources believed to be true, but we do not represent that it is accurate or complete and it should not be relied on as such, as this
document is for general guidance only. Angel Broking Pvt. Limited or any of its affiliates/ group companies shall not be in any way
responsible for any loss or damage that may arise to any person from any inadvertent error in the information contained in this report.
Angel Broking Pvt. Limited has not independently verified all the information contained within this document. Accordingly, we cannot
testify, nor make any representation or warranty, express or implied, to the accuracy, contents or data contained within this document.
While Angel Broking Pvt. Limited endeavors to update on a reasonable basis the information discussed in this material, there may be
regulatory, compliance, or other reasons that prevent us from doing so.
This document is being supplied to you solely for your information, and its contents, information or data may not be reproduced,
redistributed or passed on, directly or indirectly.
Neither Angel Broking Pvt. Limited, nor its directors, employees or affiliates shall be liable for any loss or damage that may arise from
or in connection with the use of this information.
Disclosure of Interest Statement
Bank Of Baroda
1. Financial interest of research analyst or Angel or his Associate or his relative
No
2. Ownership of 1% or more of the stock by research analyst or Angel or associates or relatives
No
3. Served as an officer, director or employee of the company covered under Research
No
4. Broking relationship with company covered under Research
No
Ratings (Based on expected returns
Buy (> 15%)
Accumulate (5% to 15%)
Neutral (-5 to 5%)
over 12 months investment period):
Reduce (-5% to -15%)
Sell (< -15)
February 15, 2017
9