3QFY2016 Result Update | Banking
January 22, 2016
Axis Bank
BUY
CMP
`409
Performance Highlights
Target Price
`531
Particulars (` cr)
3QFY16 2QFY16
% chg (qoq) 3QFY15
% chg (yoy)
Investment Period
12 Months
NII
4,162
4,062
2.5
3,590
15.9
Pre-prov. profit
3,985
3,628
9.8
3,315
20.2
Stock Info
PAT
2,175
1,916
13.6
1,900
14.5
Source: Company, Angel Research
Sector
Banking
Market Cap (` cr)
97,355
Axis Bank reported a positive set of numbers on the operating front for
Beta
1.4
3QFY2016 with PAT growing by 14.5% yoy to `2,175.3cr surpassing street as
well as our expectations. Asset quality deteriorated with surge in gross and net
52 Week High / Low
655/366
NPA ratios to 1.68% and 0.75% from 1.38% and 0.48% sequentially.
Avg. Daily Volume
11,062,658
Face Value (`)
2
Slippages at elevated levels; Advances growth remains healthy
BSE Sensex
23,962
During 3QFY2016, the bank reported an advance growth of 21.0% yoy, while
Nifty
7,277
deposits grew by 16.2% yoy. The retail book grew by 26.8% yoy and accounted
Reuters Code
AXBK.BO
for 40% of the advances. Overall, for the current financial year, the bank expects
Bloomberg Code
AXSB@IN
credit growth to be of around 20%.
The CASA ratio came in at 43.2%, declining by 100bp qoq, while it improved by
12bp on a yoy basis. The NIM declined by 6bp qoq and stood at 3.79% in spite
Shareholding Pattern (%)
of the cost of funds falling by 13bp qoq to 5.86%. The sequential decline of
29.6
Promoters
13bp in the bank’s cost of funds is primarily driven by moderation in the cost of
16.0
MF / Banks / Indian Fls
term deposits and further aided by the bank’s continued focus on CASA.
46.3
FII / NRIs / OCBs
Asset quality deteriorated with surge in Gross and Net NPA ratios to 1.68% and
Indian Public / Others
8.1
0.75% from 1.38% and 0.48% in the sequential previous quarter. Slippages
came in higher at `2,082cr, whereas the bank transferred 4 accounts worth
`1,600cr under 5/25 scheme and conducted strategic debt restructuring in 1
Abs. (%)
3m 1yr
3yr
account (which is a construction company) worth `500cr. The bank has stated
that it has taken into account the full impact of asset quality review conducted by the
Sensex
(12.2)
(17.1)
19.2
RBI, which accounted for ~50% of the total slippages for the quarter. The Management
Axis Bank
(20.0)
(25.2)
47.7
has guided for incremental slippages to the extent of `1,300cr for 4QFY2016.
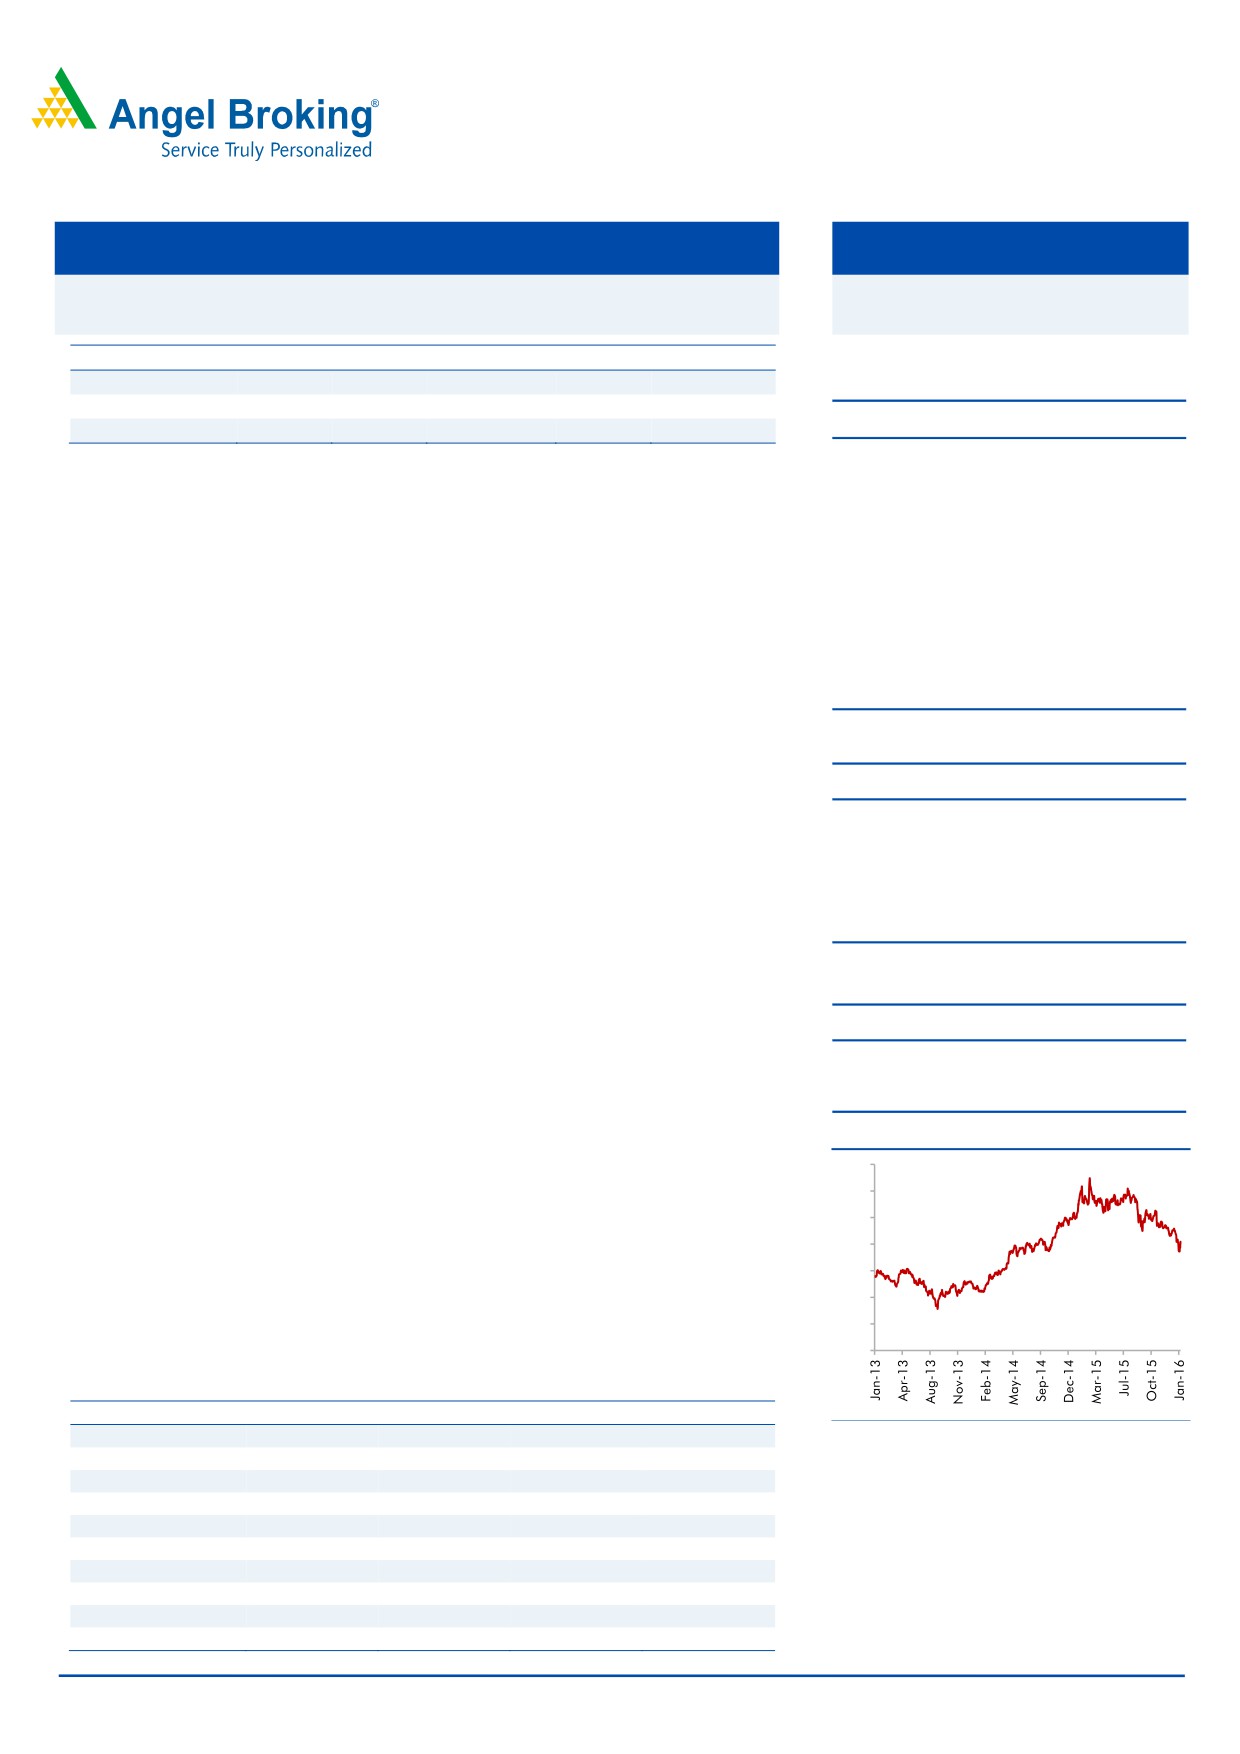
3-year price chart
Outlook and valuation: Healthy pace of branch expansion and a strong
700
distribution network continue to be the driving force for the bank’s retail
600
business. On the asset quality, the bank has fully recognized the necessary
500
impairment and the resultant provisioning impact of the asset reclassification as
400
per the RBI’s assessment in 3QFY2016 which provides comfort with respect to
300
the asset quality. However, the management remains cautious on its asset quality
200
outlook in the near term. The bank is positioned strongly to benefit once the
100
macros revive. The stock currently trades at 1.7x P/ABV FY2017E. We maintain
our Buy rating on the stock with a revised target price of `531.
0
Key financials (Standalone)
Y/E March (` cr)
FY2014
FY2015
FY2016E
FY2017E
Source: Company, Angel Research
NII
11,952
14,224
16,740
20,033
% chg
23.6
19.0
17.7
19.7
Net profit
6,218
7,358
8,472
10,309
% chg
20.0
18.3
15.1
21.7
NIM (%)
3.4
3.5
3.5
3.6
EPS (`)
26.5
31.0
35.7
43.5
P/E (x)
15.4
13.2
11.4
9.4
Vaibhav Agrawal
P/ABV (x)
2.5
2.2
1.9
1.7
RoA (%)
1.7
1.7
1.7
1.8
022 - 3935 7800 Ext: 6808
RoE (%)
17.4
17.9
17.9
18.9
Source: Company, Angel Research; Note: CMP as of January 21, 2016
Please refer to important disclosures at the end of this report
1
Axis Bank | 3QFY2016 Result Update
Exhibit 1: 3QFY2016 performance summary (Standalone)
Particulars (` cr)
3QFY16
2QFY16
% chg (qoq)
3QFY15
% chg (yoy)
FY2015
FY2014
% chg
Interest earned
10,193
9,960
2.3
8,890
14.7
35,479
30,641
15.8
- on Advances / Bills
7,529
7,344
2.5
6,502
15.8
25,868
21,950
17.8
- on investments
2,293
2,189
4.7
2,280
0.6
9,117
8,343
9.3
- on balance with RBI & others
69
92
(24.9)
54
27.6
231
167
38.7
- on others
302
335
(9.8)
54
458.6
262
181
45.1
Interest Expended
6,031
5,898
2.3
5,300
13.8
21,254
18,690
13.7
Net Interest Income
4,162
4,062
2.5
3,590
15.9
14,224
11,952
19.0
Other income
2,338
2,041
14.5
2,039
14.6
8,365
7,405
13.0
Other income excl. treasury
2,000
1,874
6.7
1,710
17.0
7,230
6,478
11.6
- Fee Income
1,885
1,813
4.0
1,686
11.8
6,779
5,985
13.3
- Trading gains
338
168
101.7
329
2.7
1,135
927
22.5
- Others
115
61
88.8
24
377.7
451
493
(8.5)
Operating income
6,500
6,103
6.5
5,629
15.5
22,589
19,357
16.7
Operating expenses
2,515
2,476
1.6
2,314
8.7
9,204
7,901
16.5
- Employee expenses
830
829
0.0
778
6.6
3,115
2,601
19.7
- Other Opex
1,685
1,646
2.4
1,536
9.7
6,089
5,299
14.9
Pre-provision Profit
3,985
3,628
9.8
3,315
20.2
13,385
11,456
16.8
Provisions & Contingencies
713
707
0.8
507
40.5
2,329
2,107
10.5
- Provisions for NPAs
626
634
(1.3)
363
72.5
1,707
1,295
31.8
- Other Provisions
87
73
18.6
144
(39.9)
622
812
(23.5)
PBT
3,272
2,921
12.0
2,807
16.6
11,057
9,349
18.3
Provision for Tax
1,097
1,005
9.2
908
20.9
3,699
3,131
18.1
PAT
2,175
1,916
13.6
1,900
14.5
7,358
6,218
18.3
Source: Company, Angel Research
January 22, 2016
2
Axis Bank | 3QFY2016 Result Update
Exhibit 2: 3QFY2016 performance analysis (Standalone)
Particulars
3QFY16
2QFY16
% chg (qoq) 3QFY15
% chg (yoy)
Balance sheet
Advances (` cr)
3,15,367 2,98,066
5.8
2,60,567
21.0
Deposits (` cr)
3,38,343 3,24,101
4.4
2,91,199
16.2
Credit-to-Deposit Ratio (%)
93.2
92.0
124bp
89.5
373bp
Current deposits (` cr)
53,564
53,691
(0.2)
45,633
17.4
Saving deposits (` cr)
92,758
89,717
3.4
79,953
16.0
CASA deposits (` cr)
1,46,322 1,43,408
2.0
1,25,586
16.5
CASA ratio (%)
43.2
44.2
(100)bp
43.1
12bp
CAR (%)*
15.5
15.4
5bp
15.6
(17)bp
Tier 1 CAR (%)*
12.4
12.2
14bp
12.4
(9)bp
Profitability Ratios (%)
Cost of funds
5.9
6.0
(13)bp
6.2
(31)bp
Reported NIM
3.8
3.9
(6)bp
3.9
(14)bp
Cost-to-income ratio
38.7
40.6
(187)bp
41.1
(242)bp
Asset quality
Gross NPAs (` cr)
5,724
4,451
28.6
3,902
46.7
Gross NPAs (%)
1.7
1.4
30bp
1.3
34bp
Net NPAs (` cr)
2,514
1,544
62.9
1,251
101.0
Net NPAs (%)
0.8
0.5
27bp
0.4
31bp
Provision Coverage Ratio (%)
72.0
78.0
(600)bp
78.0
(600)bp
Slippage ratio (%)
3.0
0.8
213bp
1.2
173bp
Loan loss prov. to avg. assets (%)
0.5
0.6
(3)bp
0.4
17bp
Source: Company, Angel Research *Basel III excluding profits
Advances growth remains healthy; NIM declines qoq
During 3QFY2016, the bank reported an advance growth of 21.0% yoy, while
deposits grew by 16.2% yoy. The bank’s loan book growth outpaced industry loan
growth, primarily due to strong traction witnessed in the retail and corporate book.
The retail book grew by 26.8% yoy and accounted for 40% of the advances. The
corporate loan book, which constitutes 47% of the total advance book, increased
by 22.1% yoy, mainly on account of refinancing and non-rupee financing; ~80%
of the new sanctions in the corporate book for the quarter were to companies
rated “A‟ and above. Overall, for the current financial year, the bank expects
credit growth to be of around 20%.
The CASA ratio came in at 43.2%, declining by 100bp qoq, while it improved by
12bp on a yoy basis. The NIM declined by 6bp qoq and stood at 3.79% in spite of
the cost of funds falling by 13bp qoq to 5.86%. The sequential decline of 13bp in
the bank’s cost of funds is primarily driven by moderation in the cost of term
deposits and further aided by the bank’s continued focus on CASA. The bank
continues to maintain its outlook of sustainable core margins at 3.5%. The
Cost-Income ratio of the bank stood at 39%, largely on the back of controlled
growth in expenses. On a full year basis, the bank expects its Cost-Income ratio to
be around 40%.
January 22, 2016
3
Axis Bank | 3QFY2016 Result Update
Exhibit 3: CASA balances grew at 14% yoy
Exhibit 4: Period-end CASA ratio at 43.2%
20
Reported yoy growth in average CASA balances (%)
(%)
46.0
44.8
16
44.2
15
43.1
43.2
44.0
42.8
14
14
15
13
42.0
40.0
10
38.0
36.0
5
34.0
32.0
0
30.0
3QFY15
4QFY15
1QFY16
2QFY16
3QFY16
3QFY15
4QFY15
1QFY16
2QFY16
3QFY16
Source: Company, Angel Research
Source: Company, Angel Research
Exhibit 5: Cost of funds declines qoq
Exhibit 6: NIM at 3.79%
Reported NIMs (%)
Cost of funds (%)
(%)
4.5
6.17
6.26
6.12
6.50
5.99
4.2
5.86
3.93
6.00
3.85
3.81
3.80
3.79
4.0
3.9
5.50
3.6
3.5
5.00
3.3
4.50
3.0
3.0
4.00
2.5
3.50
2.7
3.93
3.81
3.80
3.85
3.79
2.0
3.00
2.4
3QFY15
4QFY15
1QFY16
2QFY16
3QFY16
3QFY15
4QFY15
1QFY16
2QFY16
3QFY16
Source: Company, Angel Research
Source: Company, Angel Research
Steady growth in other income (excluding treasury)
Other income (comprising fee, trading profit and miscellaneous
income) for
3QFY2016 grew by 14.6% yoy to `2,338cr as against `2,039cr during the same
period last year. During the quarter, fee income grew 12% yoy to `1,885cr. The
key driver to growth in fee income was retail banking, which grew by 14% yoy and
constituted 40% of the Bank’s total fee income. Transaction banking fees grew 9%
yoy and constituted 20% of the total fee income. Treasury & DCM fee performance
was robust and grew 15% yoy and constituted 10% of the total fee income of the
bank for the quarter. The Management reiterated that the fee income would grow
in mid-teens in FY2016.
January 22, 2016
4
Axis Bank | 3QFY2016 Result Update
Slippages at elevated levels
Asset quality deteriorated with surge in Gross and Net NPA ratios to 1.68% and
0.75% from 1.38% and 0.48% in the sequential previous quarter. Slippages came
in higher at `2,082cr, whereas the bank transferred 4 accounts worth `1,600cr
under 5/25 scheme and conducted strategic debt restructuring in 1 account (which
is a construction company) worth `500cr. The bank has stated that it has taken
into account the full impact of asset quality review conducted by the RBI, which
accounted for ~50% of the total slippages for the quarter. Provisions for the bank
surged 40.5% yoy whereas on a qoq basis, it increased marginally by 0.8%. The
Management has guided for incremental slippages to the extent of `1,300cr for
4QFY2016. The Management has also stated that the bank’s funded exposure to
highly leveraged groups has been stable at around 8% as at the end of
3QFY2016.
Exhibit 7: Slippages ratio jumps qoq and yoy
Exhibit 8: Trend in NPA ratios
(%)
Gross NPAs (%)
Net NPAs (%)
NPA coverage (%, RHS)
3.20
2.96
1.8
82.50
2.80
1.6
78
78
78
78
1.4
2.40
1.2
2.00
1.69
1
1.60
75.00
1.23
0.8
1.20
1.06
72
0.83
0.6
0.80
0.4
0.40
0.2
-
0
67.50
3QFY15
4QFY15
1QFY16
2QFY16
3QFY16
3QFY15
4QFY15
1QFY16
2QFY16
3QFY16
Source: Company, Angel Research
Source: Company, Angel Research; Note: PCR including tech. write-offs
Exhibit 9: Steady network expansion continues
Exhibit 10: Cost-to-income ratio at 38.7%
Branches
ATMs (RHS)
Staff costs (` cr)
Other opex (` cr)
CIR (%, RHS)
3200
15000
1,250
48.0
12,874
12,179
12,352
12,355
12,352
2800
12500
1,000
44.0
2400
43.5
10000
750
39.6
42.1
2000
42.2
41.1
38.1
40.0
7500
500
40.6
1600
38.7
35.6
36.0
5000
250
1200
2500
-
32.0
800
400
0
3QFY15
4QFY15
1QFY16
2QFY16
3QFY16
Source: Company, Angel Research;
Source: Company, Angel Research
January 22, 2016
5
Axis Bank | 3QFY2016 Result Update
Outlook and valuation: Healthy pace of branch expansion and a strong
distribution network continue to be the driving force for the bank’s retail business.
On the asset quality, the bank has fully recognized the necessary impairment and
the resultant provisioning impact of the asset reclassification as per the RBI’s
assessment in 3QFY2016 which provides comfort with respect to the asset quality.
However, the management remains cautious on its asset quality outlook in the
near term. The bank is positioned strongly to benefit once the macros revive. The
stock currently trades at 1.7x P/ABV FY2017E. We maintain our Buy rating on the
stock with a revised target price of `531.
Exhibit 11: Recommendation summary
CMP
Tgt. Price
Upside
FY2017E
FY2017E
FY2017E
FY15-17E
FY2017E
FY2017E
Company
Reco.
(`)
(`)
(%)
P/ABV (x)
Tgt. P/ABV (x)
P/E (x)
EPS CAGR (%)
RoA (%)
RoE (%)
HDFCBk
Buy
1,024
1,262
23.3
3.1
3.8
16.8
22.4
1.9
19.7
ICICIBk*
Buy
226
304
34.4
1.5
1.7
9.3
13.5
1.6
14.7
YesBk
Buy
654
825
26.1
1.7
2.2
9.4
20.5
1.6
19.6
AxisBk
Buy
409
531
29.8
1.7
2.2
9.4
18.4
1.8
18.9
SBI*
Buy
176
237
34.5
0.8
1.0
7.2
17.8
0.7
12.8
FedBk
Neutral
48
-
-
0.9
0.9
8.6
(2.9)
0.9
10.8
SIB
Neutral
18
-
-
0.7
0.7
5.5
21.6
0.7
11.6
BOB
Neutral
125
-
-
0.6
0.7
5.9
17.5
0.6
10.6
PNB
Neutral
89
-
-
0.4
0.4
3.3
28.5
0.7
12.0
BOI
Neutral
95
-
-
0.2
0.7
2.9
14.0
0.3
7.6
IndBk
Neutral
89
-
-
0.3
0.2
3.0
19.4
0.6
8.6
Vijaya Bank
Neutral
30
-
-
0.4
0.3
4.5
14.1
0.4
8.8
OBC
Neutral
105
-
-
0.2
0.3
2.3
65.5
0.5
9.4
Allahabad Bank Neutral
51
-
-
0.2
0.2
1.9
56.2
0.6
11.9
UnionBk
Neutral
114
-
-
0.3
0.3
2.9
18.1
0.6
11.4
CanBk
Neutral
175
-
-
0.3
0.2
2.5
12.0
0.6
11.2
AllBk
Neutral
51
-
-
0.2
0.3
1.9
56.2
0.6
11.9
IDBI#
Neutral
58
-
-
0.4
0.5
4.0
61.6
0.6
9.3
Source: Company, Angel Research; Note:*Target multiples=SOTP Target Price/ABV (including subsidiaries), #Without adjusting for SASF
Company Background
Axis Bank is India's third-largest private sector bank after ICICI Bank and HDFC
Bank. The bank is promoted by government institutions, led by UTI (SUUTI
currently holds 12% stake in the bank). The bank has an extensive network of
2,743 branches and 12,352 ATMs spread across 1,796 centers (~51% in metro
and urban regions). The bank's strong growth has been backed by robust retail
branch expansion, strong corporate relationships and a wide range of fee income
products.
January 22, 2016
6
Axis Bank | 3QFY2016 Result Update
Income statement (Standalone)
Y/E March (` cr)
FY11
FY12
FY13
FY14
FY15
FY16E
FY17E
Net Interest Income
6,563
8,018
9,666
11,952
14,224
16,740
20,033
- YoY Growth (%)
31.1
22.2
20.6
23.6
19.0
17.7
19.7
Other Income
4,632
5,420
6,551
7,405
8,365
9,733
11,493
- YoY Growth (%)
17.4
17.0
20.9
13.0
13.0
16.3
18.1
Operating Income
11,195
13,438
16,217
19,357
22,589
26,473
31,527
- YoY Growth (%)
25.1
20.0
20.7
19.4
16.7
17.2
19.1
Operating Expenses
4,779
6,007
6,914
7,901
9,204
10,354
12,270
- YoY Growth (%)
28.8
25.7
15.1
14.3
16.5
12.5
18.5
Pre - Provision Profit
6,416
7,431
9,303
11,456
13,385
16,118
19,257
- YoY Growth (%)
22.4
15.8
25.2
23.1
16.8
20.4
19.5
Prov. & Cont.
1,280
1,143
1,750
2,107
2,329
3,162
3,491
- YoY Growth (%)
(7.9)
(10.7)
53.1
20.4
10.5
35.8
10.4
Profit Before Tax
5,136
6,288
7,553
9,349
11,057
12,956
15,765
- YoY Growth (%)
33.3
22.4
20.1
23.8
18.3
17.2
21.7
Prov. for Taxation
1,747
2,046
2,373
3,131
3,699
4,484
5,456
- as a % of PBT
34.0
32.5
31.4
33.5
33.5
34.6
34.6
PAT
3,388
4,242
5,179
6,218
7,358
8,472
10,309
- YoY Growth (%)
34.8
25.2
22.1
20.0
18.3
15.1
21.7
Balance sheet (Standalone)
Y/E March (` cr)
FY11
FY12
FY13
FY14
FY15
FY16E
FY17E
Share Capital
411
413
468
470
474
474
474
Reserve & Surplus
18,588
22,395
32,640
37,751
43,463
50,039
58,061
Deposits
1,89,238
2,20,104
2,52,614
2,80,945
3,22,442
3,80,481
4,67,992
- Growth (%)
33.9
16.3
14.8
11.2
14.8
18.0
23.0
Borrowings
19,275
23,498
31,412
37,886
64,872
47,496
56,951
Tier 2 Capital
6,993
10,574
12,540
12,405
14,886
14,514
14,151
Other Liab. & Prov.
8,209
8,643
10,888
13,789
15,795
17,709
21,407
Total Liabilities
2,42,713
2,85,628
3,40,561
3,83,245
4,61,932
5,10,713
6,19,037
Cash Balances
13,886
10,703
14,792
17,041
19,819
19,024
23,400
Bank Balances
7,522
3,231
5,643
11,197
16,280
17,999
21,817
Investments
71,992
93,192
1,13,738
1,13,548
1,32,343
1,17,134
1,35,599
Advances
1,42,408
1,69,760
1,96,966
2,30,067
2,81,083
3,42,921
4,21,793
- Growth (%)
36.5
19.2
16.0
16.8
22.2
22.0
23.0
Fixed Assets
2,273
2,259
2,356
2,410
2,514
2,696
3,170
Other Assets
4,632
6,483
7,067
8,981
9,893
10,938
13,258
Total Assets
2,42,713
2,85,628
3,40,561
3,83,245
4,61,932
5,10,713
6,19,037
- Growth (%)
34.4
17.7
19.2
12.5
20.5
10.6
21.2
January 22, 2016
7
Axis Bank | 3QFY2016 Result Update
Ratio analysis (Standalone)
Y/E March
FY11
FY12
FY13
FY14
FY15
FY16E
FY17E
Profitability ratios (%)
NIMs
3.2
3.1
3.2
3.4
3.5
3.5
3.6
Cost to Income Ratio
42.7
44.7
42.6
40.8
40.7
39.1
38.9
RoA
1.6
1.6
1.7
1.7
1.7
1.7
1.8
RoE
19.3
20.3
18.5
17.4
17.9
17.9
18.9
B/S ratios (%)
CASA Ratio
41.1
41.5
44.4
45.0
44.8
45.5
45.2
Credit/Deposit Ratio
75.3
77.1
78.0
81.9
87.2
90.1
90.1
CAR
12.7
13.7
17.0
16.3
16.0
16.1
15.0
- Tier I
9.4
9.4
12.2
12.8
12.2
12.7
12.1
Asset Quality (%)
Gross NPAs
1.1
1.1
1.2
1.4
1.4
2.1
2.6
Net NPAs
0.3
0.3
0.4
0.4
0.5
0.5
0.7
Slippages
1.4
1.3
1.2
1.3
1.2
1.5
1.4
Loan Loss Prov. /Avg. Assets
0.5
0.3
0.4
0.4
0.5
0.5
0.5
Provision Coverage
74.3
73.8
70.6
77.2
68.0
75.0
75.0
Per Share Data (`)
EPS
16.5
20.5
22.1
26.5
31.0
35.7
43.5
ABVPS (75% cover.)
92.5
110.3
141.0
161.7
184.1
213.1
246.9
DPS
2.8
3.2
3.6
4.0
5.9
6.8
8.2
Valuation Ratios
PER (x)
24.8
19.9
18.5
15.4
13.2
11.4
9.4
P/ABVPS (x)
4.4
3.7
2.9
2.5
2.2
1.9
1.7
Dividend Yield
0.7
0.8
0.9
1.0
1.4
1.7
2.0
DuPont Analysis
NII
3.1
3.0
3.1
3.3
3.4
3.4
3.5
(-) Prov. Exp.
0.6
0.4
0.6
0.6
0.6
0.7
0.6
Adj. NII
2.5
2.6
2.5
2.7
2.8
2.8
2.9
Treasury
0.2
0.0
0.2
0.1
0.3
0.3
0.2
Int. Sens. Inc.
2.7
2.6
2.7
2.8
3.1
3.1
3.2
Other Inc.
2.0
2.0
1.9
2.0
1.7
1.7
1.8
Op. Inc.
4.7
4.7
4.6
4.8
4.8
4.8
5.0
Opex
2.3
2.3
2.2
2.2
2.2
2.1
2.2
PBT
2.4
2.4
2.4
2.6
2.6
2.7
2.8
Taxes
0.8
0.8
0.8
0.9
0.9
0.9
1.0
RoA
1.6
1.6
1.7
1.7
1.7
1.7
1.8
Leverage
12.1
12.6
11.2
10.1
10.3
10.3
10.4
RoE
19.3
20.3
18.5
17.4
17.9
17.9
18.9
January 22, 2016
8
Axis Bank | 3QFY2016 Result Update
Research Team Tel: 022 - 39357800
DISCLAIMER
Angel Broking Private Limited (hereinafter referred to as “Angel”) is a registered Member of National Stock Exchange of India Limited,
Bombay Stock Exchange Limited and Metropolitan Stock Exchange of India Limited. It is also registered as a Depository Participant with
CDSL and Portfolio Manager with SEBI. It also has registration with AMFI as a Mutual Fund Distributor. Angel Broking Private Limited is
a registered entity with SEBI for Research Analyst in terms of SEBI (Research Analyst) Regulations, 2014 vide registration number
INH000000164. Angel or its associates has not been debarred/ suspended by SEBI or any other regulatory authority for accessing
/dealing in securities Market. Angel or its associates including its relatives/analyst do not hold any financial interest/beneficial
ownership of more than 1% in the company covered by Analyst. Angel or its associates/analyst has not received any compensation /
managed or co-managed public offering of securities of the company covered by Analyst during the past twelve months. Angel/analyst
has not served as an officer, director or employee of company covered by Analyst and has not been engaged in market making activity
of the company covered by Analyst.
This document is solely for the personal information of the recipient, and must not be singularly used as the basis of any investment
decision. Nothing in this document should be construed as investment or financial advice. Each recipient of this document should
make such investigations as they deem necessary to arrive at an independent evaluation of an investment in the securities of the
companies referred to in this document (including the merits and risks involved), and should consult their own advisors to determine
the merits and risks of such an investment.
Reports based on technical and derivative analysis center on studying charts of a stock's price movement, outstanding positions and
trading volume, as opposed to focusing on a company's fundamentals and, as such, may not match with a report on a company's
fundamentals.
The information in this document has been printed on the basis of publicly available information, internal data and other reliable
sources believed to be true, but we do not represent that it is accurate or complete and it should not be relied on as such, as this
document is for general guidance only. Angel Broking Pvt. Limited or any of its affiliates/ group companies shall not be in any way
responsible for any loss or damage that may arise to any person from any inadvertent error in the information contained in this report.
Angel Broking Pvt. Limited has not independently verified all the information contained within this document. Accordingly, we cannot
testify, nor make any representation or warranty, express or implied, to the accuracy, contents or data contained within this document.
While Angel Broking Pvt. Limited endeavors to update on a reasonable basis the information discussed in this material, there may be
regulatory, compliance, or other reasons that prevent us from doing so.
This document is being supplied to you solely for your information, and its contents, information or data may not be reproduced,
redistributed or passed on, directly or indirectly.
Neither Angel Broking Pvt. Limited, nor its directors, employees or affiliates shall be liable for any loss or damage that may arise from
or in connection with the use of this information.
Note: Please refer to the important ‘Stock Holding Disclosure' report on the Angel website (Research Section). Also, please refer to the
latest update on respective stocks for the disclosure status in respect of those stocks. Angel Broking Pvt. Limited and its affiliates may
have investment positions in the stocks recommended in this report.
Disclosure of Interest Statement
Axis Bank
1. Analyst ownership of the stock
No
2. Angel and its Group companies ownership of the stock
No
3. Angel and its Group companies' Directors ownership of the stock
Yes
4. Broking relationship with company covered
No
Note: We have not considered any Exposure below ` 1 lakh for Angel, its Group companies and Directors
Ratings (Based on expected returns
Buy (> 15%)
Accumulate (5% to 15%)
Neutral (-5 to 5%)
over 12 months investment period):
Reduce (-5% to -15%)
Sell (< -15)
January 22, 2016
9