2QFY2016 Result Update | Pharmaceutical
November 18, 2015
Aurobindo Pharma
ACCUMULATE
CMP
`830
Performance Highlights
Target Price
`872
Y/E march (` cr)
2QFY16 1QFY16
% chg (qoq) 2QFY15
% chg (yoy)
Investment Period
12 months
Net sales
3280
3320
(1.2)
2862
14.6
Other income
65
29
123.4
46
40.4
Stock Info
Operating profit
722
725
(0.3)
618
16.8
Interest
82
21
293.0
21
290.9
Sector
Pharmaceutical
Adj. Net profit
451
451
0.0
383
17.5
Market Cap (` cr)
48,457
Source: Company, Angel Research
Net debt (` cr)
3,375
For 2QFY2016, Aurobindo Pharma (APL) posted a decent set of results. The
Beta
1.2
company posted a sale of `3,280cr (v/s `3,320cr expected), a growth of 14.6%
52 Week High / Low
861/491
yoy. Sales were driven by formulations (which constitute around 79.5% of sales),
Avg. Daily Volume
136,773
which grew by 19.9% yoy. The key formulation segments like US, Europe &
Face Value (`)
1
ROW, and ARV posted a yoy growth of 25.8%, 1.0% and 95.0% respectively. The
BSE Sensex
25,611
API, on the other hand, grew by 0.9% yoy. The OPM for the quarter stood at 22.0%
Nifty
7,762
(v/s 21.8% expected), ie a yoy expansion of 42bp. The Adj. Net profit for the quarter
Reuters Code
ARBN.BO
came in at `451cr V/s `383cr in 2QFY2015, a yoy growth of 17.5%. We recommend
Bloomberg Code
ARBP@IN
an Accumulate rating on the stock.
Mostly in line numbers: For 2QFY2016, APL posted a decent set of results. The
Shareholding Pattern (%)
company posted a sale of `3,280cr (v/s `3,320cr expected), a growth of 14.6%
Promoters
53.9
yoy. Sales were driven by formulations (which constitute around 79.5% of sales),
MF / Banks / Indian Fls
7.9
which grew by 19.9% yoy. The key formulation segments like US, Europe &
FII / NRIs / OCBs
29.4
ROW, and ARV posted a yoy growth of 25.8%, 1.0% and 95.0% respectively. The
Indian Public / Others
8.8
API, on the other hand, grew by 0.9% yoy. The OPM for the quarter stood at 22.0%
(v/s 21.8% expected), ie a yoy expansion of 42bp. The Adj. Net profit for the quarter
came in at `451cr V/s `383cr in 2QFY2015, a yoy growth of 17.5%.
Abs. (%)
3m 1yr
3yr
Outlook and valuation: We estimate the company’s net sales to log a 12.5%
Sensex
(7.0)
(8.3)
37.6
CAGR over FY2015-17E to `17,162cr on back of US formulations, which will be
Aurobindo
12.7
50.9
831.0
supplemented through the recent acquisitions of the Western European
formulation businesses of Actavis and US’ Natrol. The acquisitions have also led
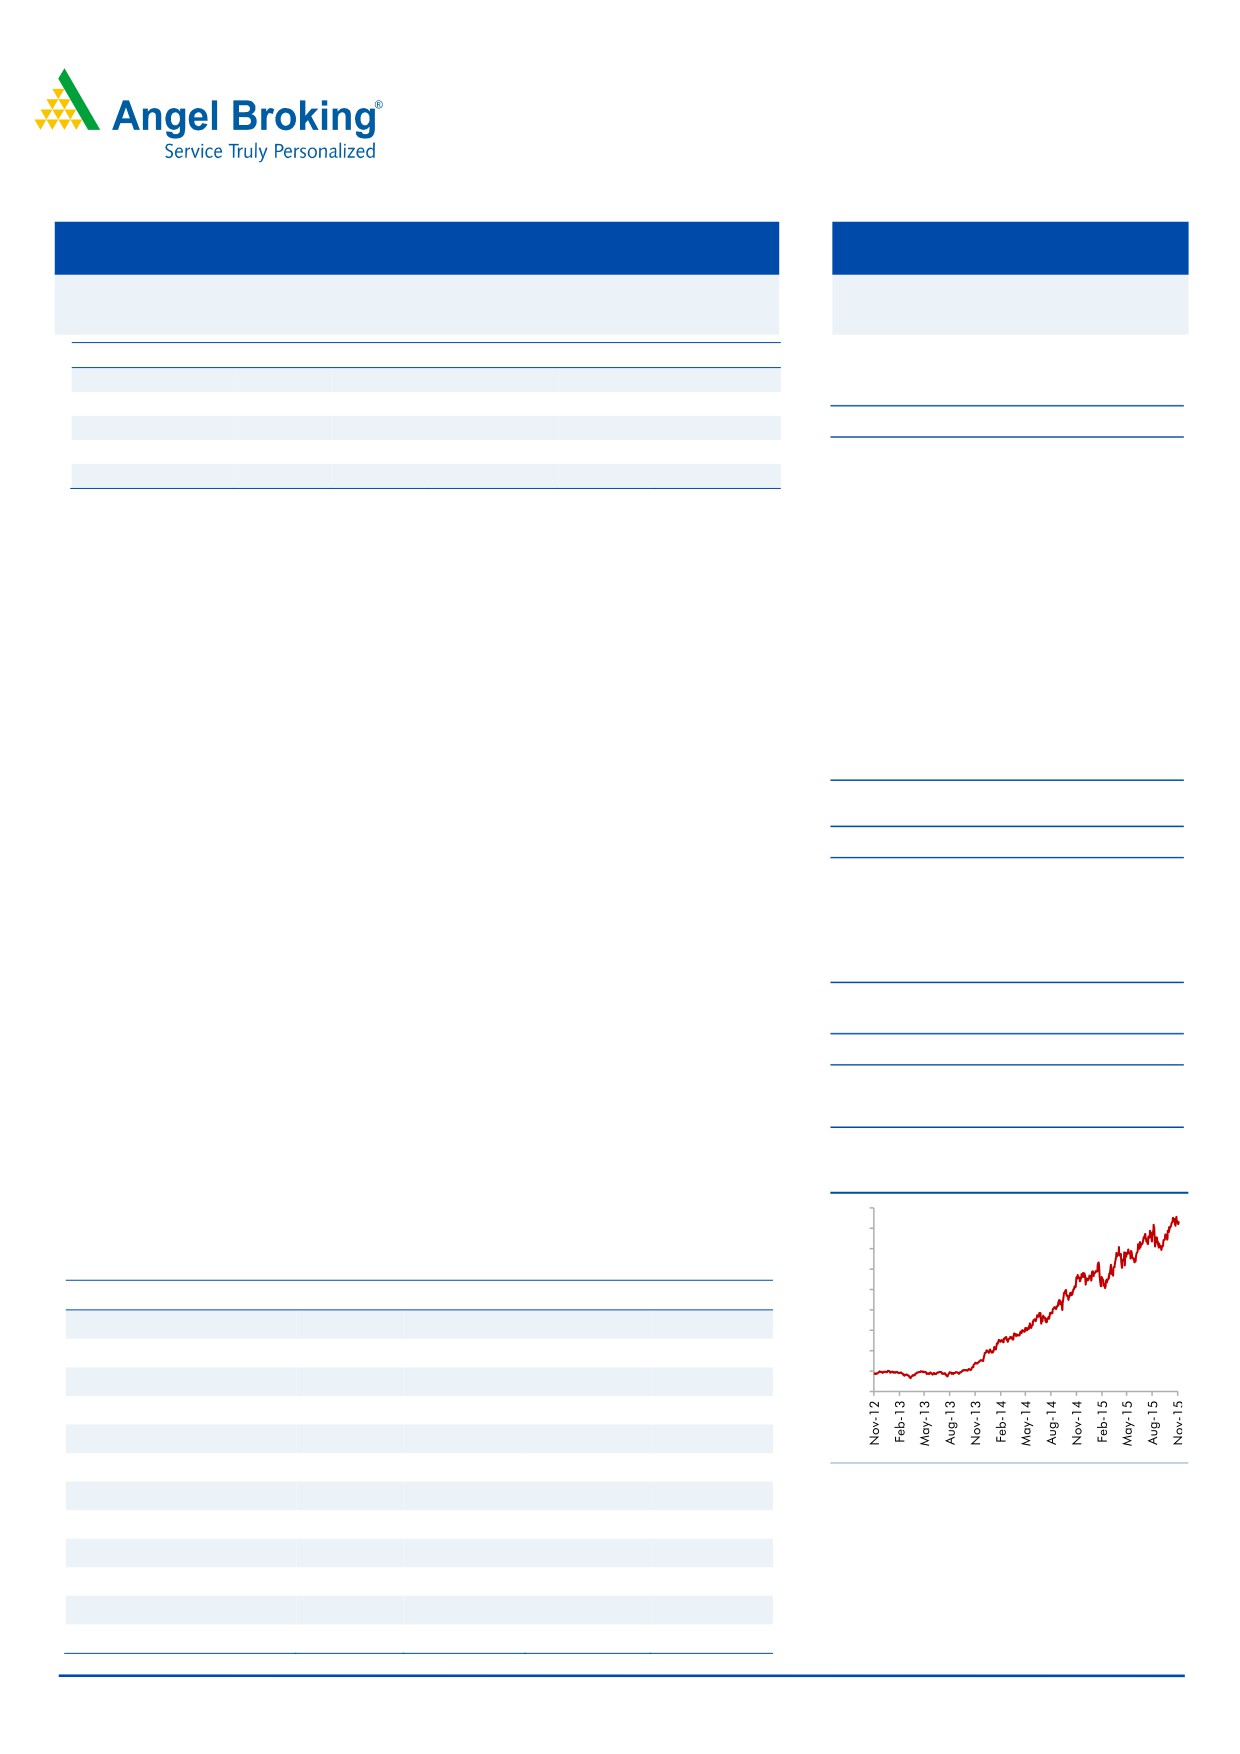
3-year daily price chart
APL to become a >~US$2bn sales company, with ~80% of sales being
900
accounted by formulations. We recommend an Accumulate on the stock.
800
700
Key financials (Consolidated)
600
500
Y/E March (` cr)
FY2014
FY2015
FY2016E
FY2017E
400
Net sales
8,038
12,043
14,923
17,162
300
% chg
39.0
49.8
23.9
15.0
200
100
Adj. Net profit
1,333
1,619
2,084
2,498
0
% chg
208.6
21.5
28.7
19.9
EPS (`)
22.8
27.7
35.7
42.8
EBITDA margin (%)
25.8
20.6
22.0
23.0
SourcSource: Company, Angel Research
P/E (x)
36.4
29.9
23.3
19.4
RoE (%)
41.9
36.4
34.0
30.2
RoCE (%)
25.4
25.3
24.9
23.5
P/BV (x)
6.4
4.7
6.8
5.1
Sarabjit Kour Nangra
EV/Sales (x)
3.5
2.3
3.6
3.1
+91 22 3935 7800 Ext: 6806
EV/EBITDA (x)
13.4
11.1
16.5
13.4
Source: Company, Angel Research; Note: CMP as of November 13, 2015
Please refer to important disclosures at the end of this report
1
Aurobindo Pharma | 2QFY2016 Result Update
Exhibit 1: 2QFY2016 performance (Consolidated)
Y/E March (` cr)
2QFY2016 1QFY2016
% chg (qoq) 2QFY2015
% chg (yoy) 1HFY2016 1HFY2015
% chg (yoy)
Net sales
3,280
3,320
(1.2)
2,862
14.6
6,600
5,757
14.7
Other income
65
29
123.4
46
40.4
94
74
27.2
Total income
3,345
3,349
(0.1)
2,909
15.0
6,695
5,831
14.8
Gross profit
1,811
1,813
(0.1)
1,598
13.4
3,624
3,111
16.5
Gross margins
55.2
54.6
55.8
54.9
54.0
1.6
Operating profit
722
725
(0.3)
618
16.8
1,447
1,260
14.8
OPM (%)
22.0
21.8
21.6
21.9
21.9
Interest
82
21
293.0
21
290.9
103
40
157.1
Dep & amortisation
93
89
4.1
90
3.2
182
181
0.5
PBT
613
644
(4.9)
554
10.6
1,256
1,113
12.9
Provision for taxation
162
187
(13.0)
140
15.5
349
287
21.5
Net profit
450
457
(1.5)
413
9.0
908
826
9.9
Less : Exceptional items (gains)/loss
(1)
26
42
24
43
(43.9)
MI & share in associates
-
1
-
-
1
2
-
PAT after Exceptional items
452
432
4.5
372
21.4
884
788
12.3
Adjusted PAT
451
451
0.0
383
17.5
900
820
9.8
EPS (`)
15.5
15.5
13.2
30.9
28.2
Source: Company, Angel Research
Exhibit 2: Actual v/s Estimate
(` cr)
Actual
Estimate
Variation %
Net sales
3280
3320
(1.2)
Other operating income
65.0
29
123.4
Operating profit
722
725
(0.3)
Tax
162
176
(7.7)
Adj. Net profit
451
478
(5.6)
Source: Company, Angel Research
Revenue up 14.6% yoy; marginally lower than our expectation: For 2QFY2016,
APL posted a decent set of results. The company posted a sale of `3,280cr (v/s
`3,320cr expected), a growth of 14.6% yoy. Sales were driven by formulations
(which constitute around 79.5% of sales), which grew by 19.9% yoy. The key
formulation segments like US, Europe & ROW, and ARV posted a yoy growth of
25.8%, 1.0% and 95.0% respectively. The API, on the other hand, grew by
0.9% yoy.
In the formulation segment, the US (`1,478cr) posted a yoy growth of 25.8%,
while Europe & ROW (`932cr) posted a yoy growth of 1.0%. ARV (`271cr) posted
a yoy growth of 95.0%. In the API segment, the Non-Betalactum segment
registered a growth of 12.2% yoy. The SSPs segment de-grew by 7.9% yoy while
the Cephs segment posted a de-growth of 2.3% yoy.
Overall, formulations now contribute around 79.5% of sales, while APIs contribute
the balance around 20.5% of sales. As of end-Sept 2015, the company has
214 approved ANDAs including 28 tentative approvals. During 2QFY2016, 3
ANDAs were filed, taking the cumulative filing to 382.
November 18, 2015
2
Aurobindo Pharma | 2QFY2016 Result Update
Exhibit 3: Sales break-up (Consolidated)
(` cr)
2QFY2016
1QFY2016
% chg (qoq) 2QFY2015
% chg (yoy)
1HFY2016
1HFY2015
% chg
Formulations
2681
2637
1.6
2237
19.9
5318
4512
17.8
US
1478
1430
3.4
1174
25.8
2907
2290
26.9
Europe & ROW
932
912
2.2
923
1.0
1845
1859
(0.8)
ARV
271
295
(8.3)
139
95.0
566
363
55.9
API
691
723
(4.4)
685
0.9
1414
1355
4.3
SSP
198
217
(8.5)
215
(7.9)
415
454
(8.6)
Cephs
229
261
(12.2)
235
(2.3)
491
447
9.8
NPNC
264
245
7.5
235
12.2
509
455
11.8
Source: Company, Angel Research
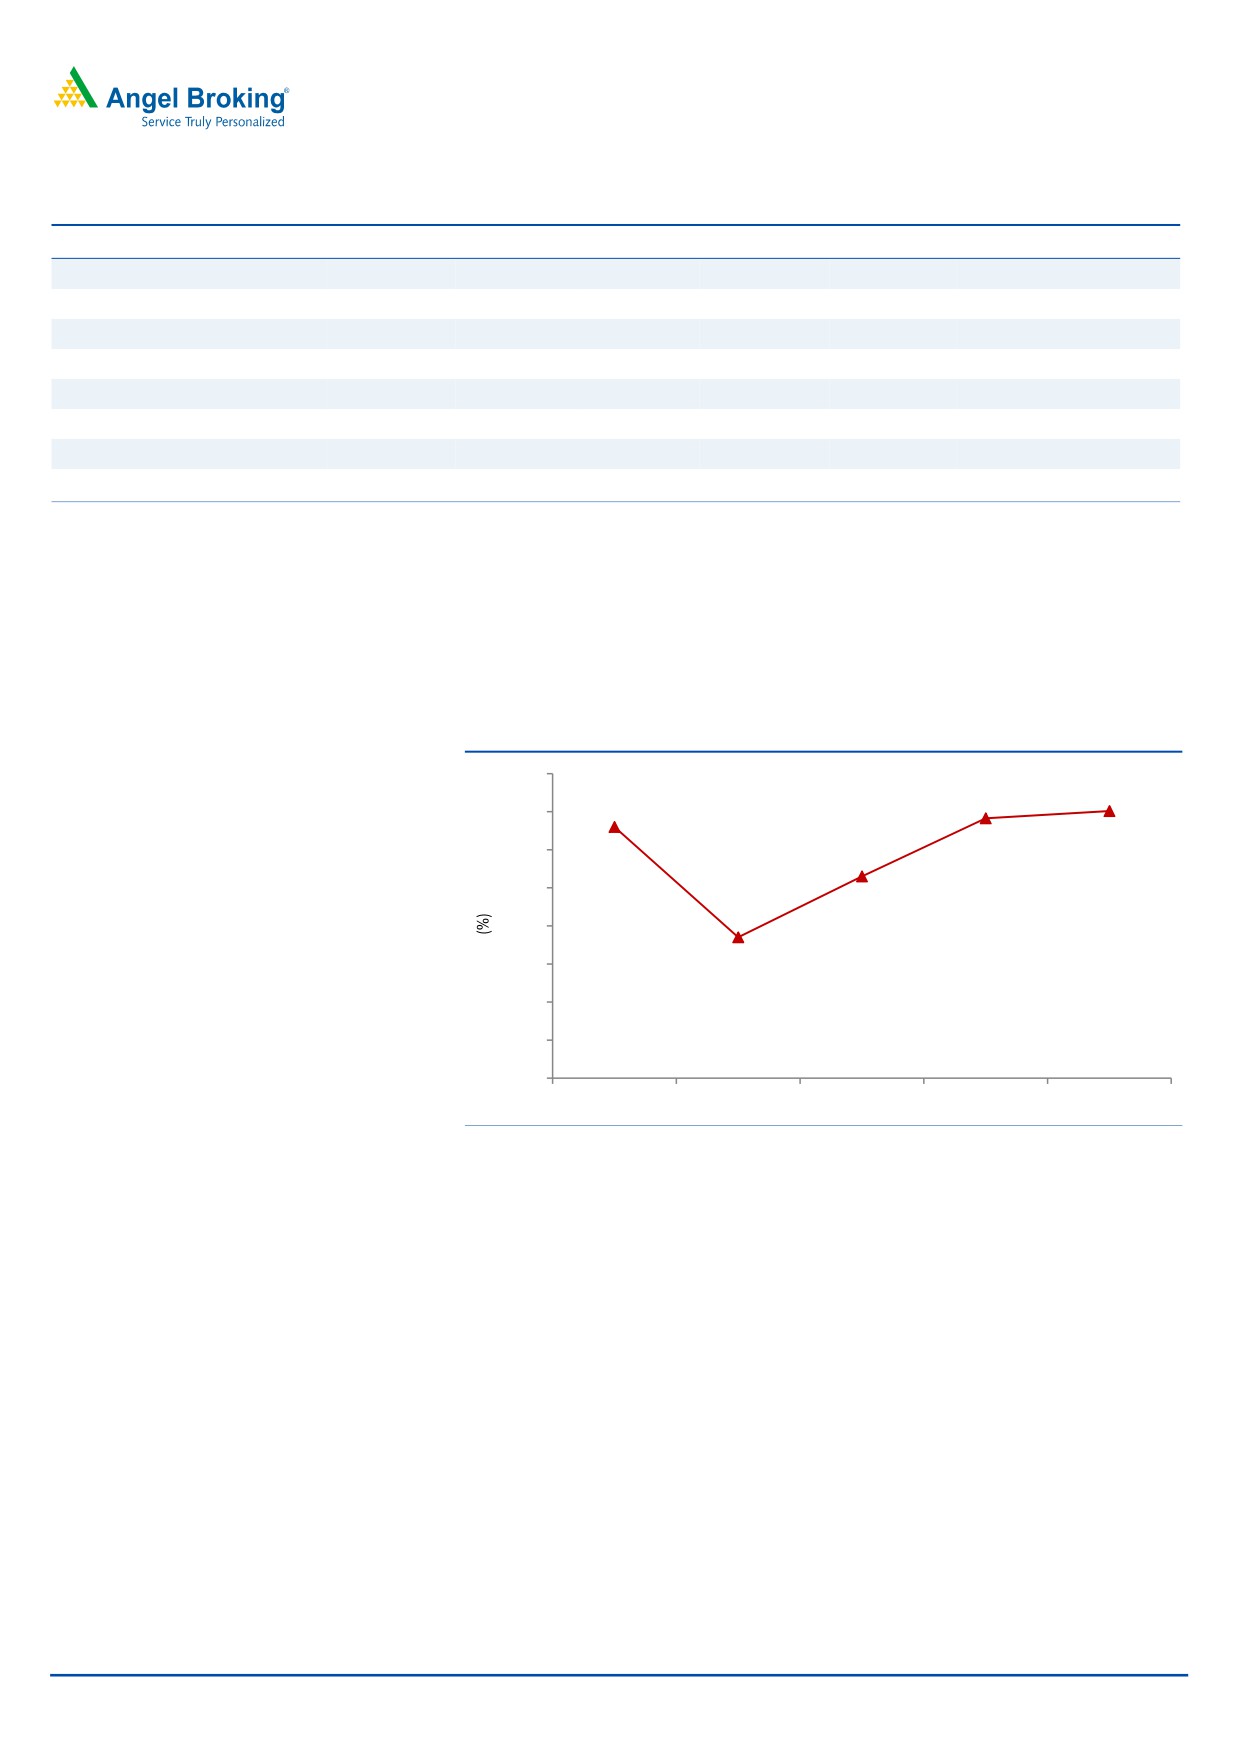
OPM expands to 22.0%, but better than expected: The OPM for the quarter stood
at 22.0% (V/s 21.8% expected), a yoy expansion of 42bp. The gross margin came
in at 55.2% V/s 55.8% in 2QFY2015; however, on back of employee costs
(+11.6% yoy) and other expenses (+11.0% yoy), the operating margin underwent
an expansion.
Exhibit 4: OPM Trend
23.0
21.8
22.0
22.0
21.6
21.0
20.0
20.3
19.0
18.0
18.7
17.0
16.0
15.0
2QFY2015
3QFY2015
4QFY2015
1QFY2016
2QFY2016
Source: Company, Angel Research
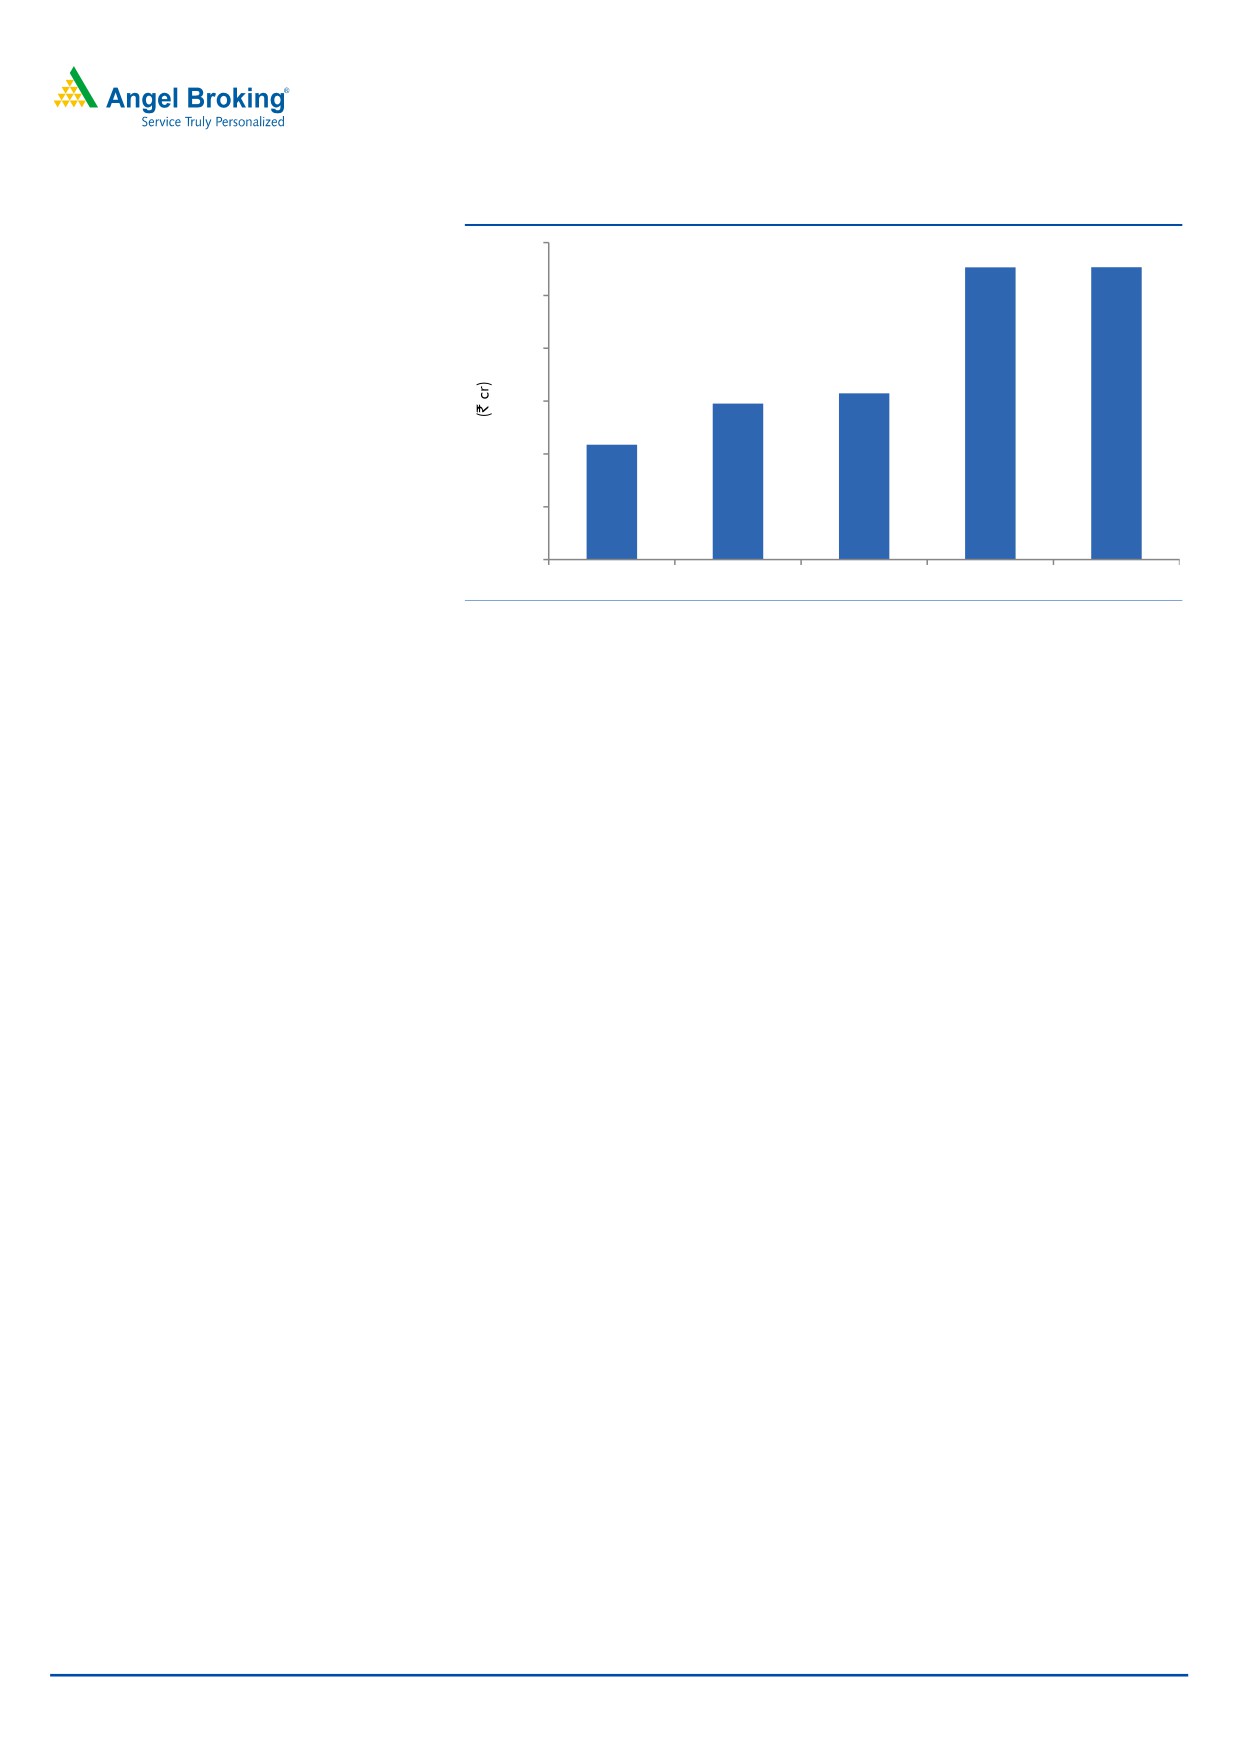
Net profit marginally lower than estimate: On the reported net profit front, the
company posted a net profit of `452cr, a yoy growth of 21.4%. The Adj. Net profit
came in at `451cr V/s `383cr in 2QFY2015, a yoy growth of 17.5%.
November 18, 2015
3
Aurobindo Pharma | 2QFY2016 Result Update
Exhibit 5: Adj. net profit
460
451
451
440
420
403
399
400
383
380
360
340
2QFY2015
3QFY2015
4QFY2015
1QFY2016
2QFY2016
Source: Company, Angel Research
Management takeaways
As of 2QFY2016 the company has filed 382 ANDAs, with 214 final approvals,
and 28 tentative approvals.
The company has guided for launch of 30-35 launches in the US over the next
6-12 months.
The Management guided for a capex of `1,100cr in FY2016E.
Recommendation rationale
US and ARV formulation segments - the key drivers for base business: APL’s
business would primarily be driven by the US and ARV segments on the
formulation front. The company has been an aggressive filer in the US market
with 382 ANDAs filed until 2QFY2016. Amongst peers, APL has emerged as
one of the top ANDA filers. The company has aggressively filed ANDAs in the
last few years and is now geared to reap benefits, even though most of the
filings are for highly competitive products. Going ahead, with US$70bn going
off-patent in the US over the next three years, we believe APL is well placed to
tap this opportunity and is one of the largest generic suppliers. The company
enjoys high market share as it is fully integrated in all its products apart from
having a larger product basket. Also, the company plans to launch
18
injectables in the next 2 years, which drive its growth and profitability. The US
revenue has grown at a CAGR of 31% over FY2009-2015 to `4,832cr. Going
forward, the US business of the company is expected to post a CAGR of 25%
over FY2015-17E.
Acquisitions to augment growth and improve sales mix: APL announced the
signing of a binding offer to acquire commercial operations in seven Western
European countries from Actavis. The net sales for the acquired businesses
were around EUR320mn in 2013 with a growth rate of over 10% yoy. With
this, the European sales of the company would now be ~EUR400mn.
Although these businesses are currently loss-making (by around EUR20mn),
APL expects them to return to profitability in combination with its vertically
integrated platform and existing commercial infrastructure.
November 18, 2015
4
Aurobindo Pharma | 2QFY2016 Result Update
The acquisition will make APL one of the leading Indian pharmaceutical
companies in Europe with a position in the top 10 in several key markets,
which it plans to leverage to supply or widen its product portfolio through
introduction of its own products, especially high margin products like
injectiables.
Also, in December 2014, Aurobindo USA, spent US$132.5mn to acquire the
assets of Natrol with an agreement to take on certain liabilities. With this
acquisition, the company gets an entry into the nutraceutical markets.
Aurobindo USA believes that Natrol is an excellent strategic fit and provides
the right platform for creating a fully-integrated OTC platform in the USA and
in other international markets. Natrol, which manufactures and sells nutritional
supplements in USA and other international market, provides Aurobindo with-
strong brand reputation and presence in a variety of attractive supplement
markets. Natrol has a proven performance in the mass market, health food
and specialty channels, and has existing long term relationships with key
distribution and retail partners. It addresses a broad range of consumers and
has an effective growth strategy to expand market penetration.
With these acquisitions, the overall contribution of formulation sales in APL
sales mix have risen to ~78% in FY2015.
Outlook and valuation
We estimate the company’s net sales to log a 12.5% CAGR over FY2015-17E to
`17,162cr on the back of US and ARV formulation contracts, which will be
supplemented through the recent acquisitions of the Western European formulation
businesses of Actavis and US’ Natrol. This has also led APL to become a
>~US$2bn sales company, with ~ 80% of sales being accounted by formulations.
We maintain a accumulate on the stock.
Exhibit 6: Key assumptions
FY2016E
FY2017E
Sales Growth (%)
23.9
15.0
Operating Margins (%)
22.0
23.0
Capex (` cr)
1100
800
Source: Company, Angel Research
November 18, 2015
5
Aurobindo Pharma | 2QFY2016 Result Update
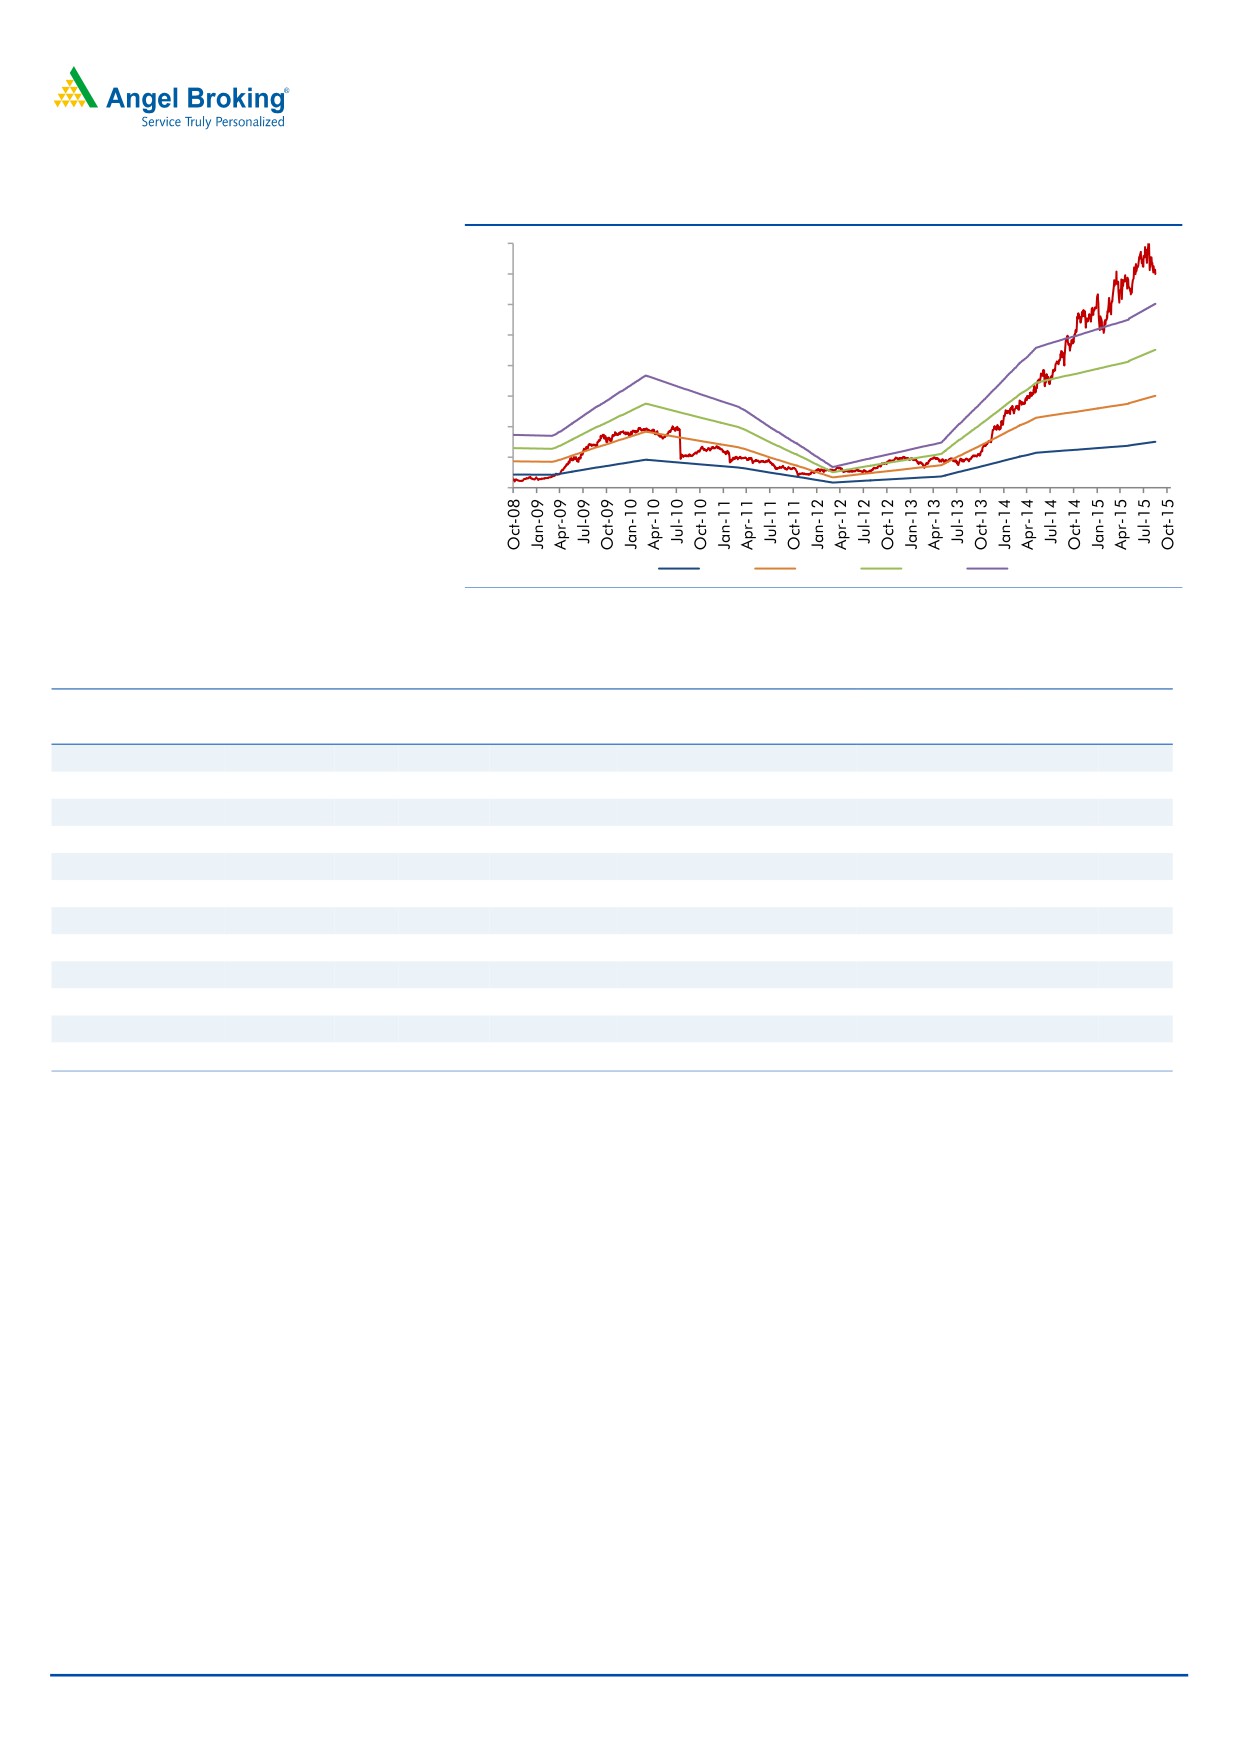
Exhibit 7: One-year forward PE
800
700
600
500
400
300
200
100
0
5x
10x
15x
20x
Source: Company, Angel Research
Exhibit 8: Recommendation summary
Company
Reco
CMP Tgt. price Upside
FY2017E
FY15-17E
FY2017E
(`)
(`)
% PE (x) EV/Sales (x) EV/EBITDA (x) CAGR in EPS (%) RoCE (%) RoE (%)
Alembic Pharma
Neutral
662
-
-
27.7
3.9
19.5
26.1
30.3
30.2
Aurobindo Pharma Accumulate
830
872
5.1
19.4
3.1
13.4
15.6
23.5
30.2
Cadila Healthcare
Neutral
413
-
-
23.5
3.5
16.1
24.6
25.2
29.0
Cipla
Neutral
619
-
-
21.4
2.9
15.3
21.4
17.1
16.8
Dr Reddy's
Buy
3,384
3,933
16.2
18.9
2.8
14.7
17.2
19.1
20.6
Dishman Pharma
Neutral
381
-
-
17.6
1.7
8.2
20.4
11.7
11.7
GSK Pharma*
Neutral
3,152
-
-
46.2
8.0
36.4
6.6
33.7
34.3
Indoco Remedies
Neutral
300
-
-
22.1
2.4
13.1
23.0
19.7
19.7
Ipca labs
Buy
719
900
25.1
25.7
2.6
13.7
17.9
11.8
14.0
Lupin
Neutral
1,777
-
-
26.0
4.5
16.6
13.1
29.6
24.7
Sanofi India*
Neutral
4,586
-
-
30.3
4.0
19.0
33.1
27.9
25.5
Sun Pharma
Buy
742
950
28.1
27.6
4.8
15.6
8.4
15.8
16.6
Source: Company, Angel Research; Note: *December year ending,
November 18, 2015
6
Aurobindo Pharma | 2QFY2016 Result Update
Company background
Aurobindo Pharma manufactures generic pharmaceuticals and APIs. The
company’s manufacturing facilities are approved by several leading regulatory
agencies like the USFDA, UK MHRA, WHO, Health Canada, MCC South Africa
and ANVISA Brazil among others. The company’s robust product portfolio is
spread over six major therapeutic/product areas encompassing antibiotics,
antiretrovirals, CVS, CNS, gastroenterological, and anti-allergics. The company
has acquired the generic business of Actavis which has made it a US$2bn
company, and a leading company in Europe. With this acquisition, formulations
now contribute around 80% to the company’s sales (as in FY2015).
November 18, 2015
7
Aurobindo Pharma | 2QFY2016 Result Update
Profit & loss statement (Consolidated)
Y/E March (` cr)
FY2012
FY2013
FY2014
FY2015
FY2016E
FY2017E
Gross sales
4,619
5,863
8,198
12,221
15,150
17,423
Less: Excise duty
69
80
159
178
227
261
Net Sales
4,551
5,783
8,038
12,043
14,923
17,162
Other operating income
77
72
61
77
77
77
Total operating income
4,627
5,855
8,100
12,121
15,000
17,239
% chg
5.6
26.5
38.3
49.6
23.8
14.9
Total Expenditure
4,017
4,966
5,968
9,557
11,645
13,221
Net Raw Materials
2,520
2,792
3,606
5,506
5,969
6,865
Other Mfg costs
475
578
804
1,204
1,492
1,716
Personnel
536
663
832
1,302
1,498
1,722
Other
487
932
726
1,545
2,686
2,917
EBITDA
533
817
2,071
2,486
3,278
3,941
% chg
(24.3)
53.2
153.5
20.1
31.8
20.2
(% of Net Sales)
11.7
14.1
25.8
20.6
22.0
23.0
Depreciation& Amortisation
201
249
313
333
465
532
EBIT
409
568
1,758
2,154
2,813
3,409
% chg
(23.2)
38.8
209.5
22.5
30.6
21.2
(% of Net Sales)
9.0
9.8
21.9
17.9
18.8
19.9
Interest & other Charges
103
131
108
84
197
240
Other Income
25
29
23
81
81
81
(% of PBT)
7.5
5.3
1.3
3.6
2.9
2.4
Share in profit of Associates
-
-
-
-
-
-
Recurring PBT
331
538
1,735
2,227
2,773
3,327
% chg
(55.9)
62.3
222.7
28.4
24.5
20.0
Extraordinary Expense/(Inc.)
544.5
163.4
203.1
59.6
-
-
PBT (reported)
(213)
374
1,532
2,168
2,773
3,327
Tax
(88.8)
82.7
363.5
596.6
693.4
831.9
(% of PBT)
41.6
22.1
23.7
27.5
25.0
25.0
PAT (reported)
(125)
291
1,168
1,571
2,080
2,496
Less: Minority interest (MI)
(1)
(2)
(4)
(5)
(4)
(3)
PAT after MI (reported)
(124)
294
1,172
1,576
2,084
2,498
ADJ. PAT
198
432
1,333
1,619
2,084
2,498
% chg
(62.4)
118.5
208.6
21.5
28.7
19.9
(% of Net Sales)
(2.7)
5.1
14.6
13.1
14.0
14.6
Basic EPS (`)
6.8
14.8
45.8
55.4
35.7
42.8
% chg
(62.4)
118.5
208.6
21.1
(35.6)
19.9
November 18, 2015
8
Aurobindo Pharma | 2QFY2016 Result Update
Balance sheet (Consolidated)
Y/E March (` cr)
FY2012
FY2013
FY2014
FY2015
FY2016E
FY2017E
SOURCES OF FUNDS
Equity Share Capital
29
29
29
29
58
58
Share Application Money
-
-
-
-
-
-
Reserves & Surplus
2,311
2,577
3,721
5,127
7,040
9,367
Shareholders Funds
2,340
2,606
3,750
5,156
7,098
9,426
Minority Interest
10
11
26
26
22
19
Long-term provisions
4
9
9
24
24
24
Total Loans
3,096
3,384
3,769
3,864
6,000
6,001
Deferred Tax Liability
2
68
205
211
211
211
Total Liabilities
5,452
6,069
7,760
9,280
13,331
15,656
APPLICATION OF FUNDS
Gross Block
3,032
3,316
4,107
6,095
7,195
7,995
Less: Acc. Depreciation
892
1,140
1,461
1,794
2,259
2,791
Net Block
2,141
2,175
2,645
3,752
4,936
5,205
Capital Work-in-Progress
645
645
310
310
310
310
Goodwill
54
55
76
64
64
64
Investments
39
22
20
20
20
20
Long-term loans and adv.
108
243
789
486
486
486
Current Assets
3,248
4,128
5,631
8,279
10,612
13,133
Cash
71
208
179
469
498
1,502
Loans & Advances
315
332
789
692
857
985
Other
2,863
3,587
4,664
7,118
9,257
10,645
Current liabilities
784
1,200
1,730
3,634
3,096
3,560
Net Current Assets
2,465
2,928
3,901
4,645
7,516
9,572
Mis. Exp. not written off
-
-
18
5
-
-
Total Assets
5,452
6,069
7,760
9,280
13,331
15,656
November 18, 2015
9
Aurobindo Pharma | 2QFY2016 Result Update
Cash flow statement (Consolidated)
Y/E March (` cr)
FY2012
FY2013
FY2014
FY2015
FY2016E FY2017E
Profit before tax
(213)
374
1,532
2,168
2,773
3,327
Depreciation
201
249
313
333
465
532
(Inc)/Dec in Working Capital
(796)
(191)
(457)
(757)
(2,842)
(1,053)
Less: Other income
25
29
23
81
81
81
Direct taxes paid
89
(83)
(363)
(597)
(693)
(832)
Cash Flow from Operations
(745)
321
1,001
1,066
(378)
1,894
(Inc.)/Dec.in Fixed Assets
(633)
(283)
(455)
(1,989)
(1,100)
(800)
(Inc.)/Dec. in Investments
-
(16)
(2)
-
-
-
Other income
25
29
23
81
81
81
Cash Flow from Investing
(608)
(271)
(435)
(1,908)
(1,019)
(719)
Issue of Equity
-
-
-
-
-
-
Inc./(Dec.) in loans
1,340
288
385
94
2,136
1
Dividend Paid (Incl. Tax)
(34)
(17)
(102)
(171)
(171)
(171)
Others
(70)
(183)
(879)
1,209
(540)
(1)
Cash Flow from Financing
1,236
88
(596)
1,133
1,426
(171)
Inc./(Dec.) in Cash
(117)
138
(30)
291
29
1,004
Opening Cash balances
188
71
208
179
469
498
Closing Cash balances
71
208
179
469
498
1,502
November 18, 2015
10
Aurobindo Pharma | 2QFY2016 Result Update
Key ratios
Y/E March
FY2012
FY2013
FY2014
FY2015
FY2016E
FY2017E
Valuation Ratio (x)
P/E (on FDEPS)
122.2
55.9
18.1
15.0
23.3
19.4
P/CEPS
315.1
44.5
16.3
12.7
19.0
16.0
P/BV
10.3
9.3
6.4
4.7
6.8
5.1
Dividend yield (%)
0.1
0.1
0.1
0.1
0.1
0.1
EV/Sales
6.0
4.7
3.5
2.3
3.6
3.1
EV/EBITDA
51.0
33.5
13.4
11.1
16.5
13.4
EV / Total Assets
5.0
4.5
3.6
3.0
4.0
3.4
Per Share Data (`)
EPS (Basic)
6.8
14.8
45.8
55.4
35.7
42.8
EPS (fully diluted)
6.8
14.8
45.8
55.4
35.7
42.8
Cash EPS
2.6
18.6
51.0
65.4
43.6
51.9
DPS
1.0
0.5
0.5
0.5
0.5
0.5
Book Value
80.4
89.5
128.8
176.6
121.5
161.4
Dupont Analysis
EBIT margin
9.0
9.8
21.9
17.9
18.8
19.9
Tax retention ratio
58.4
77.9
76.3
72.5
75.0
75.0
Asset turnover (x)
1.0
1.0
1.2
1.5
1.4
1.3
ROIC (Post-tax)
5.1
8.0
20.1
19.2
19.6
19.0
Cost of Debt (Post Tax)
2.5
3.2
2.3
1.6
3.0
3.0
Leverage (x)
1.0
1.3
1.1
0.8
0.7
0.6
Operating ROE
7.6
14.0
39.5
33.4
31.5
29.1
Returns (%)
ROCE (Pre-tax)
8.4
9.9
25.4
25.3
24.9
23.5
Angel ROIC (Pre-tax)
10
12
28
28
27
26
ROE
8.3
17.5
41.9
36.4
34.0
30.2
Turnover ratios (x)
Asset Turnover (Gross Block)
1.7
1.8
2.2
2.4
2.3
2.3
Inventory / Sales (days)
98
98
49
90
93
100
Receivables (days)
115
129
95
93
64
64
Payables (days)
237
78
73
114
80
81
WC cycle (ex-cash) (days)
158
159
145
119
136
160
Solvency ratios (x)
Net debt to equity
1.3
1.2
1.0
0.7
0.8
0.5
Net debt to EBITDA
5.7
3.9
1.7
1.4
1.7
1.1
Interest Coverage (EBIT / Int.)
4.0
4.3
16.3
25.5
14.3
14.2
November 18, 2015
11
Aurobindo Pharma | 2QFY2016 Result Update
Research Team Tel: 022 - 39357800
DISCLAIMER
Angel Broking Private Limited (hereinafter referred to as “Angel”) is a registered Member of National Stock Exchange of India Limited,
Bombay Stock Exchange Limited and Metropolitan Stock Exchange of India Limited. It is also registered as a Depository Participant with
CDSL and Portfolio Manager with SEBI. It also has registration with AMFI as a Mutual Fund Distributor. Angel Broking Private Limited is
a registered entity with SEBI for Research Analyst in terms of SEBI (Research Analyst) Regulations, 2014 vide registration number
INH000000164. Angel or its associates has not been debarred/ suspended by SEBI or any other regulatory authority for accessing
/dealing in securities Market. Angel or its associates including its relatives/analyst do not hold any financial interest/beneficial
ownership of more than 1% in the company covered by Analyst. Angel or its associates/analyst has not received any compensation /
managed or co-managed public offering of securities of the company covered by Analyst during the past twelve months. Angel/analyst
has not served as an officer, director or employee of company covered by Analyst and has not been engaged in market making activity
of the company covered by Analyst.
This document is solely for the personal information of the recipient, and must not be singularly used as the basis of any investment
decision. Nothing in this document should be construed as investment or financial advice. Each recipient of this document should
make such investigations as they deem necessary to arrive at an independent evaluation of an investment in the securities of the
companies referred to in this document (including the merits and risks involved), and should consult their own advisors to determine
the merits and risks of such an investment.
Reports based on technical and derivative analysis center on studying charts of a stock's price movement, outstanding positions and
trading volume, as opposed to focusing on a company's fundamentals and, as such, may not match with a report on a company's
fundamentals.
The information in this document has been printed on the basis of publicly available information, internal data and other reliable
sources believed to be true, but we do not represent that it is accurate or complete and it should not be relied on as such, as this
document is for general guidance only. Angel Broking Pvt. Limited or any of its affiliates/ group companies shall not be in any way
responsible for any loss or damage that may arise to any person from any inadvertent error in the information contained in this report.
Angel Broking Pvt. Limited has not independently verified all the information contained within this document. Accordingly, we cannot
testify, nor make any representation or warranty, express or implied, to the accuracy, contents or data contained within this document.
While Angel Broking Pvt. Limited endeavors to update on a reasonable basis the information discussed in this material, there may be
regulatory, compliance, or other reasons that prevent us from doing so.
This document is being supplied to you solely for your information, and its contents, information or data may not be reproduced,
redistributed or passed on, directly or indirectly.
Neither Angel Broking Pvt. Limited, nor its directors, employees or affiliates shall be liable for any loss or damage that may arise from
or in connection with the use of this information.
Note: Please refer to the important ‘Stock Holding Disclosure' report on the Angel website (Research Section). Also, please refer to the
latest update on respective stocks for the disclosure status in respect of those stocks. Angel Broking Pvt. Limited and its affiliates may
have investment positions in the stocks recommended in this report.
Disclosure of Interest Statement
Aurobindo Pharma
1. Analyst ownership of the stock
No
2. Angel and its Group companies ownership of the stock
No
3. Angel and its Group companies' Directors ownership of the stock
No
4. Broking relationship with company covered
No
Note: We have not considered any Exposure below ` 1 lakh for Angel, its Group companies and Directors
Ratings (Based on expected returns
Buy (> 15%)
Accumulate (5% to 15%)
Neutral (-5 to 5%)
over 12 months investment period):
Reduce (-5% to -15%)
Sell (< -15)
November 18, 2015
12