Angel Top Picks - November 2016
Ongoing earning season confirms revival in domestic consumption
In October 2016 Top Picks report, we had shown faith in the India’s consumption
Top Picks
story. The ongoing earning season confirms our bias as companies in the
Company
CMP (`)
TP (`)
consumption sector have reported decent set of numbers so far. Most notably,
Banking/NBFC
companies in automobile sector have emerged as beneficiary of the ongoing
Dewan Housing
317
350
recovery in the consumer demand. The management commentary of following the
Equitas Holdings
176
235
results indicated that some green shots of recovery are seen in rural market and
Consumption
more growth will be visible in the next few quarters. We also observe improving
Amara Raja
1,029
1,218
sales and operating margins of some companies from food processing, pesticide,
Asian Granito
267
351
paint, and plastic industries. As the consumer demand strengthens, corporate
Bajaj Electricals
261
306
earnings are also expected to pick-up.
Blue Star
557
634
Mirza International
91
113
Exhibit 1: Revival trends in Q2FY17 in consumption sectors
Siyaram Silk Mills
1,554
1,714
Sector
Observations
IT
Automobile
Strong volume and earnings growth, rural volumes picking up
HCL Tech
764
1,000
Building materials,
Improving sales of ceramic tiles, plastic pipes, plywoods, laminates
home furnishing
etc.
Infosys
981
1,249
Entertainment/ Media
Increasing traction in Ad spending by corporates
Media
Increase in domestic appliances and AC sales, 20% rise in sales
Jagran Prakashan
195
225
Consumer durables
reported by E-commerce sites (Flipkart, Amazon and Snapdeal) in
1st week of October
TV Today
349
385
Source: Company, Angel Research
Real Estate/infra/Logistics
Mahindra Lifespace
421
522
Latest PMI suggests manufacturing sector is gathering steam
Navkar Corp.
203
265
Source: Angel Research;
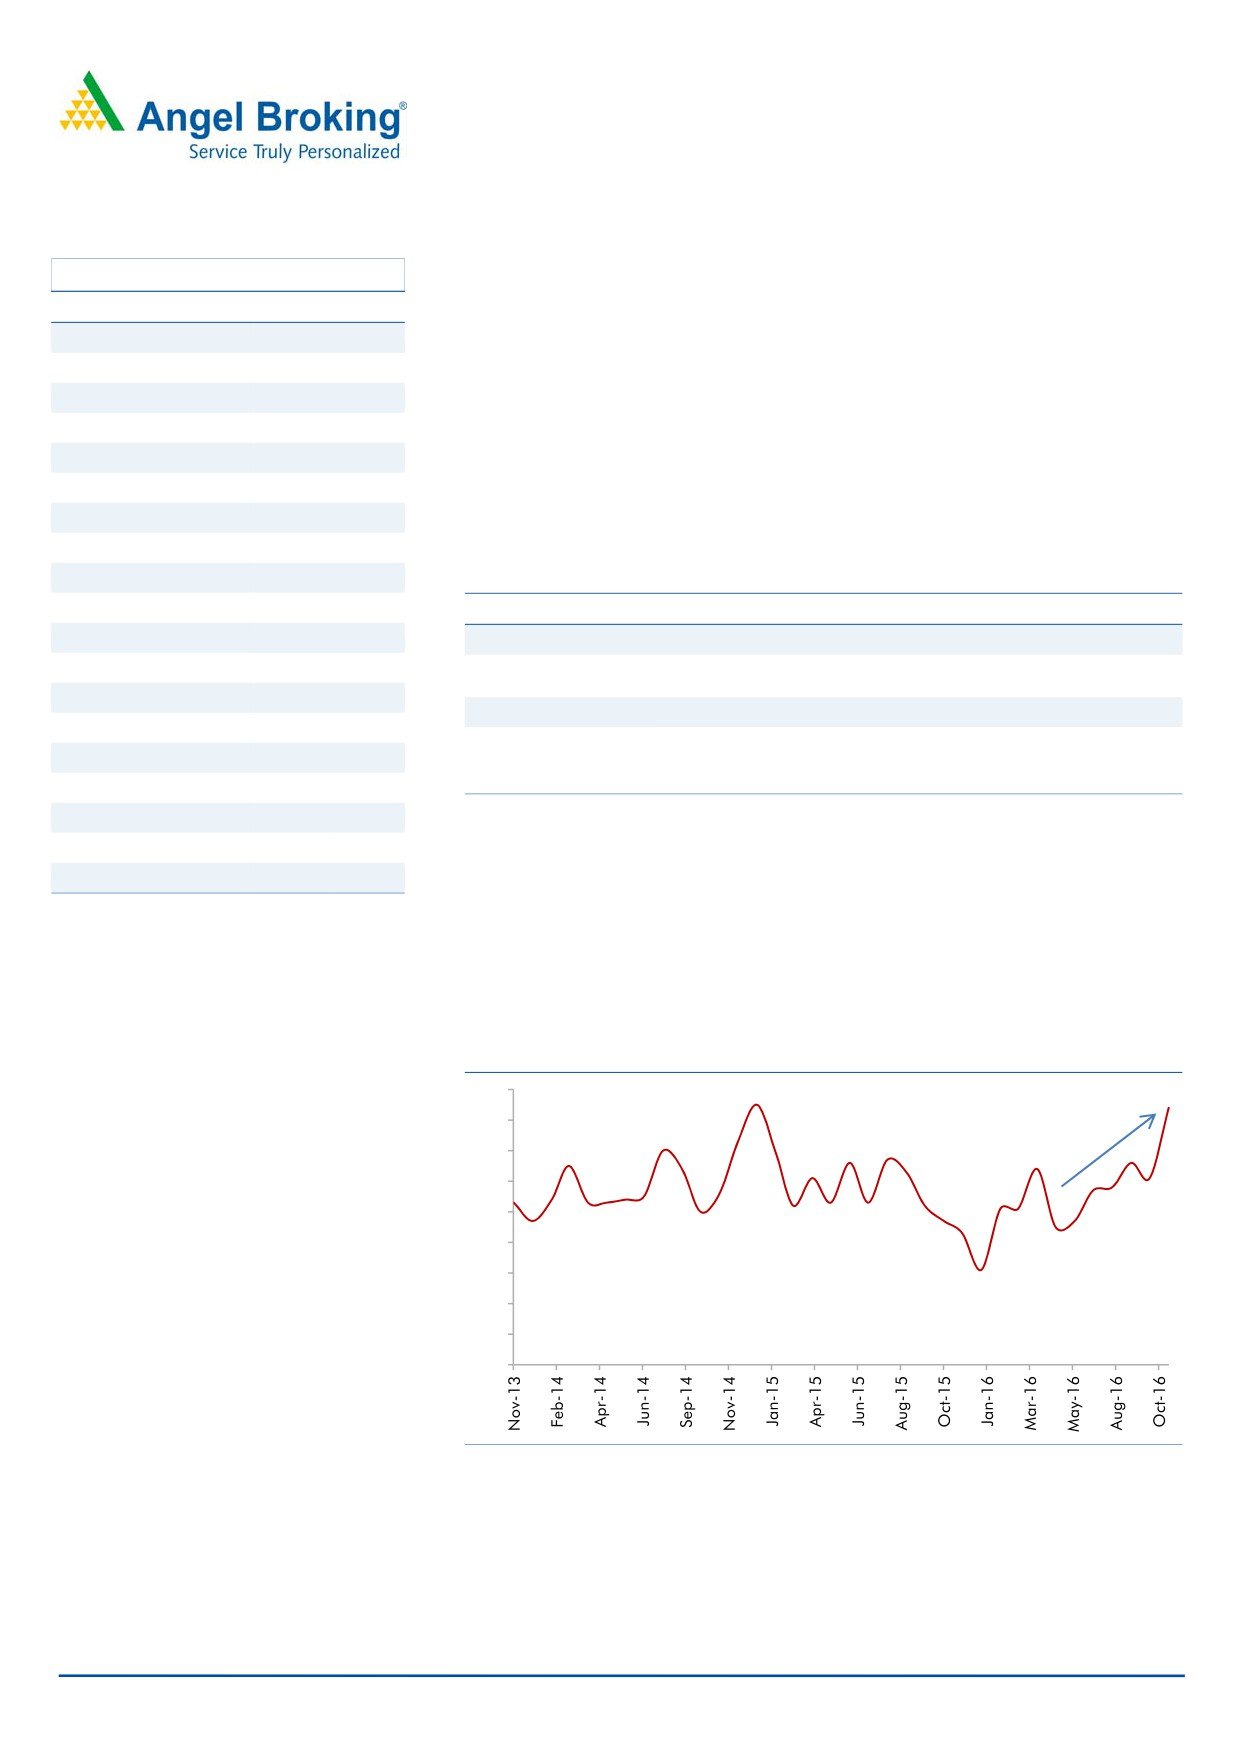
Our confidence also stems from the October reading of Nikkei India
Note: CMP as of Nov 2, 2016
Manufacturing PMI, which stood at
54.4%, highest in the last
22 months
suggesting that domestic manufacturing sector is undergoing recovery on the back
of healthy increase in orders and output.
Exhibit 2: Manufacturing PMI at 22 month high
55
54
53
52
51
50
49
48
47
46
Source: Angel Research
Please refer to important disclosures at the end of this report
1
Top Picks Report | November 2016
Record food grain production to pave way for further rate cut
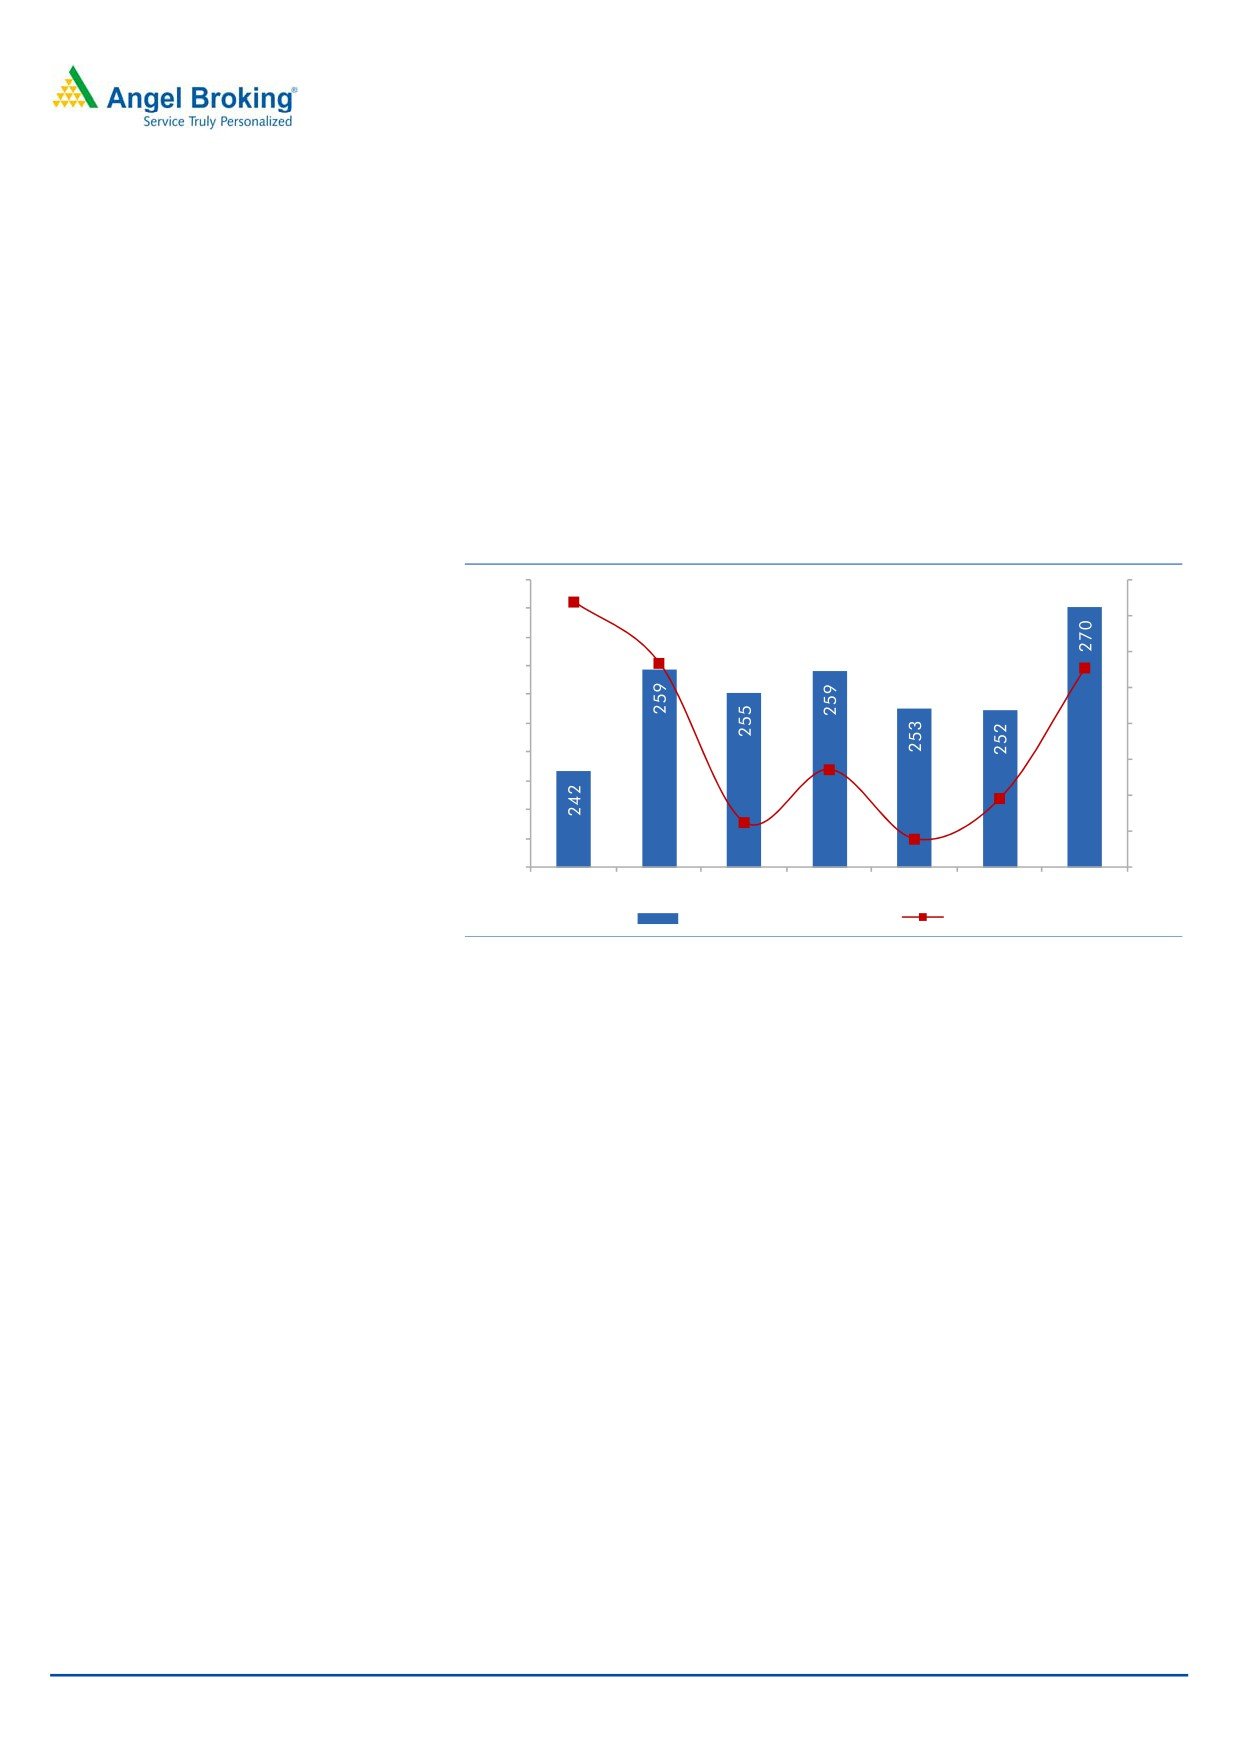
Thanks to the monsoon this year, a record food grain production is expected in
FY17. This will further help to curb the food inflation in the country. On this
backdrop, RBI may cut the interest rates which will decline bond yields further. Due
to low yields, equity has emerged as an attractive asset class and this can clearly
be seen from the negative FII inflows in the debt this year so far. In the earlier
instances when FII inflows in debt were negative, equity generated strong returns in
the subsequent year. The falling bond yields and improving macros are possibly
indicating that we will see a strong equity market next year and inflows will also
remain strong.
Exhibit 3: Record food grain production on cards
275
12.0
10.8
270
10.0
265
8.0
260
7.3
7.1
6.0
255
250
4.0
245
2.0
1.4
240
(0.2)
0.0
235
(1.5)
(2.0)
230
(2.4)
225
(4.0)
FY11
FY12
FY13
FY14
FY15
FY16
FY17E
Foodgrain production (mt)
Growth (%)
Source: Angel Research
Liquidity support to continue
As the economy is gearing for a GDP growth of 7-8% in next two years, equity
markets look bit concerned over possible rate hike by the Federal Reserve (Fed)
which may cause some liquidity tightening. There is, however, good scope to
believe that liquidity may sustain going forward. Last year, the Fed increased the
interest rate after a gap of 7 years and there haven’t been any further hikes so far.
Even though Fed has given green signal for December hike, we believe that rate
hike will be gradual which will avoid any tremors in the financial markets. The
Bank of Japan and European Central Bank continue to provide liquidity support
through their liquidity oriented monetary policies. So, there is a strong room to
believe that ample liquidity will remain in the markets in near future.
Overall, this year we are seeing a lot of positive things happening in the Indian
economy. However, there could also be some challenges if Fed goes for
accelerated interest rate hikes instead of gradual hikes. Despite this, we believe
that India remains an attractive market for investors due to recovery in consumer
demand and improving macros.
Our top-picks are focused on companies that will benefit from strong consumption
and low interest rates. This includes stocks from interest sensitive sectors like
Dewan Housing, Mahindra Lifespace, etc., and consumption sector like Bajaj
Electrical, Amara Raja, Blue Star, Asian Granito, Mirza International, etc.
November 3, 2016
2
Top Picks Report | November 2016
Top Picks
November 3, 2016
3
Top Picks Report | November 2016
Stock Info
Dewan Housing
CMP
317
3rd largest private sector housing finance company: We expect DHFL’s AUM to
TP
350
grow at a CAGR of 21% over FY2016-18, as demand for housing in the middle
Upside
10.4%
and low income group picks up, while PAT CAGR is expected to be 23%.
Sector
Financials
Seasoned and granular loan book with stable asset quality: Individual
borrowers account for 72%, while the high yielding loan against property (LAP)
Market Cap (` cr)
9,984
+SME and projects loans account for 19% and 9% of advances respectively. Despite
Beta
1.6
strong loan growth, the GNPAs and NNPAs are likely to be at ~1.17% and 0.82%,
52 Week High / Low
337 / 141
respectively, for FY2017. We don’t expect any major deterioration in the asset
quality going ahead.
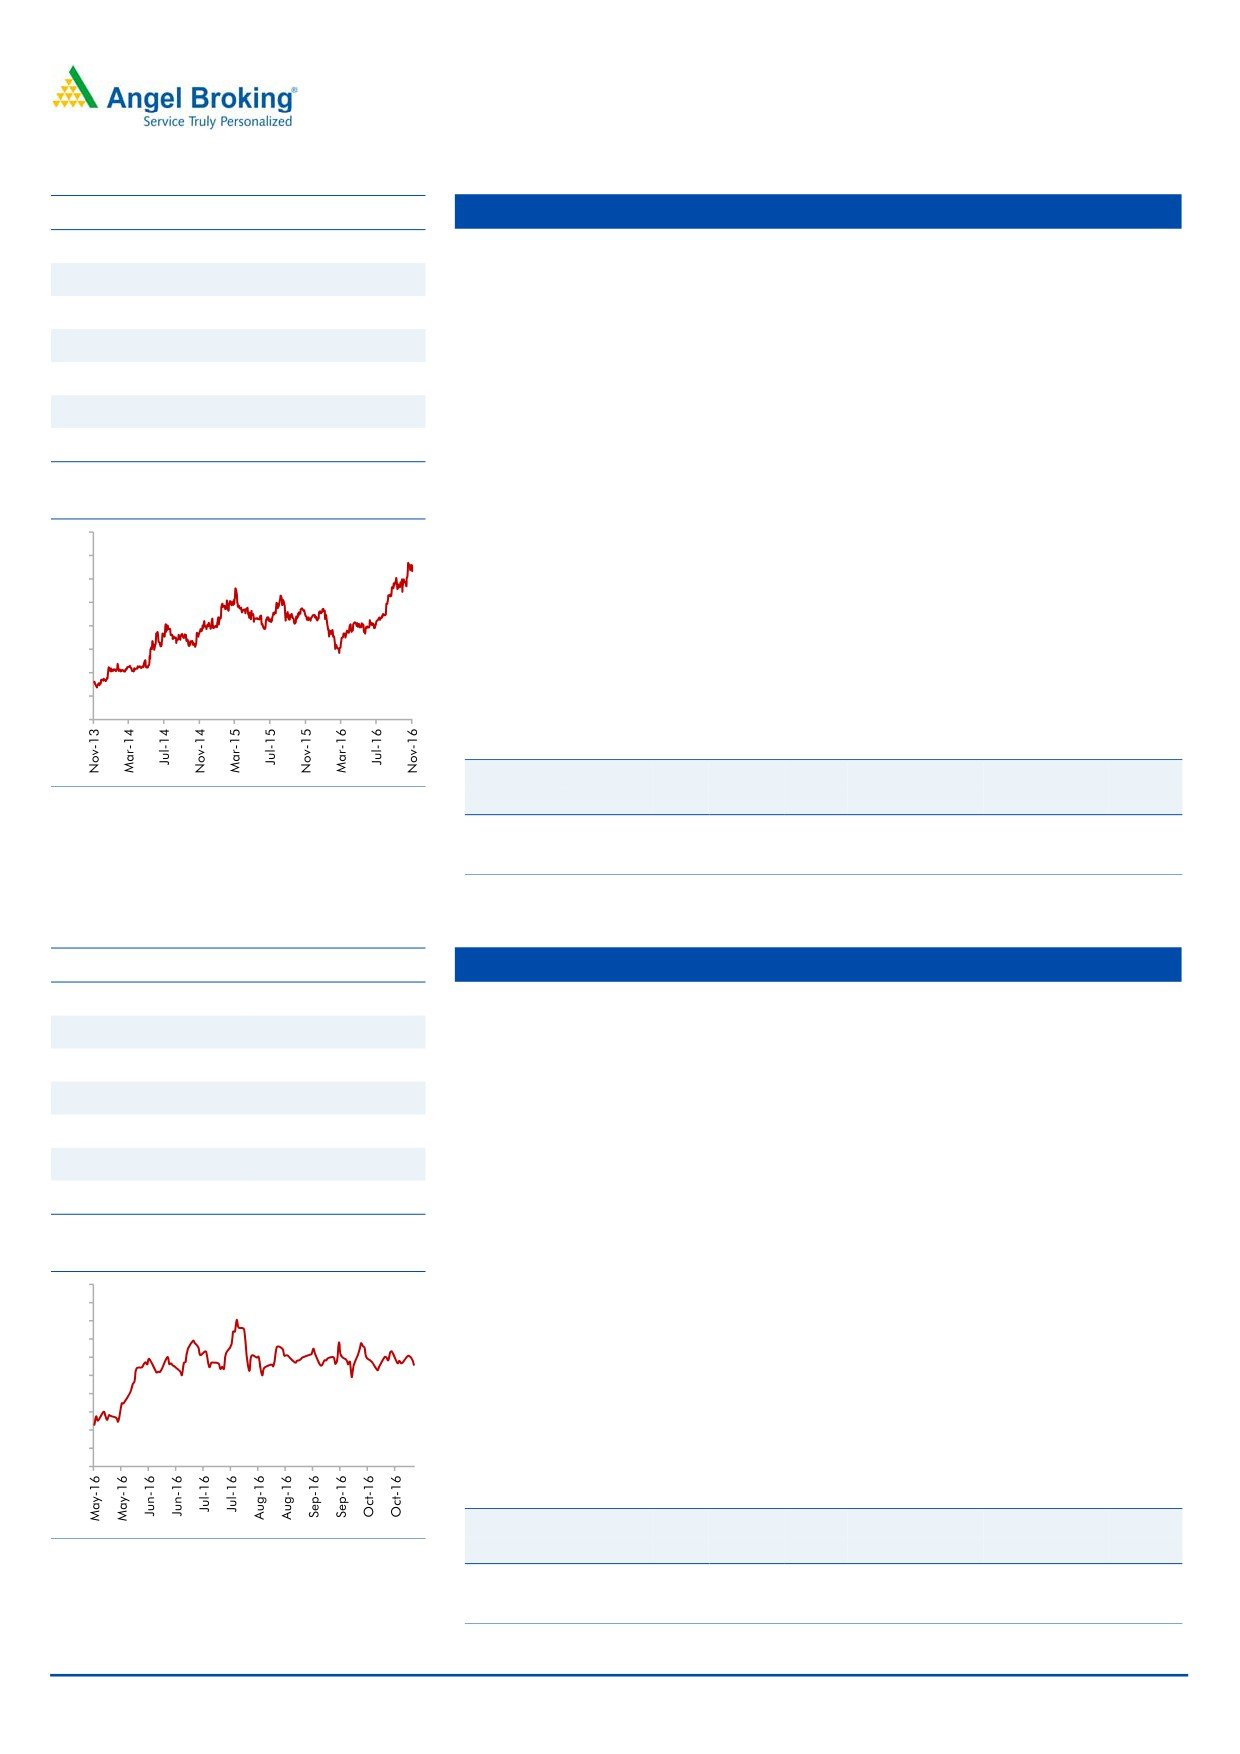
3 year-Chart
Lower cost of funds will help maintain NIM: Nearly
70% of the bank
400
borrowings are due for maturity over the next three years and recently DHFL
350
was able to raise large sum ~ Rs14, 000 cr via NCDs at a competitive rates
300
and this should help maintain its NIM at ~2.9%.
250
200
Outlook: We expect the company to post a healthy loan book CAGR of 21%
150
over FY2015-18E, which is likely to translate in an earnings CAGR of 23%,
100
over the same period. The stock currently trades at 1.5x FY2018E ABV. We
50
have an Accumulate stand on the stock, with a target price of `350.
-
Key Financials
Y/E
Op. Inc NIM
PAT
EPS
ABV ROA ROE P/E P/ABV
Source: Company, Angel Research
March
(` cr)
(%)
(` cr)
(`)
(`)
(%)
(%)
(x)
(x)
FY2017E
2,050
2.9
879
28.1
187.8
1.2
15.6
11.3
1.7
FY2018E
2,500
2.9
1,111
35.5
216.4
1.2
16.5
8.9
1.5
Source: Company, Angel Research
Stock Info
Equitas Holdings
CMP
176
Early mover advantage in the SFB category: Equitas was one of the ten NBFCs
TP
235
to get the license to start a small finance bank (SFB). As the entire book of
Upside
33.5%
Equitas qualifies for PSL, meeting the 75% PSL target will not be a challenge.
Sizeable and diversified loan book will keep it ahead of other upcoming SFBs.
Sector
Financials
Asset quality and return ratios are likely to remain stable: Equitas will have to
Market Cap (` cr)
5,989
maintain CRR & SLR going ahead; hence yield on total assets is likely to come
Beta
0.9
down. However, as a bank it will be able to raise deposits and hence there will
52 Week High / Low
206 / 134
be reduction in cost of funds. As a result, spreads may not decline much which
in turn will help in maintaining the ROE & ROA which although could undergo
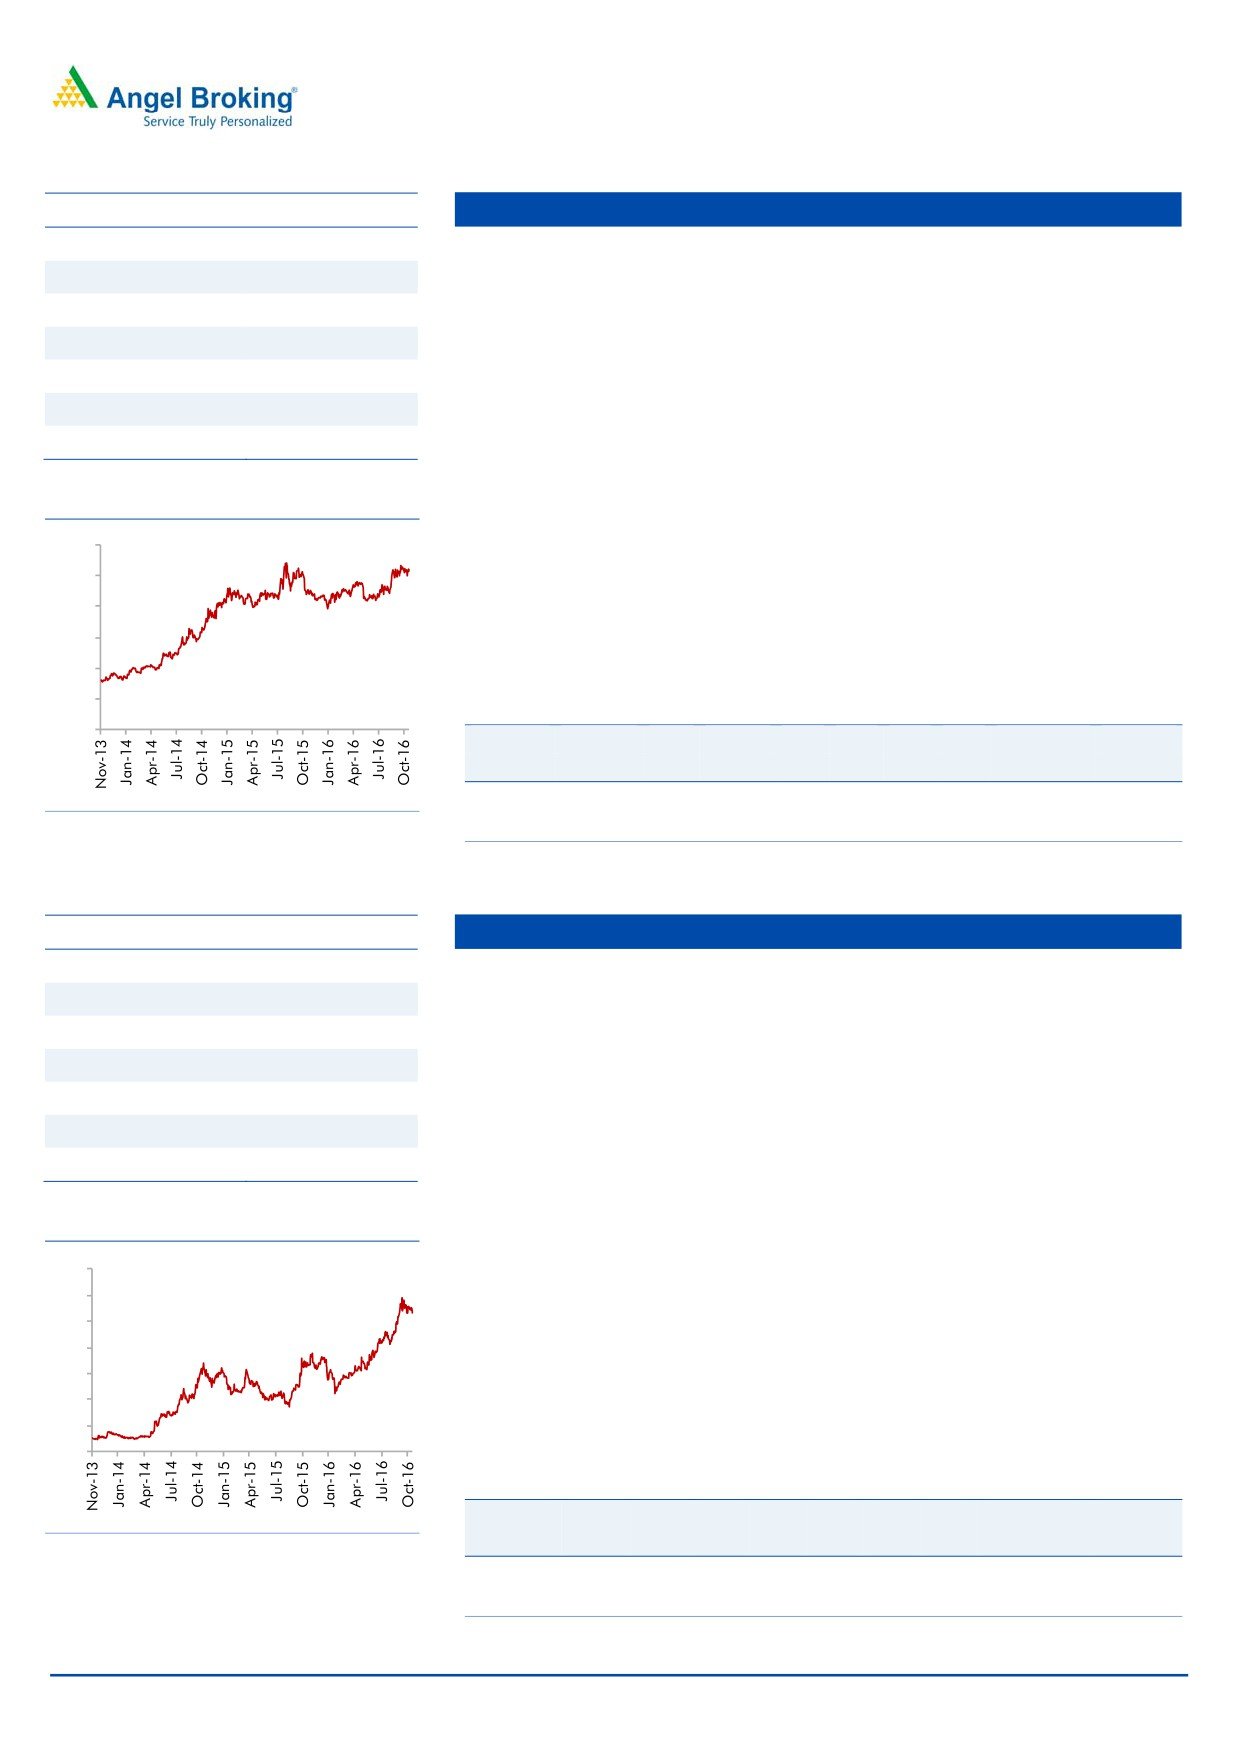
3 year-Chart
a marginal decline. Also we don’t expect any major deterioration in the asset
220
quality going ahead.
210
200
NIM likely to remain healthy: After conversion to SFB the company has started
190
raising deposits at a lower cost vs borrowings leading to better cost of funds.
180
170
Hence we expect the NIM to remain strong at ~10-11%, going ahead.
160
Outlook: We expect the company to post a strong loan book & earnings
150
140
CAGR of 38% & 37% over FY2016-18E. The stock currently trades at 2.3x
130
FY2018E BV. We maintain Buy on the stock, with a target price of `235.
120
Key Financials
Y/E
Op. Inc NIM
PAT
EPS
ABV ROA ROE P/E P/ABV
March
(` cr)
(%)
(` cr)
(`)
(`)
(%)
(%)
(x)
(x)
Source: Company, Angel Research
FY2017E
1,076
11.7
224
6.7
68.2
2.8
12.4
26.3
2.6
FY2018E
1,465
11.4
315
9.4
77.6
2.8
12.9
18.7
2.3
Source: Company, Angel Research
November 3, 2016
4
Top Picks Report | November 2016
Stock Info
Amara Raja Batteries
CMP
1,029
Amara Raja Batteries Ltd (ARBL) is the second largest lead acid storage battery
TP
1,218
manufacturer in the country. It has been outpacing market leader Exide (ARBL
Upside
18.4%
grew at a 21% CAGR over FY2010-16 as compared to standalone Exide's
growth of 7%), leading to its market share improving from 25% in FY10 to
Sector
Auto Ancillary
about 35% currently. ARBL's outperformance has been mainly on back of its
Market Cap (` cr)
17,571
association with global battery leader Johnson Controls Inc (which also holds
Beta
0.8
26% stake in ARBL) for manufacturing ducts.
52 Week High / Low
1,077 / 773
With the automotive OEMs following a policy of having multiple vendors and
with ARBL’s products enjoying a strong brand recall in the replacement
3 year-Chart
segment, the company is well poised to gain further market share. Given the
economic recovery and market share gains, the company is expected to grow at
1200
a CAGR of 18% over the next two years as against industry growth of 10-12%.
1000
ARBL is a well diversified auto ancillary player having presence across the
800
automotive and the industrial segment. It has a broad OEM as well as
600
replacement customer base. We believe ARBL is a high quality stock to play
400
the auto sector revival. We maintain our Buy rating on the stock.
200
Key Financials
0
Y/E
Sales
OPM PAT EPS ROE P/E P/BV EV/EBITDA EV/Sales
March
(` cr)
(%)
(` cr)
(`)
(%)
(x)
(x)
(x)
(x)
FY2017E
5,429
17.5
604
35.3
25.3
29.5
6.7
15.8
3.1
Source: Company, Angel Research
FY2018E
6,471
17.6
742
43.5
24.8
23.7
5.4
13.0
2.5
Source: Company, Angel Research
Stock Info
Asian Granito
CMP
267
AGIL’s current, vitrified sales (35%) are lower as compared to its peers like
TP
351
Somany Ceramics (47%) and Kajaria Ceramics (61%). Recently, AGIL has
Upside
31.4%
launched various products in premium segment. Going forward, we expect
AGIL’s profit margin to improve due to increase in focus for higher vitrified
Sector
Ceramics
product sales, which is a high margin business.
Market Cap (` cr)
799
AGIL is continuously putting efforts to increase the B2C sales from the current
Beta
1.4
level (35% in FY16). It is expected to reach up to 50% in next 2-3 years on the
52 Week High / Low
304 / 109
back of various initiatives taken by AGIL to increase direct interaction with customers
like strengthening distribution network, participation in key trade exhibition, etc.
3 year-Chart
In July FY2016, AGIL acquired Artistique Ceramic which has a better margin
profile. Going forward, we expect the company to improve its operating
350
margin from 7.5% in FY16 (excluding merger) to
12-12.5% in coming
300
financial year. Artisique Ceramics has a contract with RAS GAS to supply
250
quality natural gas at a discounted rate of 50% to current market rate, which
200
would reduce the overall power & fuel cost of the company.
150
We expect AGIL to report a net revenue CAGR of ~9% to ~`1,182cr and net
100
profit CAGR of ~39% to `48cr over FY2016-18E. We have a Buy rating on
50
0
the stock and target price of `351.
Key Financials
Y/E
Sales OPM PAT EPS ROE P/E P/BV EV/EBITDA EV/Sales
March
(` cr)
(%)
(` cr)
(`)
(%)
(x)
(x)
(x)
(x)
Source: Company, Angel Research
FY2017E
1,071
12.1
38
12.7
9.5
21.0
2.0
8.2
1.0
FY2018E
1,182
12.4
48
16.0
10.7
16.7
1.8
7.2
0.9
Source: Company, Angel Research
November 3, 2016
5
Top Picks Report | November 2016
Stock Info
Bajaj Electricals
CMP
261
The company is among the top 4 players in the consumer durables space
TP
306
across all its product categories (leader in small appliances; number-4 in fans
and lighting). It has a strong distribution reach with 4,000 distributors
Upside
17.2%
reaching out to 400,000 retailers.
Sector
Cons. Durable
In the 3 years preceding FY2016, the company’s E&P segment had been
Market Cap (` cr)
2,632
underperforming owing to cost overruns and delays in project executions.
Beta
0.9
However, the segment has turned around in FY2016 on the profitability front
52 Week High / Low
280 / 155
and delivered a healthy EBIT margin of ~6% for the year. Currently the
segment’s order book stands at `2,480cr.
3 year-Chart
With expectation of timely execution of new projects in the E&P segment and
with the Lighting and Consumer Durables segments expected to benefit from
400
an improvement in consumer sentiments going forward, we expect the
350
300
company’s top-line to grow at a CAGR of ~12% to `5,805cr and bottom-line
250
to grow at a CAGR of 24% to `147cr over FY2016-FY2018E. We recommend
200
a Buy rating on the stock.
150
Key Financials
100
50
Y/E
Sales OPM PAT EPS ROE P/E P/BV EV/EBITDA EV/Sales
0
March
(` cr)
(%)
(` cr)
(`)
(%)
(x)
(x)
(x)
(x)
FY2017E
5,099
5.6
115
11.4
13.4
22.9
3.1
9.5
0.5
FY2018E
5,805
5.9
147
14.6
15.1
17.9
2.7
7.9
0.5
Source: Company, Angel Research
Source: Company, Angel Research
Stock Info
Blue Star
CMP
557
BSL is one of the largest air-conditioning companies in India. With a mere
TP
634
3% penetration level of ACs vs 25% in China, the overall outlook for the room
Upside
13.8%
air-conditioner (RAC) market in India is favourable.
Sector
Cons. Durable
BSL’s RAC business has been outgrowing the industry by ~10% points over the
Market Cap (` cr)
5,307
last few quarters, resulting in the company consistently increasing its market
share (~7% in FY2014 to 10.5% at present). This has resulted in the Cooling
Beta
0.6
Products Division (CPD)'s share in overall revenues increasing from~23% in
52 Week High / Low
581 / 306
FY2010 to ~42% in FY2016 (expected to improve to ~47% in FY2018E). With
strong brand equity and higher share in split ACs, we expect the CPD to
3 year-Chart
continue to drive growth.
Aided by increasing contribution from the CPD, we expect the overall top-line
700
600
to post a revenue CAGR of ~16% over FY2016-18E and margins to improve
500
from 5.3% in FY2015 to 7.3% in FY2018E. Moreover, the merger of Blue Star
400
Infotech has infused cash and strengthened the balance sheet. We have an
300
Accumulate recommendation on the stock.
200
Key Financials
100
0
Y/E
Sales OPM PAT EPS ROE P/E P/BV EV/EBITDA EV/Sales
March
(` cr)
(%)
(` cr)
(`)
(%)
(x)
(x)
(x)
(x)
FY2017E
4,283
5.9
141
14.9
20.4
37.4
7.3
20.1
1.3
FY2018E
5,077
7.3
211
22.1
26.4
25.2
6.1
13.6
1.1
Source: Company, Angel Research
Source: Company, Angel Research
November 3, 2016
6
Top Picks Report | November 2016
Stock Info
Mirza International
CMP
91
In the branded domestic segment, we expect the company to report a ~24%
TP
113
CAGR over FY2016-18E to `346cr. We anticipate strong growth for the
Upside
24.2 %
company on the back of (a) the company’s wide distribution reach through its
1,000+ outlets including 120 exclusive brand outlets (EBOs) in 35+ cities and
Sector
Footwear
the same are expected to reach 200 over the next 2-3 years and (b) strong
Market Cap (` cr)
1,095
branding (Red Tape) in the shoes segment.
Beta
1.5
MIL’s major export revenue comes from the UK (73%), followed by the US
52 Week High / Low
145 / 84
(14%) and the balance from ROW. Export constitutes ~75% of the company’s
total revenue. We expect the company to report healthy growth over the next
2-3 years on back of recovery in the UK market, strong growth in the US market
3 year-Chart
and with it tapping newer international geographies like the Middle East countries.
160
140
In FY2016, the company acquired Genesis Footwear which has a better
120
margin profile than it. The deal resulted in MIL’s EPS increasing by ~4% and
100
ROE improving from 15.9% to 17.5%. Further, due to this merger, the
80
company’s capacity has increased from 5.4mn to 6.4mn units.
60
We expect MIL to report a net revenue CAGR of ~11% to ~`1,148cr and net
40
profit CAGR of ~11% to `97cr over FY2016-18E. We have a Buy rating on
20
the stock and target price of `113.
0
Key Financials
Y/E
Sales OPM PAT EPS ROE P/E P/BV EV/EBITDA EV/Sales
March
(` cr)
(%)
(` cr)
(`)
(%)
(x)
(x)
(x)
(x)
Source: Company, Angel Research
FY2017E
1,024
18.0
83
6.9
16.6
13.2
2.2
7.3
1.3
FY2018E
1,148
18.0
97
8.0
16.2
11.4
1.9
6.4
1.1
Source: Company, Angel Research
Stock Info
Siyaram Silk Mills
CMP
1,554
SSML has strong brands which cater to premium as well as popular mass
TP
1,714
segments of the market. Further, SSML entered the ladies' salwar kameez and
Upside
10.2%
ethnic wear segment. Going forward, we believe that the company would be able to
leverage its brand equity and continue to post strong performance.
Sector
Textile
Market Cap (` cr)
1,457
The company has a nationwide network of about 1,600 dealers and business
partners. It has a retail network of 160 stores and plans to add another
Beta
0.8
300-350 stores going forward. Further, the company's brands are sold across
52 Week High / Low
1,690/912
3,00,000 multi brand outlets in the country.
Going forward, we expect SSML to report a net sales CAGR of ~12% to
3 year-Chart
~`2,040cr and adj.net profit CAGR of ~14% to `115cr over FY2016-18E on
back of market leadership in blended fabrics, strong brand building, wide
1800
1600
distribution channel, strong presence in tier II and tier III cities and emphasis
1400
on latest designs and affordable pricing points. At the current market price,
1200
SSML trades at an inexpensive valuation. We have an Accumulate
1000
800
recommendation on the stock and target price of `1,714.
600
400
Key Financials
200
Y/E
Sales
OPM PAT EPS ROE P/E P/BV EV/EBITDA EV/Sales
0
March
(` cr)
(%)
(` cr)
(`)
(%)
(x)
(x)
(x)
(x)
FY2017E
1,799
11.6
98
104.9
16.4
14.8
2.4
8.5
1.0
FY2018E
2,040
11.7
115
122.4
16.4
12.7
2.1
7.4
0.9
Source: Company, Angel Research
Source: Company, Angel Research
November 3, 2016
7
Top Picks Report | November 2016
Stock Info
HCL Technologies
CMP
764
Healthy pipeline: Company’s engineering services has been seeing lumpy
TP
1,000
growth over the last few quarters. This is however largely a function of the
Upside
30.8%
timing of large transformational deals. 6-8 of the large deals signed a few
Sector
IT
quarters ago will aid the company to continue to post industry leading growth.
Market Cap (` cr)
1,07,831
We expect HCL Tech to post a USD and INR revenue CAGR of 16.3% and
18.0%, respectively, over FY2016-18E (inclusive of the acquisition of
Beta
0.6
Geometric Software and the Volvo deal).
52 Week High / Low
890 / 707
Robust outlook: For FY2017 revenues are expected to grow between 12.0-
14.0% in CC. Revenue guidance is based on FY2016 (April to March’2016)
3 year-Chart
average exchange rates. The above constant currency guidance translates to
1200
11.2% to 13.2% growth in US$ terms.
1000
Outlook and Valuations: The stock is attractively valued at the current market
800
price and hence we maintain our Buy with a price target of `1,000.
600
400
Key Financials
200
Y/E
Sales
OPM PAT EPS ROE P/E P/BV EV/EBITDA EV/Sales
0
June
(`cr)
(%)
(`cr)
(`)
(%)
(x)
(x)
(x)
(x)
FY2017E
49,242
20.5
7,862
55.7
20.3
13.7
3.0
10.0
2.0
FY2018E
57,168
20.5
9,037
64.1
17.9
11.9
2.3
8.0
1.7
Source: Company, Angel Research
Source: Company, Angel Research
Stock Info
Infosys
CMP
981
Revenue guidance for FY17: The Management has lowered its guidance for
TP
1,249
FY2017, to 8-9% in CC terms and 9.2-10.2% in INR terms (exchange rate as
Upside
27.3%
on March 31, 2016). For FY2016, the company posted a 13.3% growth in CC
Sector
IT
terms V/s a guidance of 12.8-13.2% growth (in CC). We expect the company
Market Cap (` cr)
2,25,353
to post ~9.0% USD revenue growth in FY2017.
Beta
0.8
Aims to be US$20bn company by FY20: Company expects its revenue to rise
52 Week High / Low
1,278 / 980
to US$20bn by FY2020, up from US$8.7bn in FY2015, as it focuses on
acquisitions and winning more new technology services, implying a
3 year-Chart
14% CAGR over the period. Over the near term, we expect Infosys to post a
1400
9.0% USD revenue growth in FY2017. Over FY2016-18E, we expect
1200
USD and INR revenue to grow at a CAGR of 9.0% and 9.5%, respectively.
1000
Outlook and Valuations: The stock trades at a valuation of 14.1x FY2018E
800
600
earnings. We recommend Buy on the stock with a price target of `1,249.
400
Key Financials
200
Y/E
Sales
OPM PAT EPS ROE P/E P/BV EV/EBITDA EV/Sales
0
March
(` cr)
(%)
(` cr)
(`)
(%)
(x)
(x)
(x)
(x)
FY2017E
68,350
27.0
14,354
62.5
21.3
15.7
3.3
10.8
2.9
FY2018E
77,236
27.0
15,928
69.4
21.6
14.1
3.1
9.4
2.5
Source: Company, Angel Research
Source: Company, Angel Research
November 3, 2016
8
Top Picks Report | November 2016
Stock Info
Jagran Prakashan
CMP
195
We expect JPL to register a net sales CAGR of ~12% over FY2016-18E, on
TP
225
back of (a) strong growth in advertising revenue due to improvement in GDP
growth, and (b) improvement in circulation revenue owing to combination of
Upside
15.4%
increase in cover price and volume growth.
Sector
Media
Further the acquisition of Radio City would also boost the company's revenue
Market Cap (` cr)
6,378
going ahead. Radio City has ~20 stations across 7 states in the country and is
second only to ENIL in all its operating circles, ie Delhi, Mumbai, Bengaluru,
Beta
0.6
Chennai, Ahmedabad, Hyderabad, Pune and Lucknow. The company covers
52 Week High / Low
213/139
~51% (~66mn people) of the total radio population.
Raw material prices have been in a declining trend. Thus, considering lower
3 year-Chart
news print costs, healthy sales, and higher margins in the radio business, we
expect an adj. net profit CAGR of ~12% over FY2016-18E to `409cr.
250
Considering Dainik Jagran's strong presence in the rapidly growing Hindi
200
markets, we expect JPL to benefit from an eventual recovery in the Indian
economy. Hence, we maintain a Buy rating on the stock with a target price of
150
`225.
100
Key Financials
50
Y/E
Sales
OPM PAT EPS ROE P/E P/BV EV/EBITDA EV/Sales
0
March
(` cr)
(%)
(` cr)
(`)
(%)
(x)
(x)
(x)
(x)
FY2017E
2,355
28.0
353
10.8
21.7
18.1
3.9
10.0
2.7
FY2018E
2,635
28.0
409
12.5
21.7
15.6
3.4
8.7
2.4
Source: Company, Angel Research
Source: Company, Angel Research
Stock Info
TV Today Network
CMP
349
TTNL enjoys a strong viewership ranking in the Hindi and English news
TP
385
channel categories. The company’s Hindi news channel - Aaj Tak has
Upside
10.3%
maintained its market leadership position occupying the No.1 rank for several
Sector
Media
consecutive years in terms of viewership. Its English news channel - India
Today too has been continuously gaining viewership; it has now captured the
Market Cap (` cr)
2,079
No. 2 ranking from No. 4 earlier. Its other channels like Dilli Aaj Tak and Tez
Beta
1.3
are also popular among viewers.
52 Week High / Low
360 /230
Out of the 7 radio stations, TTNL has sold off 4 (Jodhpur, Amritsar, Patiala
and Shimla) for `4cr. The remaining 3 stations are in the process of getting
3 year-Chart
sold off to ENIL but the sale will have to wait until concerns raised by the MIB
400
are resolved. Going forward, we expect them to be sold off and this would
350
prop up the company’s profitability.
300
250
We expect TTNL to report a net revenue CAGR of ~16% to ~`743cr and net
200
profit CAGR of ~16% to `128cr over FY2016-18E. We have an Accumulate
150
recommendation on the stock and target price of `385
100
50
Key Financials
0
Y/E
Sales
OPM PAT EPS ROE P/E P/BV EV/EBITDA EV/Sales
March
(` cr)
(%)
(` cr)
(`)
(%)
(x)
(x)
(x)
(x)
FY2017E
637
27.5
110
18.4
17.4
19.0
3.3
9.7
2.9
Source: Company, Angel Research
FY2018E
743
27.5
128
21.4
17.2
16.3
2.8
7.9
2.4
Source: Company, Angel Research
November 3, 2016
9
Top Picks Report | November 2016
Stock Info
Mahindra Lifespace
CMP
421
MLF has 13 projects under implementation across cities. MLF has exhibited
TP
522
fast completion of projects compared to others. Sales cycle in ~65% of
Upside
24.0%
projects is faster than execution cycle, contrary to industry trends. This fast
execution and sales is optimal, as it helps MLF in revenue recognition,
Sector
Real Estate
inventory cycle (better than Oberoi, DLF), cash flows and profitability. This
Market Cap (` cr)
1,728
translates in creating a virtuous cycle of continuous fast growth.
Beta
0.4
MLF as of 4QFY2016 is pursuing ~4.0mn sq. ft. of sale of the total ~15.0mn
52 Week High / Low
518 / 415
sq. ft. of saleable area. Having sold ~60% of ongoing projects, we expect MLF
to launch ~2.8mn sq.ft. of saleable area in rational way during 4QFY2016-
3 year-Chart
2QFY2018E, across 6 cities. Maturity at existing projects, new launches give better
700
revenue visibility for medium-term. Further, MLF is sitting on land bank of 11.0mn
600
sq.ft across 4 cities, which allays any concern over long-term revenue growth.
500
With Real Estate Regulatory Bill closer to reality, MLF should be minimally
400
impacted, given their strong parentage and ethically implemented processes.
300
In the longer-term organized, professionally run, well funded players would
200
enjoy strong trust due to their reliable and fast execution strategies. With
100
improvement in company’s fundamentals, strong earnings growth visibility
0
and long-term growth outlook, at current valuations of 1.1x FY2017E P/BV,
MLF looks attractive. We maintain BUY on MLF with target price of `522.
Key Financials
Source: Company, Angel Research
Y/E
Sales
OPM PAT EPS ROE P/E P/BV EV/EBITDA EV/Sales
March
(` cr)
(%)
(` cr)
(`)
(%)
(x)
(x)
(x)
(x)
FY2017E
1,152
22.7
75
29.9
7.6
14.6
1.0
15.7
2.2
FY2018E
1,300
24.6
138
35.8
8.6
11.8
1.0
10.1
1.9
Source: Company, Angel Research
Stock Info
Navkar
CMP
203
NCL is one of the largest and one of the three CFS at JNPT with rail
TP
265
connectivity, helping it garner high market share at the port. NCL is in a massive
Upside
30.5%
expansion mode where it is increasing its capacity by 234% to 1,036,889 TEUs
Sector
Logistics
at JNPT and coming up with an ICD at Vapi (with Logistics Park).
Market Cap (` cr)
2,893
The ICD with rail link should benefit from first mover advantage in a region
Beta
0.6
that has huge market potential and accounts for ~27% of volumes at JNPT.
The ICD should be able to capture the EXIM volumes from the region through
52 Week High / Low
224 / 151
rail link that till now was being custom cleared at JNPT (Import) or being
transported via road and consolidated at JNPT (Export). South Gujarat
3 year-Chart
volumes will now head straight to the Vapi ICD; thus the company can now
250
cater to bulk commodities and domestic traffic that it had been rejecting owing
200
to capacity constraints at CFS.
150
We expect NCL to successfully use its rail advantage and scale up its
utilizations at both JNPT and Vapi ICD. We have a Buy rating on the stock.
100
Key Financials
50
Y/E
Sales
OPM PAT EPS ROE P/E P/BV EV/EBITDA EV/Sales
0
March
(` cr)
(%)
(` cr)
(`)
(%)
(x)
(x)
(x)
(x)
FY2017E
408
42.9
97
6.8
6.9
30.0
2.1
18.8
8.0
FY2018E
612
42.3
164
11.5
10.5
17.6
1.9
12.7
5.3
Source: Company, Angel Research
Source: Company, Angel Research
November 3, 2016
10
Top Picks Report | November 2016
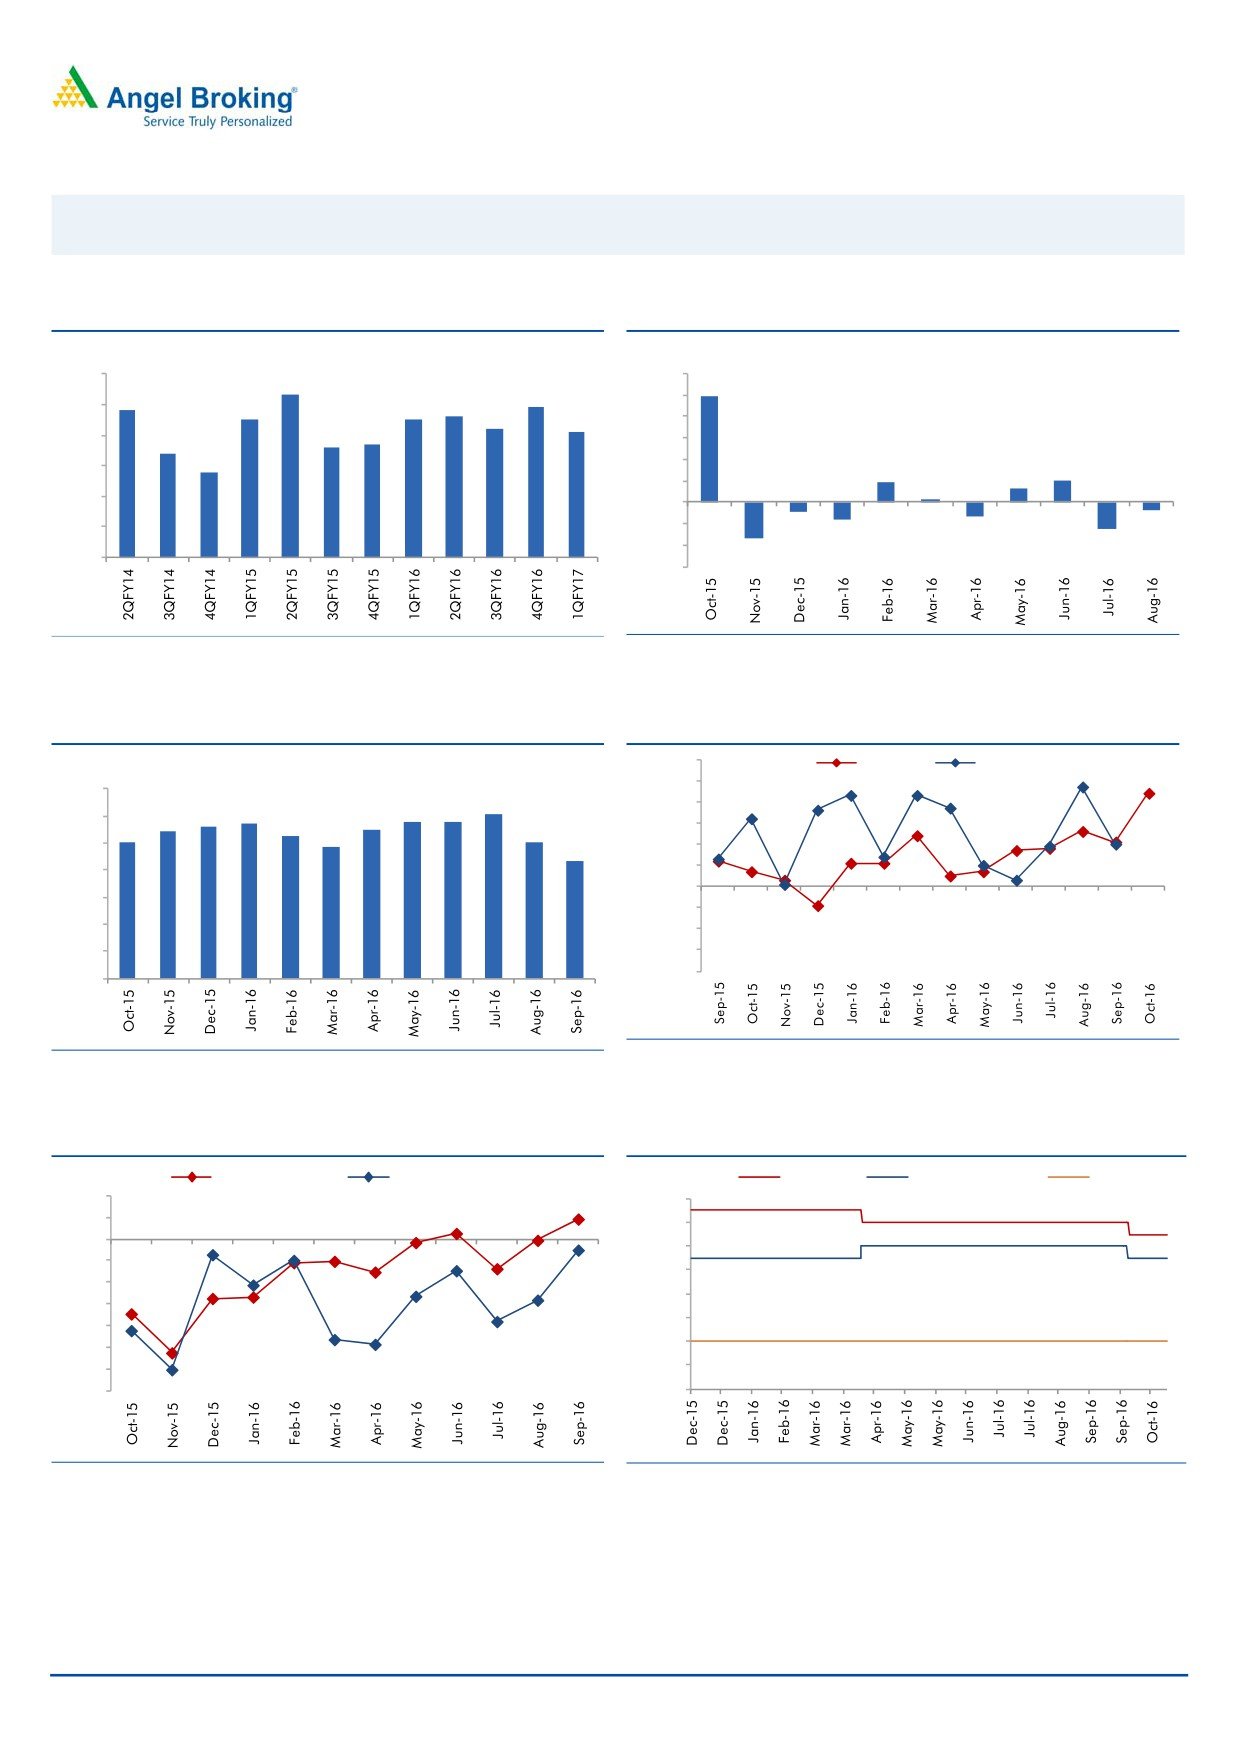
Macro watch
Exhibit 4: Quarterly GDP trends
Exhibit 5: IIP trends
(%)
(%)
9.0
12.0
8.3
9.9
7.8
7.9
10.0
8.0
7.5
7.5
7.6
7.2
7.1
8.0
6.6
6.7
7.0
6.4
6.0
5.8
6.0
4.0
1.9
2.0
1.3
2.0
0.3
5.0
-
4.0
(2.0)
(0.7)
(0.9)
(1.6)
(1.3)
(4.0)
(2.5)
3.0
(3.4)
(6.0)
Source: CSO, Angel Research
Source: MOSPI, Angel Research
Exhibit 6: Monthly CPI inflation trends
Exhibit 7: Manufacturing and services PMI
56.0
Mfg. PMI
Services PMI
(%)
55.0
7.0
6.1
5.7
5.8
5.8
54.0
5.6
5.5
6.0
5.4
5.3
5.0
5.1
53.0
4.8
5.0
4.3
52.0
51.0
4.0
50.0
3.0
49.0
2.0
48.0
1.0
47.0
46.0
-
Source: Market, Angel Research; Note: Level above 50 indicates expansion
Source: MOSPI, Angel Research
Exhibit 8: Exports and imports growth trends
Exhibit 9: Key policy rates
(%)
Exports yoy growth
Imports yoy growth
(%)
Repo rate
Reverse Repo rate
CRR
10.0
7.00
5.0
6.50
0.0
6.00
(5.0)
5.50
(10.0)
5.00
(15.0)
4.50
(20.0)
4.00
(25.0)
(30.0)
3.50
(35.0)
3.00
Source: Bloomberg, Angel Research
Source: RBI, Angel Research
November 3, 2016
11
Top Picks Report | November 2016
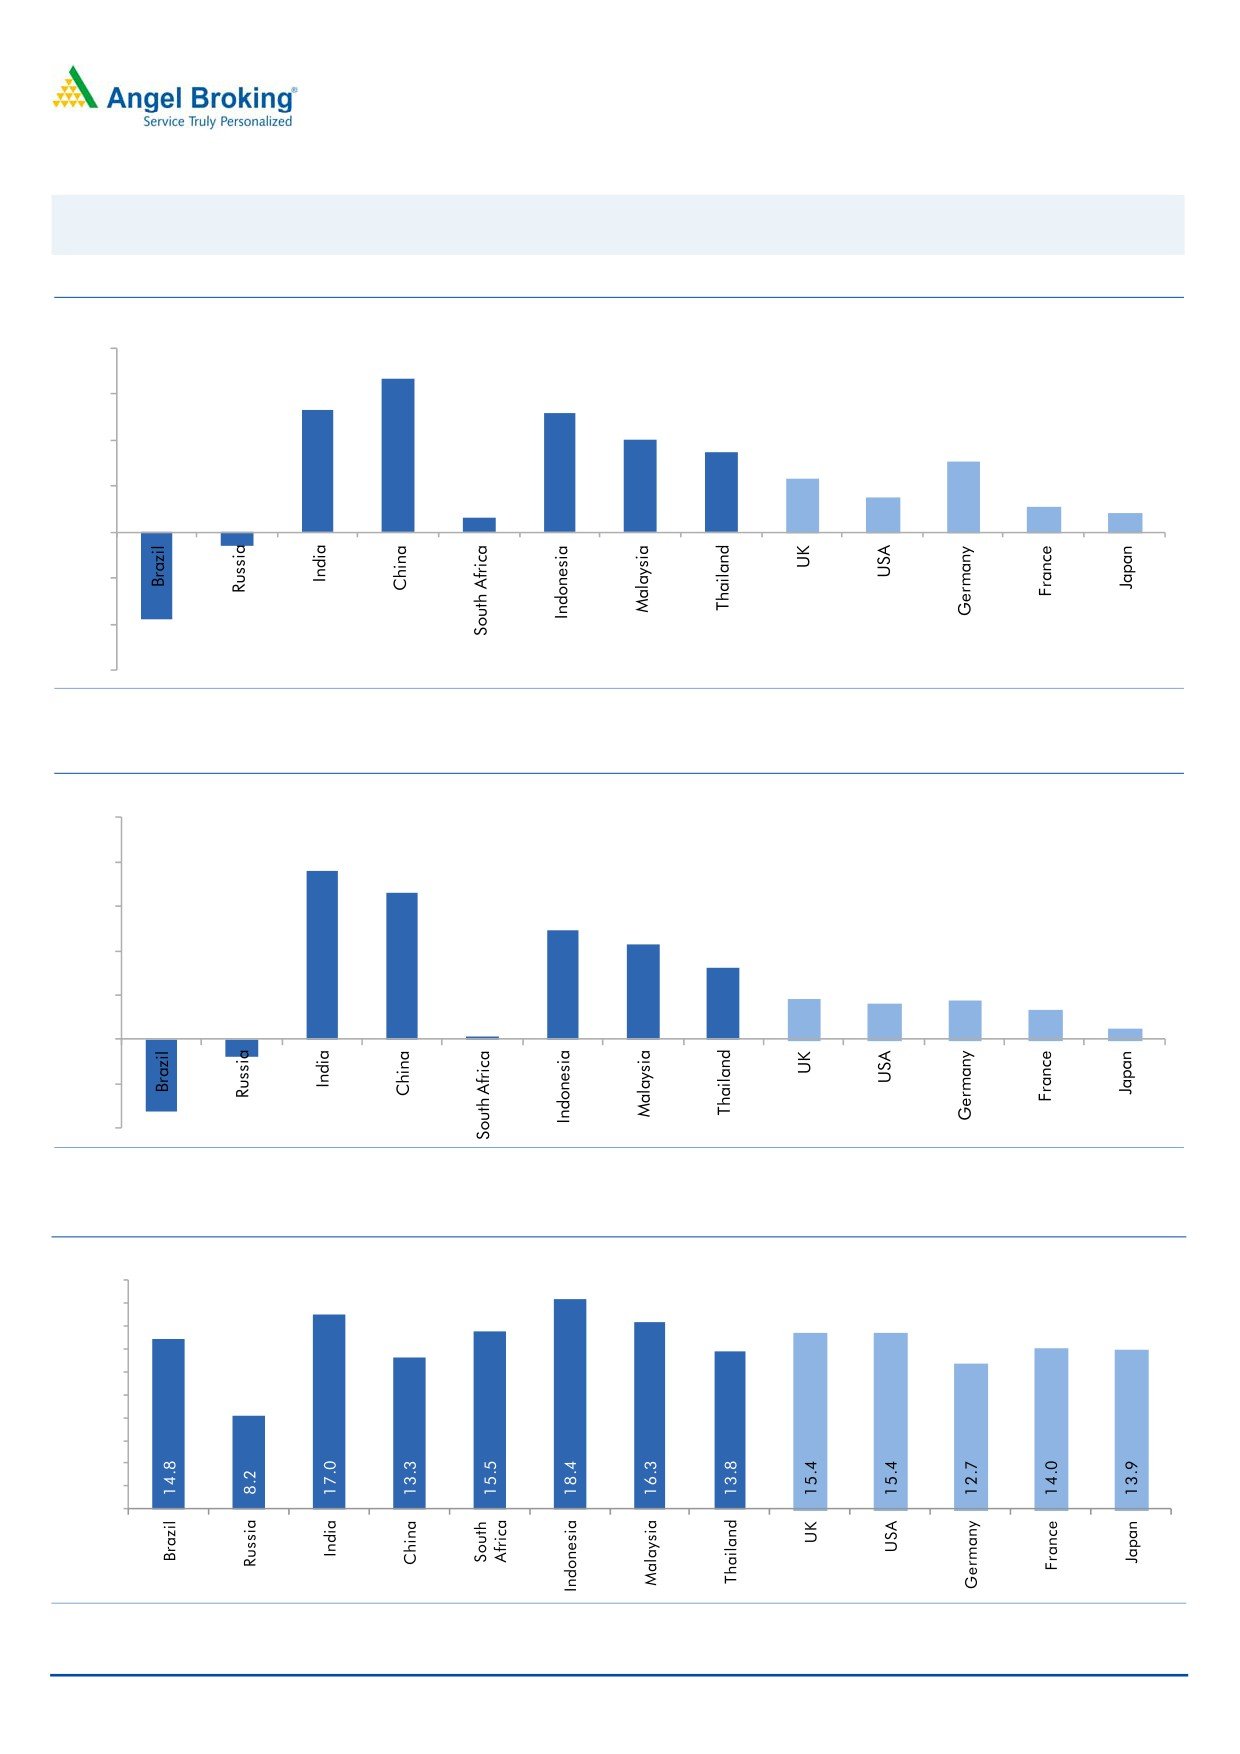
Global watch
Exhibit 10: Latest quarterly GDP Growth (%, yoy) across select developing and developed countries
(%)
8.0
6.7
6.0
5.3
0.6
5.2
4.0
3.5
4.0
3.1
2.3
1.5
2.0
1.1
0.8
-
(2.0)
(0.6)
(4.0)
(3.8)
(6.0)
Source: Bloomberg, Angel Research
Exhibit 11: 2016 GDP Growth projection by IMF (%, yoy) across select developing and developed countries
(%)
10.0
7.6
8.0
6.6
6.0
4.9
4.3
4.0
3.2
1.8
1.6
1.7
2.0
1.3
(0.8)
0.5
(3.3)
0.1
-
(2.0)
(4.0)
Source: IMF, Angel Research
Exhibit 12: One year forward P-E ratio across select developing and developed countries
(x)
20.0
18.0
16.0
14.0
12.0
10.0
8.0
6.0
4.0
2.0
-
Source: IMF, Angel Research
November 3, 2016
12
Top Picks Report | November 2016
Exhibit 13: Relative performance of indices across globe
Returns (%)
Country
Name of index
Closing price
1M
3M
1YR
Brazil
Bovespa
63,326
8.5
11.6
34.6
Russia
Micex
1,969
(0.1)
2.1
14.4
India
Nifty
8,514
(0.9)
(1.8)
3.1
China
Shanghai Composite
3,103
4.1
1.7
(9.1)
South Africa
Top 40
43,835
(2.9)
(3.9)
(9.4)
Mexico
Mexbol
47,303
0.1
1.6
4.3
Indonesia
LQ45
925
(2.0)
(0.2)
14.9
Malaysia
KLCI
1,660
0.4
0.4
(2.8)
Thailand
SET 50
938
(0.7)
(0.8)
2.6
USA
Dow Jones
17,960
(1.5)
(1.5)
0.7
UK
FTSE
6,845
(2.0)
3.2
7.5
Japan
Nikkei
17,135
4.2
3.4
(9.0)
Germany
DAX
10,371
(0.6)
2.7
(4.0)
France
CAC
4,415
(0.3)
2.1
(10.4)
Source: Bloomberg, Angel Research
November 3, 2016
13
Top Picks Report | November 2016
Stock Watch
November 3, 2016
14
Stock Watch | November 2016
Company Name
Reco
CMP
Target
Mkt Cap
Sales (` cr)
OPM (%)
EPS (`)
PER (x)
P/BV (x)
RoE (%)
EV/Sales (x)
(`)
Price (`)
(` cr)
FY17E
FY18E
FY17E
FY18E
FY17E
FY18E
FY17E
FY18E
FY17E
FY18E
FY17E
FY18E
FY17E
FY18E
Agri / Agri Chemical
Rallis
Neutral
216
-
4,208
1,937
2,164
13.3
14.3
9.0
11.0
24.0
19.7
4.2
3.7
18.4
19.8
2.2
1.9
United Phosphorus
Neutral
680
-
34,470
15,176
17,604
18.5
18.5
37.4
44.6
18.2
15.2
3.6
3.0
21.4
21.2
2.4
2.0
Auto & Auto Ancillary
Ashok Leyland
Buy
90
111
25,556
22,407
26,022
10.6
10.6
5.2
6.4
17.2
14.0
3.9
3.3
23.6
24.7
1.2
1.0
Bajaj Auto
Neutral
2,818
-
81,533
25,093
27,891
19.5
19.2
143.9
162.5
19.6
17.3
5.5
4.7
30.3
29.3
3.0
2.6
Bharat Forge
Neutral
852
-
19,838
7,726
8,713
20.5
21.2
35.3
42.7
24.1
20.0
4.5
4.0
18.9
20.1
2.6
2.3
Eicher Motors
Neutral
24,780
-
67,305
16,583
20,447
17.5
18.0
598.0
745.2
41.4
33.3
14.2
10.8
41.2
38.3
3.9
3.1
Gabriel India
Accumulate
121
130
1,739
1,544
1,715
9.0
9.3
5.4
6.3
22.4
19.2
4.2
3.7
18.9
19.5
1.1
1.0
Hero Motocorp
Accumulate
3,324
3,541
66,381
30,958
34,139
15.7
15.7
193.6
208.3
17.2
16.0
6.7
5.6
34.2
30.5
2.0
1.8
Jamna Auto Industries Neutral
225
-
1,794
1,486
1,620
9.8
9.9
15.0
17.2
15.0
13.1
3.3
2.8
21.8
21.3
1.3
1.2
L G Balakrishnan & Bros Neutral
684
-
1,074
1,302
1,432
11.6
11.9
43.7
53.0
15.7
12.9
2.2
2.0
13.8
14.2
0.9
0.8
Mahindra and Mahindra Neutral
1,369
-
85,049
46,534
53,077
11.6
11.7
67.3
78.1
20.3
17.5
3.3
2.9
15.4
15.8
1.8
1.5
Maruti
Neutral
5,799
-
175,164
69,186
82,217
14.7
14.4
198.5
241.4
29.2
24.0
5.7
4.6
20.2
19.9
2.2
1.8
Minda Industries
Neutral
384
-
3,050
2,728
3,042
9.0
9.1
68.2
86.2
5.6
4.5
1.3
1.0
23.8
24.3
1.2
1.0
Motherson Sumi
Neutral
323
-
45,358
45,896
53,687
7.8
8.2
13.0
16.1
24.8
20.1
8.0
6.4
34.7
35.4
1.1
0.9
Rane Brake Lining
Neutral
1,084
-
858
511
562
11.3
11.5
28.1
30.9
38.6
35.1
5.9
5.3
15.3
15.0
1.8
1.7
Setco Automotive
Neutral
42
-
562
741
837
13.0
13.0
15.2
17.0
2.8
2.5
0.5
0.4
15.8
16.3
1.1
1.0
Tata Motors
Neutral
514
-
148,402
300,209
338,549
8.9
8.4
42.7
54.2
12.0
9.5
1.9
1.6
15.6
17.2
0.6
0.5
TVS Motor
Neutral
401
-
19,030
13,390
15,948
6.9
7.1
12.8
16.5
31.4
24.2
7.8
6.2
26.3
27.2
1.5
1.2
Amara Raja Batteries
Buy
1,029
1,218
17,571
5,429
6,471
17.5
17.6
35.3
43.5
29.1
23.6
6.7
5.4
25.3
24.8
3.1
2.5
Exide Industries
Neutral
197
-
16,749
7,439
8,307
15.0
15.0
8.1
9.3
24.3
21.2
3.4
3.0
14.3
16.7
1.9
1.7
Apollo Tyres
Buy
199
235
10,145
12,877
14,504
14.3
13.9
21.4
23.0
9.3
8.7
1.4
1.3
16.4
15.2
0.9
0.9
Ceat
Buy
1,204
1,450
4,869
7,524
8,624
13.0
12.7
131.1
144.3
9.2
8.3
1.7
1.4
19.8
18.6
0.7
0.6
Indag Rubber
Neutral
189
-
497
286
326
19.8
16.8
11.7
13.3
16.2
14.2
2.7
2.6
17.8
17.1
1.4
1.2
JK Tyres
Neutral
143
-
3,246
7,455
8,056
15.0
15.0
21.8
24.5
6.6
5.8
1.4
1.1
22.8
21.3
0.6
0.5
Swaraj Engines
Neutral
1,375
-
1,708
660
810
15.2
16.4
54.5
72.8
25.2
18.9
7.9
7.1
31.5
39.2
2.4
1.9
Subros
Neutral
167
-
999
1,488
1,681
11.7
11.9
6.4
7.2
26.0
23.2
2.7
2.5
10.8
11.4
0.9
0.8
Banking
Axis Bank
Buy
476
630
113,538
46,932
53,575
3.5
3.4
32.3
44.6
14.7
10.7
1.9
1.64
13.6
16.5
-
-
Bank of Baroda
Neutral
150
-
34,539
19,980
23,178
1.8
1.8
11.5
17.3
13.0
8.7
1.5
1.2
8.3
10.1
-
-
Canara Bank
Neutral
294
-
15,972
15,225
16,836
1.8
1.8
14.5
28.0
20.3
10.5
1.4
1.1
5.8
8.5
-
-
Dewan Housing Finance Accumulate
317
350
9,926
2,225
2,688
2.9
2.9
29.7
34.6
10.7
9.2
1.7
1.5
16.1
16.8
-
-
Equitas Holdings
Buy
176
235
5,894
939
1,281
11.7
11.5
5.8
8.2
30.3
21.4
2.6
2.3
10.9
11.5
-
-
Federal Bank
Neutral
79
-
13,642
9,353
10,623
2.9
2.9
4.4
5.8
18.0
13.7
1.7
1.5
9.5
11.0
-
-
HDFC
Neutral
1,404
-
221,952
11,475
13,450
3.4
3.4
45.3
52.5
31.0
26.7
6.0
5.3
20.2
20.5
-
-
HDFC Bank
Accumulate
1,246
1,350
315,468
46,097
55,433
4.5
4.5
58.4
68.0
21.3
18.3
3.7
3.13
18.8
18.6
-
-
ICICI Bank
Neutral
272
-
158,194
39,029
45,903
3.3
3.3
16.7
16.3
16.3
16.7
2.0
1.8
10.1
12.4
-
-
LIC Housing Finance
Accumulate
573
630
28,930
3,712
4,293
2.6
2.5
39.0
46.0
14.7
12.5
2.8
2.4
19.9
20.1
-
-
November 3, 2016
15
Stock Watch | November 2016
Company Name
Reco
CMP
Target
Mkt Cap
Sales (` cr)
OPM (%)
EPS (`)
PER (x)
P/BV (x)
RoE (%)
EV/Sales (x)
(`)
Price (`)
(` cr)
FY17E
FY18E
FY17E
FY18E
FY17E
FY18E
FY17E
FY18E
FY17E
FY18E
FY17E
FY18E
FY17E
FY18E
Punjab Natl.Bank
Neutral
137
-
29,100
23,532
23,595
2.3
2.4
6.8
12.6
20.1
10.9
3.1
2.2
3.3
6.5
-
-
RBL Bank
Neutral
382
-
14,129
1,783
2,309
2.6
2.6
12.7
16.4
30.1
23.3
3.3
2.9
12.8
13.3
-
-
South Ind.Bank
Neutral
23
-
3,112
6,435
7,578
2.5
2.5
2.7
3.1
8.5
7.4
1.1
0.9
10.1
11.2
-
-
St Bk of India
Neutral
251
-
195,079
88,650
98,335
2.6
2.6
13.5
18.8
18.6
13.4
1.8
1.6
7.0
8.5
-
-
Union Bank
Neutral
139
-
9,562
13,450
14,925
2.3
2.3
25.5
34.5
5.5
4.0
0.8
0.7
7.5
10.2
-
-
Yes Bank
Neutral
1,211
-
50,974
8,978
11,281
3.3
3.4
74.0
90.0
16.4
13.5
3.1
2.6
17.0
17.2
-
-
Capital Goods
ACE
Neutral
56
-
551
709
814
4.1
4.6
1.4
2.1
39.8
26.5
1.6
1.5
4.4
6.0
0.9
0.8
BEML
Neutral
916
-
3,813
3,451
4,055
6.3
9.2
31.4
57.9
29.2
15.8
1.8
1.6
6.3
10.9
1.2
1.0
BGR Energy
Neutral
119
-
858
16,567
33,848
6.0
5.6
7.8
5.9
15.3
20.2
0.9
0.8
4.7
4.2
0.1
0.1
Bharat Electronics
Accumulate
1,302
1,414
31,244
8,137
9,169
16.8
17.2
58.7
62.5
22.2
20.8
3.4
3.1
44.6
46.3
2.8
2.5
BHEL
Neutral
137
-
33,606
28,797
34,742
-
2.8
2.3
6.9
59.7
19.9
1.0
1.0
1.3
4.8
0.8
0.6
Blue Star
Accumulate
557
634
5,307
4,283
5,077
5.9
7.3
14.9
22.1
37.4
25.1
7.3
6.1
20.4
26.4
1.3
1.1
Crompton Greaves
Neutral
77
-
4,835
5,777
6,120
5.9
7.0
3.3
4.5
23.4
17.1
1.0
1.0
4.4
5.9
0.8
0.7
Greaves Cotton
Neutral
137
-
3,351
1,755
1,881
16.8
16.9
7.8
8.5
17.6
16.1
3.5
3.3
20.6
20.9
1.6
1.4
Inox Wind
Neutral
218
-
4,827
5,605
6,267
15.7
16.4
24.8
30.0
8.8
7.3
2.4
1.8
25.9
24.4
0.9
0.8
KEC International
Neutral
123
-
3,160
9,294
10,186
7.9
8.1
9.9
11.9
12.4
10.3
1.8
1.6
15.6
16.3
0.6
0.5
Thermax
Neutral
851
-
10,137
5,421
5,940
7.3
7.3
25.7
30.2
33.1
28.2
4.0
3.7
12.2
13.1
1.7
1.6
VATech Wabag
Buy
489
681
2,664
3,136
3,845
8.9
9.1
26.0
35.9
18.8
13.6
2.4
2.0
13.4
15.9
0.7
0.6
Voltas
Accumulate
373
407
12,347
6,511
7,514
7.9
8.7
12.9
16.3
28.9
22.9
5.2
4.6
16.7
18.5
1.6
1.4
Cement
ACC
Neutral
1,491
-
27,995
11,225
13,172
13.2
16.9
44.5
75.5
33.5
19.7
3.2
2.9
11.2
14.2
2.5
2.1
Ambuja Cements
Neutral
241
-
47,775
9,350
10,979
18.2
22.5
5.8
9.5
41.5
25.3
3.5
3.1
10.2
12.5
5.1
4.4
India Cements
Neutral
155
-
4,763
4,364
4,997
18.5
19.2
7.9
11.3
19.6
13.7
1.4
1.4
8.0
8.5
1.8
1.6
JK Cement
Neutral
909
-
6,356
4,398
5,173
15.5
17.5
31.2
55.5
29.1
16.4
3.5
3.0
12.0
15.5
2.0
1.7
J K Lakshmi Cement
Buy
482
565
5,676
2,913
3,412
14.5
19.5
7.5
22.5
64.3
21.4
4.0
3.3
12.5
18.0
2.5
2.1
Orient Cement
Buy
171
215
3,503
2,114
2,558
18.5
20.5
8.1
11.3
21.1
15.1
3.1
2.6
9.0
14.0
2.3
1.8
UltraTech Cement
Neutral
3,895
-
106,892
25,768
30,385
21.0
23.5
111.0
160.0
35.1
24.3
4.5
3.9
13.5
15.8
4.2
3.5
Construction
Engineers India
Neutral
262
-
8,840
1,725
1,935
16.0
19.1
11.4
13.9
23.0
18.9
3.2
3.1
13.4
15.3
4.0
3.6
Gujarat Pipavav Port
Neutral
168
-
8,127
705
788
52.2
51.7
5.0
5.6
33.6
30.0
3.3
3.0
11.2
11.2
11.2
9.5
ITNL
Neutral
105
-
3,467
8,946
10,017
31.0
31.6
8.1
9.1
13.0
11.6
0.5
0.5
4.2
5.0
3.7
3.4
KNR Constructions
Accumulate
722
802
2,032
1,385
1,673
14.7
14.0
41.2
48.5
17.5
14.9
3.3
2.8
14.9
15.2
1.5
1.3
Larsen & Toubro
Buy
1,446
1,700
134,801
67,665
77,249
10.7
11.5
57.3
71.2
25.2
20.3
2.3
2.2
12.6
14.3
2.2
1.9
MEP Infra
Neutral
41
-
674
1,877
1,943
30.6
29.8
3.0
4.2
13.8
9.9
6.7
4.5
0.6
0.6
1.7
1.6
Nagarjuna Const.
Neutral
89
-
4,953
8,842
9,775
9.1
8.8
5.3
6.4
16.8
13.9
1.3
1.2
8.2
9.1
0.7
0.6
NBCC
Neutral
240
-
14,373
7,428
9,549
7.9
8.6
8.2
11.0
29.2
21.8
1.5
1.1
28.2
28.7
1.6
1.2
PNC Infratech
Buy
120
143
3,087
2,350
2,904
13.1
13.2
9.0
8.8
13.4
13.7
0.5
0.4
15.9
13.9
1.4
1.2
Power Mech Projects
Neutral
495
-
728
1,801
2,219
12.7
14.6
72.1
113.9
6.9
4.3
1.3
1.1
16.8
11.9
0.4
0.3
November 3, 2016
16
Stock Watch | November 2016
Company Name
Reco
CMP
Target
Mkt Cap
Sales (` cr)
OPM (%)
EPS (`)
PER (x)
P/BV (x)
RoE (%)
EV/Sales (x)
(`)
Price (`)
(` cr)
FY17E
FY18E
FY17E
FY18E
FY17E
FY18E
FY17E
FY18E
FY17E
FY18E
FY17E
FY18E
FY17E
FY18E
Sadbhav Engineering
Accumulate
269
298
4,606
3,598
4,140
10.3
10.6
9.0
11.9
29.8
22.6
3.1
2.7
9.9
11.9
1.6
1.3
Simplex Infra
Neutral
322
-
1,592
6,829
7,954
10.5
10.5
31.4
37.4
10.2
8.6
1.1
1.0
9.9
13.4
0.7
0.6
SIPL
Neutral
100
-
3,513
1,036
1,252
65.5
66.2
(8.4)
(5.6)
-
-
3.7
4.3
(22.8)
(15.9)
11.6
9.7
FMCG
Asian Paints
Neutral
1,062
-
101,872
17,128
18,978
16.8
16.4
19.1
20.7
55.6
51.3
19.3
18.2
34.8
35.5
5.9
5.3
Britannia
Accumulate
3,303
3,626
39,622
9,795
11,040
14.6
14.9
80.3
94.0
41.1
35.1
16.9
13.1
41.2
-
3.9
3.4
Colgate
Neutral
956
-
26,011
4,605
5,149
23.4
23.4
23.8
26.9
40.2
35.6
22.2
17.4
64.8
66.8
5.6
5.0
Dabur India
Neutral
294
-
51,772
8,315
9,405
19.8
20.7
8.1
9.2
36.3
32.0
10.1
8.4
31.6
31.0
5.9
5.2
GlaxoSmith Con*
Neutral
5,943
-
24,992
4,350
4,823
21.2
21.4
179.2
196.5
33.2
30.2
8.8
7.5
27.1
26.8
5.1
4.5
Godrej Consumer
Neutral
1,563
-
53,227
10,235
11,428
18.4
18.6
41.1
44.2
38.0
35.4
8.4
7.1
24.9
24.8
5.3
4.7
HUL
Neutral
841
-
182,110
35,252
38,495
17.8
17.8
20.6
22.4
40.8
37.6
38.9
33.4
95.6
88.9
5.0
4.6
ITC
Buy
237
284
286,440
40,059
44,439
38.3
39.2
9.0
10.1
26.4
23.4
7.4
6.4
27.8
27.5
6.6
6.0
Marico
Accumulate
269
300
34,648
6,430
7,349
18.8
19.5
6.4
7.7
42.0
34.9
12.7
10.7
33.2
32.5
5.2
4.5
Nestle*
Neutral
6,749
-
65,067
10,073
11,807
20.7
21.5
124.8
154.2
54.1
43.8
22.2
20.0
34.8
36.7
6.3
5.3
Procter & Gamble
Neutral
7,160
-
23,243
2,939
3,342
23.2
23.0
146.2
163.7
49.0
43.7
109.7
105.1
25.3
23.5
7.4
6.5
Tata Global
Neutral
135
-
8,517
8,675
9,088
9.8
9.8
7.4
8.2
18.2
16.5
2.1
2.0
7.9
8.1
0.9
0.8
IT
HCL Tech^
Buy
764
1,000
107,803
49,242
57,168
20.5
20.5
55.7
64.1
13.7
11.9
2.8
2.1
20.3
17.9
2.0
1.7
Infosys
Buy
981
1,249
225,353
68,350
77,326
27.0
27.0
62.5
69.4
15.7
14.1
3.3
3.1
21.3
21.6
2.7
2.4
TCS
Accumulate
2,304
2,620
454,075
119,025
133,308
27.6
27.6
131.2
145.5
17.6
15.8
5.7
5.2
32.4
33.1
3.6
3.2
Tech Mahindra
Buy
430
600
41,740
29,673
32,937
15.5
17.0
32.8
39.9
13.1
10.8
2.6
2.2
19.6
20.7
1.1
1.0
Wipro
Buy
458
590
111,315
55,440
60,430
18.1
18.1
35.9
39.9
12.8
11.5
2.3
2.1
19.0
19.3
1.7
1.6
Media
D B Corp
Neutral
381
-
7,005
2,297
2,590
27.4
28.2
21.0
23.4
18.2
16.3
4.2
3.7
23.7
23.1
2.8
2.5
Hindustan Media Ven.
Neutral
301
-
2,209
1,016
1,138
24.3
25.2
27.3
30.1
11.0
10.0
2.1
1.9
16.2
15.8
1.5
1.3
HT Media
Neutral
86
-
2,000
2,693
2,991
12.6
12.9
7.9
9.0
10.9
9.6
0.9
0.9
7.8
8.3
0.3
0.2
Jagran Prakashan
Buy
195
225
6,378
2,355
2,635
28.0
28.0
10.8
12.5
18.1
15.6
3.9
3.4
21.7
21.7
2.7
2.4
Sun TV Network
Neutral
534
-
21,048
2,850
3,265
70.1
71.0
26.2
30.4
20.4
17.6
5.2
4.6
24.3
25.6
7.0
6.0
TV Today Network
Accumulate
349
385
2,079
637
743
27.5
27.5
18.4
21.4
19.0
16.3
3.3
2.8
17.4
17.2
2.9
2.4
Metal
Coal India
Neutral
328
-
206,987
84,638
94,297
21.4
22.3
24.5
27.1
13.4
12.1
5.6
5.3
42.6
46.0
2.0
1.8
Hind. Zinc
Neutral
270
-
113,957
14,252
18,465
55.9
48.3
15.8
21.5
17.1
12.5
2.8
2.4
17.0
20.7
8.0
6.2
Hindalco
Neutral
156
-
32,286
107,899
112,095
7.4
8.2
9.2
13.0
17.0
12.0
0.8
0.8
4.8
6.6
0.8
0.8
JSW Steel
Neutral
1,634
-
39,494
53,201
58,779
16.1
16.2
130.6
153.7
12.5
10.6
1.7
1.5
14.0
14.4
1.5
1.3
NMDC
Neutral
138
-
54,852
6,643
7,284
44.4
47.7
7.1
7.7
19.5
18.0
1.7
1.6
8.8
9.2
6.0
5.4
SAIL
Neutral
51
-
21,229
47,528
53,738
(0.7)
2.1
(1.9)
2.6
-
19.8
0.6
0.5
(1.6)
3.9
1.3
1.2
Tata Steel
Neutral
414
-
40,174
121,374
121,856
7.2
8.4
18.6
34.3
22.2
12.1
1.4
1.3
6.1
10.1
1.0
0.9
Vedanta
Neutral
218
-
64,704
71,744
81,944
19.2
21.7
13.4
20.1
16.3
10.9
1.4
1.3
8.4
11.3
1.3
1.0
November 3, 2016
17
Stock Watch | November 2016
Company Name
Reco
CMP
Target
Mkt Cap
Sales (` cr)
OPM (%)
EPS (`)
PER (x)
P/BV (x)
RoE (%)
EV/Sales (x)
(`)
Price (`)
(` cr)
FY17E
FY18E
FY17E
FY18E
FY17E
FY18E
FY17E
FY18E
FY17E
FY18E
FY17E
FY18E
FY17E
FY18E
Oil & Gas
Cairn India
Neutral
241
-
45,184
9,127
10,632
4.3
20.6
8.8
11.7
27.4
20.6
0.9
0.9
3.3
4.2
6.4
5.3
GAIL
Neutral
429
-
54,392
56,220
65,198
9.3
10.1
27.1
33.3
15.8
12.9
1.4
1.3
9.3
10.7
1.2
1.0
Indian Oil Corp
Neutral
316
-
153,495
373,359
428,656
5.9
5.5
54.0
59.3
5.9
5.3
0.9
0.8
16.0
15.6
0.6
0.5
ONGC
Neutral
277
-
237,287
137,222
152,563
15.0
21.8
19.5
24.1
14.2
11.5
1.2
1.1
8.5
10.1
2.0
1.8
Reliance Industries
Neutral
1,024
-
332,043
301,963
358,039
12.1
12.6
87.7
101.7
11.7
10.1
1.2
1.1
10.7
11.3
1.6
1.3
Pharmaceuticals
Alembic Pharma
Neutral
673
-
12,679
3,483
4,083
20.2
21.4
24.3
30.4
27.7
22.1
6.3
5.0
25.5
25.3
3.6
3.0
Aurobindo Pharma
Accumulate
789
877
46,170
15,720
18,078
23.7
23.7
41.4
47.3
19.1
16.7
5.0
3.9
29.6
26.1
3.2
2.7
Cadila Healthcare
Neutral
405
-
41,503
11,126
13,148
22.0
22.0
17.1
20.0
23.7
20.3
6.1
4.8
28.8
26.6
3.7
3.1
Cipla
Neutral
559
-
44,903
15,378
18,089
17.4
18.4
21.6
27.2
25.9
20.5
3.3
2.9
13.7
15.2
3.1
2.6
Dishman Pharma
Neutral
245
-
3,961
1,718
1,890
22.7
22.8
9.5
11.3
25.8
21.7
2.5
2.3
10.1
10.9
2.8
2.4
Dr Reddy's
Neutral
3,258
-
53,991
16,043
18,119
23.1
24.7
126.0
157.8
25.9
20.6
3.8
3.3
15.7
17.1
3.3
2.9
GSK Pharma*
Neutral
2,813
-
23,824
3,528
3,811
16.6
18.8
51.8
59.4
54.3
47.4
14.5
14.5
26.3
30.6
6.5
6.1
Indoco Remedies
Neutral
282
-
2,597
1,112
1,289
18.2
18.2
13.2
15.6
21.3
18.1
3.8
3.2
19.2
19.2
2.4
2.1
Ipca labs
Neutral
596
-
7,520
3,303
3,799
15.3
15.3
17.3
19.7
34.5
30.3
3.0
2.7
9.1
9.4
2.4
2.1
Lupin
Buy
1,496
1,809
67,423
15,912
18,644
26.4
26.7
58.1
69.3
25.7
21.6
5.0
4.1
21.4
20.9
4.3
3.5
Sanofi India*
Neutral
4,256
-
9,802
2,357
2,692
17.3
17.3
153.5
169.2
27.7
25.2
4.7
3.8
25.8
28.4
3.8
3.1
Sun Pharma
Buy
715
944
172,006
31,129
35,258
30.0
30.9
28.0
32.8
25.5
21.8
3.9
3.3
18.7
18.9
5.1
4.3
Power
NTPC
Neutral
156
-
128,712
86,605
95,545
17.5
20.8
11.8
13.4
13.2
11.6
1.3
1.3
10.5
11.1
2.8
2.8
Power Grid
Neutral
175
-
91,631
25,763
29,762
74.3
73.1
14.8
17.3
11.8
10.1
1.8
1.6
16.9
17.5
7.8
7.4
Tata Power
Neutral
77
-
20,839
36,916
39,557
17.4
27.1
5.1
6.3
15.1
12.2
1.3
1.2
9.0
10.3
1.6
1.4
Real Estate
MLIFE
Buy
421
522
1,728
1,152
1,300
22.7
24.6
29.9
35.8
14.1
11.8
1.0
1.0
7.6
8.6
2.2
1.9
Telecom
Bharti Airtel
Neutral
310
-
123,720
105,086
114,808
34.5
34.7
12.2
16.4
25.4
18.9
1.7
1.6
6.8
8.4
2.1
1.8
Idea Cellular
Neutral
74
-
26,754
40,133
43,731
37.2
37.1
6.4
6.5
11.6
11.4
1.0
0.9
8.2
7.6
1.7
1.4
Others
Abbott India
Neutral
4,798
-
10,196
3,153
3,583
14.1
14.4
152.2
182.7
31.5
26.3
154.8
132.2
25.6
26.1
2.9
2.5
Asian Granito
Buy
267
351
799
1,071
1,182
12.1
12.4
12.7
16.0
21.0
16.7
2.0
1.8
9.5
10.7
1.0
0.9
Bajaj Electricals
Buy
261
306
2,632
5,099
5,805
5.6
5.9
11.4
14.6
22.9
17.9
3.1
2.7
13.4
15.1
0.5
0.4
Banco Products (India)
Neutral
215
-
1,540
1,353
1,471
12.3
12.4
14.5
16.3
14.8
13.2
20.5
18.5
14.5
14.6
1.1
1.0
Coffee Day Enterprises
Neutral
222
-
4,567
2,964
3,260
20.5
21.2
4.7
8.0
-
27.7
2.6
2.3
5.5
8.5
1.9
1.7
Competent Automobiles Neutral
193
-
118
1,137
1,256
3.1
2.7
28.0
23.6
6.9
8.2
37.0
33.5
14.3
11.5
0.1
0.1
Elecon Engineering
Neutral
64
-
702
1,482
1,660
13.7
14.5
3.9
5.8
16.5
11.1
3.9
3.6
7.8
10.9
0.8
0.7
Finolex Cables
Neutral
440
-
6,732
2,883
3,115
12.0
12.1
14.2
18.6
31.0
23.7
16.5
14.4
15.8
14.6
2.0
1.8
Garware Wall Ropes
Neutral
549
-
1,201
873
938
12.9
13.1
30.9
34.9
17.8
15.7
2.8
2.4
15.7
15.2
1.3
1.2
Goodyear India*
Neutral
788
-
1,817
1,598
1,704
10.4
10.2
49.4
52.6
15.9
15.0
73.6
64.6
18.2
17.0
0.8
0.7
November 3, 2016
18
Stock Watch | November 2016
Company Name
Reco
CMP
Target
Mkt Cap
Sales (` cr)
OPM (%)
EPS (`)
PER (x)
P/BV (x)
RoE (%)
EV/Sales (x)
(`)
Price (`)
(` cr)
FY17E
FY18E
FY17E
FY18E
FY17E
FY18E
FY17E
FY18E
FY17E
FY18E
FY17E
FY18E
FY17E
FY18E
Hitachi
Neutral
1,510
-
4,106
2,081
2,433
8.8
8.9
33.4
39.9
45.2
37.8
36.5
30.4
22.1
21.4
2.0
1.6
HSIL
Neutral
346
-
2,503
2,384
2,515
15.8
16.3
15.3
19.4
22.6
17.8
22.5
19.3
7.8
9.3
1.2
1.1
Interglobe Aviation
Neutral
940
-
33,870
21,122
26,005
14.5
27.6
110.7
132.1
8.5
7.1
50.8
36.3
168.5
201.1
1.6
1.2
Jyothy Laboratories
Neutral
354
-
6,432
1,440
2,052
11.5
13.0
8.5
10.0
41.7
35.4
10.1
9.3
18.6
19.3
4.7
3.3
Kirloskar Engines India
Neutral
345
-
4,996
2,554
2,800
9.9
10.0
10.5
12.1
32.9
28.5
13.8
13.0
10.7
11.7
1.6
1.4
Linc Pen & Plastics
Neutral
257
-
380
382
420
9.3
9.5
13.5
15.7
19.1
16.4
3.3
2.8
17.1
17.3
1.1
0.9
M M Forgings
Neutral
455
-
549
546
608
20.4
20.7
41.3
48.7
11.0
9.3
62.3
55.2
16.6
17.0
0.8
0.8
Manpasand Bever.
Neutral
709
-
4,057
836
1,087
19.6
19.4
16.9
23.8
42.0
29.8
5.0
4.4
12.0
14.8
4.6
3.4
Mirza International
Buy
91
113
1,095
1,024
1,148
18.0
18.0
6.9
8.0
13.2
11.4
2.2
1.9
16.6
16.2
1.3
1.1
MT Educare
Neutral
132
-
525
366
417
17.7
18.2
9.4
10.8
14.1
12.2
3.1
2.7
22.2
22.3
1.3
1.2
Narayana Hrudaya
Neutral
342
-
6,993
1,873
2,166
11.5
11.7
2.6
4.0
129.4
86.3
7.9
7.2
6.1
8.3
3.8
3.3
Navkar Corporation
Buy
203
265
2,893
408
612
42.9
42.3
6.8
11.5
30.0
17.6
2.1
1.9
6.9
10.5
8.0
5.3
Navneet Education
Neutral
109
-
2,591
1,062
1,147
24.0
24.0
6.1
6.6
17.9
16.4
3.7
3.2
20.5
19.8
2.5
2.3
Nilkamal
Neutral
1,704
-
2,543
1,995
2,165
10.7
10.4
69.8
80.6
24.4
21.1
97.4
84.6
16.6
16.5
1.3
1.1
Page Industries
Neutral
16,144
-
18,007
2,450
3,124
20.1
17.6
299.0
310.0
54.0
52.1
359.6
274.5
47.1
87.5
7.4
5.8
Parag Milk Foods
Neutral
312
-
2,606
1,919
2,231
9.3
9.6
9.4
12.9
33.0
24.1
5.1
4.2
15.5
17.5
1.5
1.3
Quick Heal
Neutral
247
-
1,731
408
495
27.3
27.0
7.7
8.8
31.9
28.1
3.0
3.0
9.3
10.6
3.4
2.8
Radico Khaitan
Neutral
139
-
1,853
1,659
1,802
13.0
13.2
6.3
7.4
22.0
18.9
1.9
1.8
8.6
9.3
1.6
1.4
Relaxo Footwears
Neutral
429
-
5,146
2,085
2,469
9.2
8.2
7.6
7.9
56.7
53.9
22.0
18.8
17.9
18.8
2.6
2.2
S H Kelkar & Co.
Neutral
311
-
4,498
1,036
1,160
15.1
15.0
6.1
7.2
50.9
43.3
5.4
5.0
10.7
11.5
4.2
3.7
Siyaram Silk Mills
Accumulate
1,554
1,714
1,457
1,799
2,040
11.6
11.7
104.9
122.4
14.8
12.7
2.4
2.1
16.4
16.4
1.0
0.9
Styrolution ABS India*
Neutral
636
-
1,119
1,440
1,537
9.2
9.0
40.6
42.6
15.7
14.9
40.0
36.4
12.3
11.6
0.7
0.6
Surya Roshni
Neutral
232
-
1,018
3,342
3,625
7.8
7.5
17.3
19.8
13.4
11.8
25.5
20.5
10.5
10.8
0.6
0.5
Team Lease Serv.
Neutral
994
-
1,699
3,229
4,001
1.5
1.8
22.8
32.8
43.7
30.3
4.7
4.1
10.7
13.4
0.4
0.3
The Byke Hospitality
Neutral
188
-
755
287
384
20.5
20.5
7.6
10.7
24.8
17.6
5.2
4.2
20.7
23.5
2.6
2.0
Transport Corporation
Neutral
183
-
1,399
2,671
2,911
8.5
8.8
13.9
15.7
13.2
11.7
1.8
1.6
13.7
13.8
0.6
0.6
TVS Srichakra
Neutral
3,792
-
2,903
2,304
2,614
13.7
13.8
231.1
266.6
16.4
14.2
426.1
335.5
33.9
29.3
1.3
1.1
UFO Moviez
Neutral
481
-
1,327
619
685
33.2
33.4
30.0
34.9
16.0
13.8
2.2
1.9
13.8
13.9
1.8
1.5
Visaka Industries
Neutral
219
-
349
1,051
1,138
10.3
10.4
21.0
23.1
10.4
9.5
28.1
26.3
9.0
9.2
0.6
0.6
VRL Logistics
Neutral
281
-
2,566
1,902
2,119
16.7
16.6
14.6
16.8
19.3
16.7
4.2
3.7
21.9
22.2
1.5
1.3
Wonderla Holidays
Neutral
375
-
2,121
287
355
38.0
40.0
11.3
14.2
33.2
26.4
4.8
4.2
21.4
23.9
7.1
5.7
Source: Company, Angel Research, Note: *December year end; #September year end;
&October year end; ^June year end; Price as of November 2, 2016
November 3, 2016
19
Top Picks Report | November 2016
Research Team Tel: 022 - 39357800
DISCLAIMER
Angel Broking Private Limited (hereinafter referred to as “Angel”) is a registered Member of National Stock Exchange of India Limited,
Bombay Stock Exchange Limited and Metropolitan Stock Exchange Limited. It is also registered as a Depository Participant with CDSL
and Portfolio Manager with SEBI. It also has registration with AMFI as a Mutual Fund Distributor. Angel Broking Private Limited is a
registered entity with SEBI for Research Analyst in terms of SEBI (Research Analyst) Regulations, 2014 vide registration number
INH000000164. Angel or its associates has not been debarred/ suspended by SEBI or any other regulatory authority for accessing
/dealing in securities Market. Angel or its associates/analyst has not received any compensation / managed or co-managed public
offering of securities of the company covered by Analyst during the past twelve months.
This document is solely for the personal information of the recipient, and must not be singularly used as the basis of any investment
decision. Nothing in this document should be construed as investment or financial advice. Each recipient of this document should
make such investigations as they deem necessary to arrive at an independent evaluation of an investment in the securities of the
companies referred to in this document (including the merits and risks involved), and should consult their own advisors to determine
the merits and risks of such an investment.
Reports based on technical and derivative analysis center on studying charts of a stock's price movement, outstanding positions and
trading volume, as opposed to focusing on a company's fundamentals and, as such, may not match with a report on a company's
fundamentals. Investors are advised to refer the Fundamental and Technical Research Reports available on our website to evaluate the
contrary view, if any.
The information in this document has been printed on the basis of publicly available information, internal data and other reliable
sources believed to be true, but we do not represent that it is accurate or complete and it should not be relied on as such, as this
document is for general guidance only. Angel Broking Pvt. Limited or any of its affiliates/ group companies shall not be in any way
responsible for any loss or damage that may arise to any person from any inadvertent error in the information contained in this report.
Angel Broking Pvt. Limited has not independently verified all the information contained within this document. Accordingly, we cannot
testify, nor make any representation or warranty, express or implied, to the accuracy, contents or data contained within this document.
While Angel Broking Pvt. Limited endeavors to update on a reasonable basis the information discussed in this material, there may be
regulatory, compliance, or other reasons that prevent us from doing so.
This document is being supplied to you solely for your information, and its contents, information or data may not be reproduced,
redistributed or passed on, directly or indirectly.
Neither Angel Broking Pvt. Limited, nor its directors, employees or affiliates shall be liable for any loss or damage that may arise from
or in connection with the use of this information.
Ratings (Based on expected returns
Buy (> 15%)
Accumulate (5% to 15%)
Neutral (-5 to 5%)
over 12 months investment period):
Reduce (-5% to -15%)
Sell (< -15)