Angel Top Picks - December 2017
The 6.3% GDP growth in 2QFY2018 indicates that growth in the economy is
Top Picks
rebounding, and we believe that, Indian economy is primed for growth with
Company
CMP (`) TP (`)
implementation of GST reform, strong macros and uptick in the global economy.
Banking/NBFC
Our belief in the India story continues to remain strong with positive sales data
Dewan Housing
585
712
reported by the automobile companies (strong consumption trend) as well as
GIC Housing Finance
408
655
change in the FII’s position on India. Angel Broking’s Top Picks Portfolio continues
Karur Vysya Bank
113
161
to perform well with 38% alpha generated over BSE 100 during the last two years.
Consumption
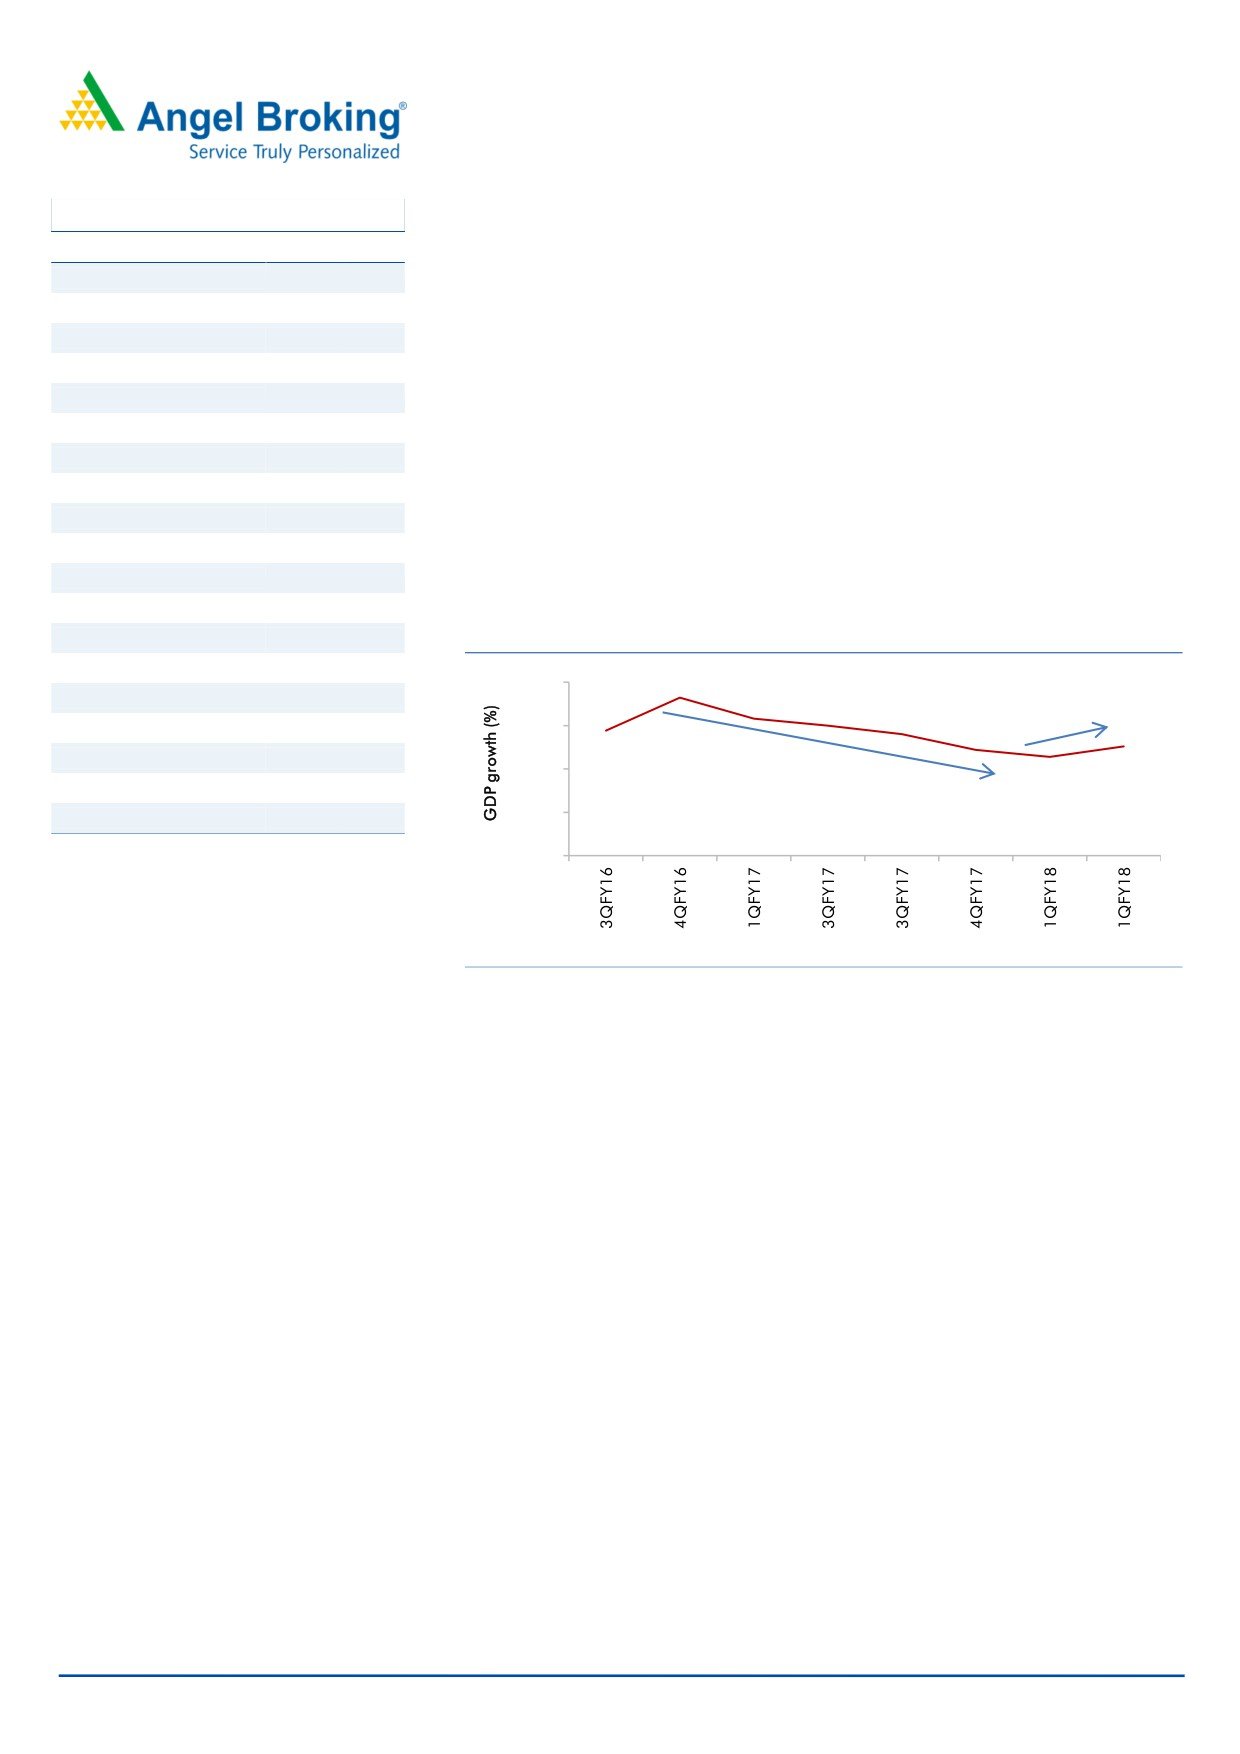
GDP data indicates rebound in the economy - The 2QFY18 GDP growth came in
Asian Granito
490
570
at
6.3%% vs. cons. of
6.4%. While this was slightly below the consensus
Blue Star
760
867
expectations, the data clearly shows rebound in the domestic economy. India’s
Siyaram Silk Mills
721
757
GDP growth has been consistently weak for the last five quarters, particularly the
LT Foods
73
96
last three quarters due to demonetization and GST implementation. we believe that
Century Plyboards
308
400
with 6.3% growth in the economy, the growth trajectory is ahead of us and in our
Media/Automobiles
view, we are gearing up for a 7-8% GDP growth from FY2019 onwards.
Maruti Suzuki
8,600
9,495
Music Broadcast
384
434
Exhibit 1: Rebound in domestic economy
TV Today
392
435
10
Rebound in the
Real Estate/Infra/Logistics/Power
GDP growth
KEI Industries
384
425
7.5
Navkar Corp.
181
265
5
Pharmaceutical
Consistently weak GDP growth
2.5
for last 5 quarters
Alkem Laboratories
2,080
2,287
Source: Angel Research;
0
Note: CMP as of December 06, 2017
Source: Company, Angel Research
Rating upgrade, key highlight of the year - With the slew of reforms and strong
improvement in the macros, India’s sovereign rating upgrade was due for some
time now. A one notch rating upgrade by Moody’s Investors Service (from Baa3 to
Baa2), stamps the strengthening of the Indian economy. Though this does not
change anything drastically, this, we believe is likely to result in improved investor
sentiment. Underlying thought remains that the economy is in well shape, which is
positive to support the market valuations.
Auto sales indicate strong domestic consumption demand - The November auto
sales lay a clear picture of strong consumption demand in the country. The PV
sales of top seven companies grew by 18.5% yoy while CV sales of the top three
companies grew by 64.2% yoy. The 2W+3W sales of top four companies grew by
21.5% yoy. The tractor volumes also grew in double digits. Overall, auto sector
witnessed strong performance in all quarters.
Reversal in FIIs mood - While DIIs had continued to buy domestic equities, FII
inflows had not shown big revival since March-17, when they invested `30,906cr
in the single month. The November FII inflows were at `19,728cr (highest since
March-17), which would have been triggered due to sovereign rating upgrade by
Moody’s. This we believe improves the sentiment in the market further.
We continue to remain bullish on the markets and accordingly we retain our
stock recommendations. We add Century Plyboards in the portfolio, as we
believe it will benefit from its MDF plant due to the affordable housing scheme.
Please refer to important disclosures at the end of this report
1
Top Picks Report | December 2017
Top Picks
December 6, 2017
2
Top Picks Report | December 2017
Stock Info
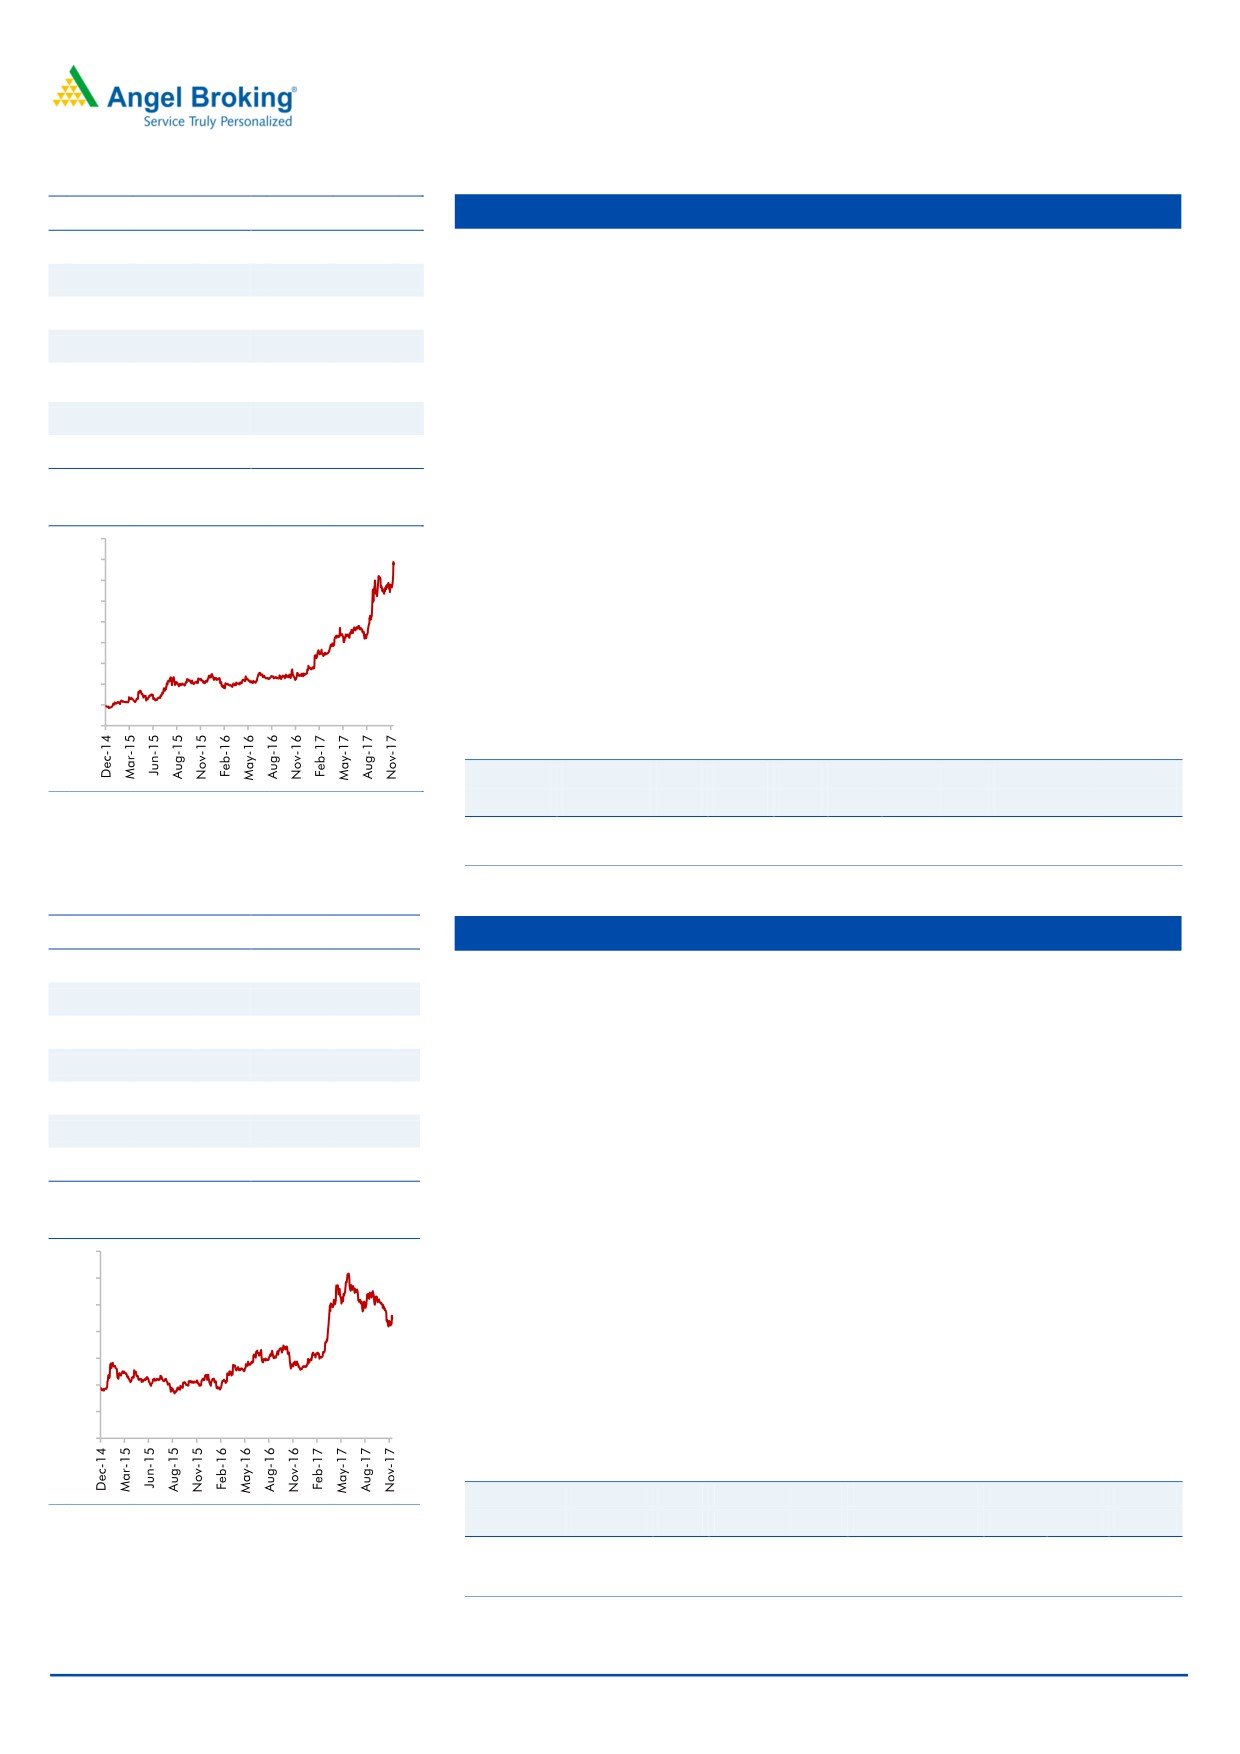
Dewan Housing
CMP
585
Loan growth to remain strong going ahead: Backed by healthy capital
TP
712
adequacy and increasing demand for home loans DHFL’s loan book is
Upside
21.7%
expected to report 23% loan growth over next two three years.
Sector
Financials
Strong Capital adequacy lends visibility for growth: DHFL sold 50% stake held
Market Cap (` cr)
18,367
by it in DFHFL Pramerica Life Insurance Co Ltd which added `1,969 cr to its
Beta
1.6
net worth and increases its CAR by 400 bps, to 19.3% which should fuel
52 Week High / Low
679 / 213
growth for next 2-3 years.
Asset quality has been strong: Strong NIM on the back of lower cost of funds
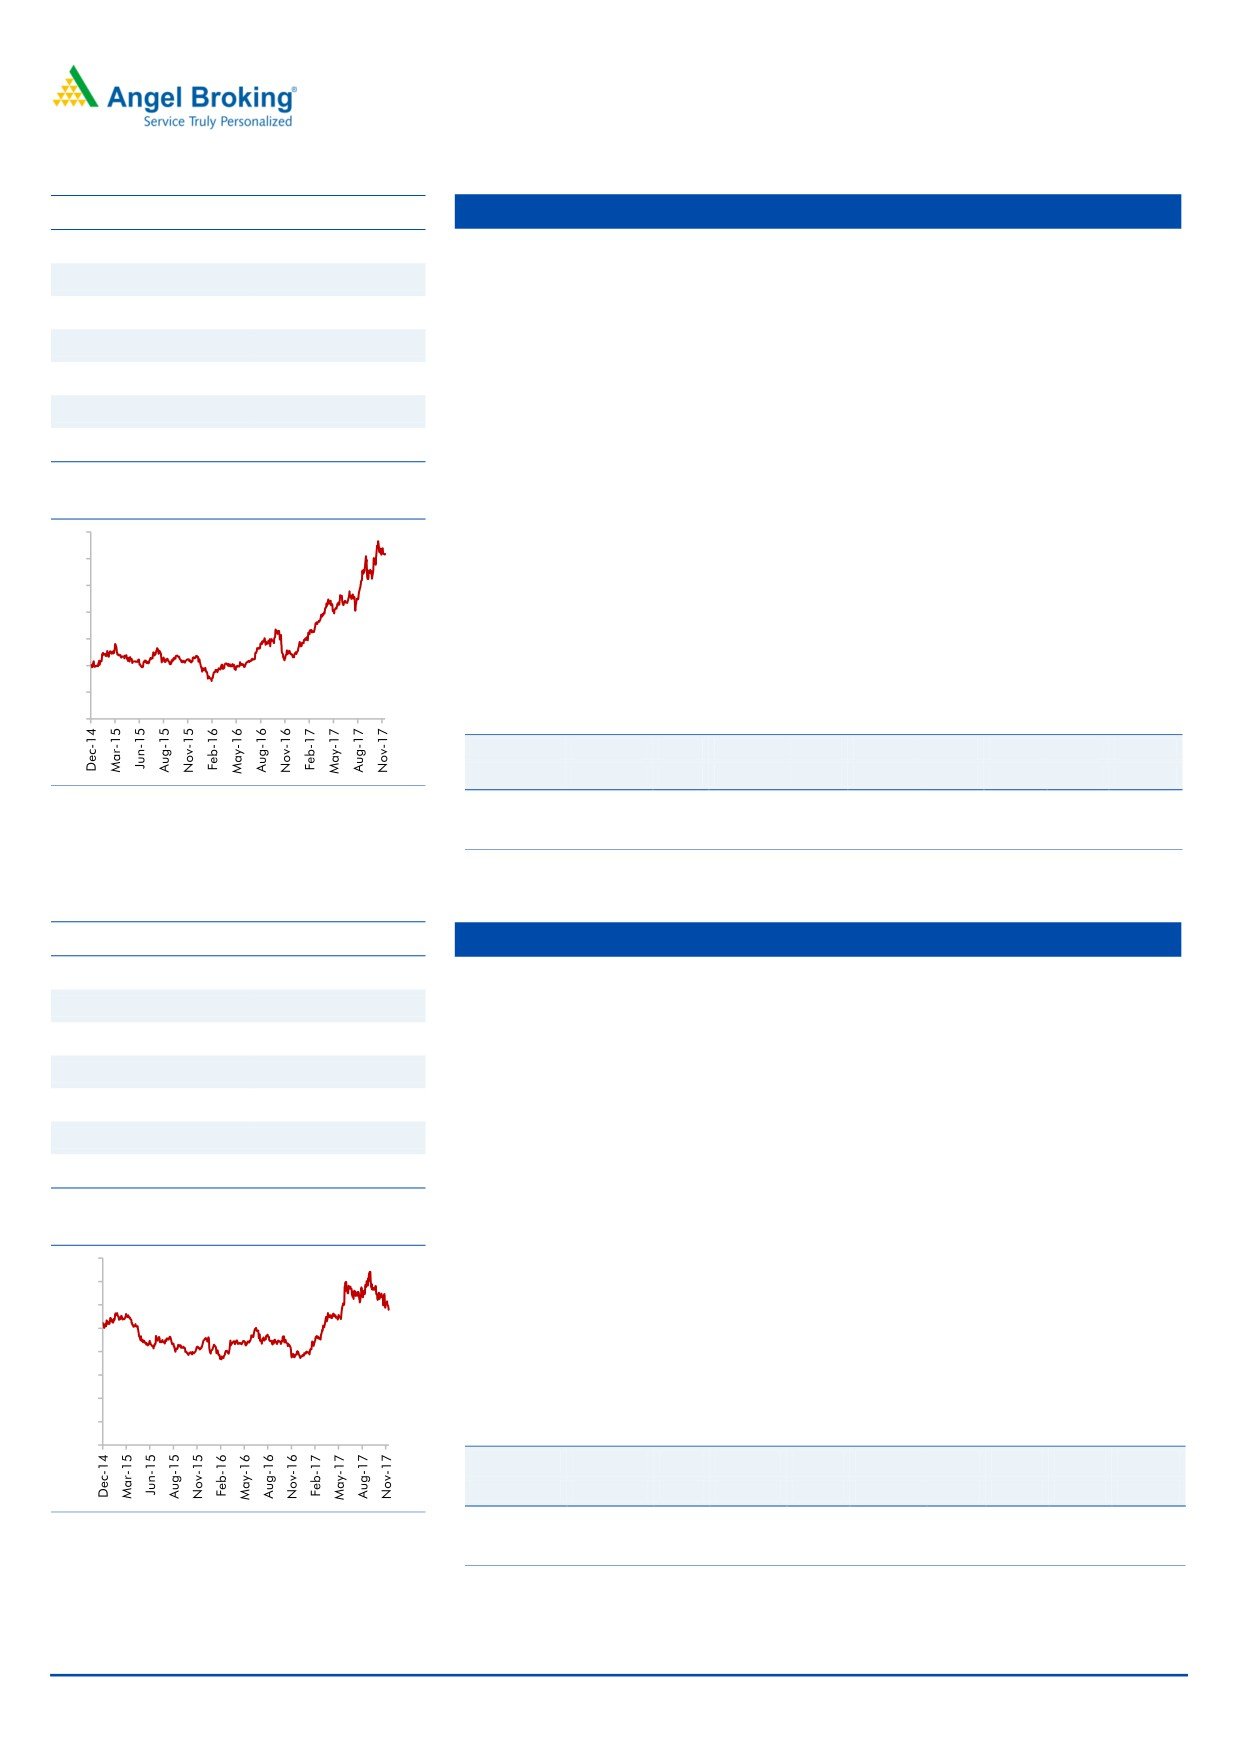
3 year-Chart
and lower credit cost will ensure healthy return ratios for the company. Despite
700
strong growth the company has maintained stable asset quality and we expect
600
the trend to continue.
500
Outlook: We expect the company’s loan growth to remain 23% over next two
400
years and earnings growth is likely to be more than 28%.The stock currently
300
trades at 1.9x FY2019E ABV. We maintain Buy on the stock with a target price of
200
`712.
100
-
Key Financials
Y/E
Op. Inc
NIM
PAT
EPS
ABV
ROA
ROE
P/E
P/ABV
March
(` cr)
(%)
(` cr)
(`)
(`)
(%)
(%)
(x)
(x)
Source: Company, Angel Research
FY2018E
2,279
2.4
1,171
37.4
268
1.3
13.8
15.6
2.2
FY2019E
2,927
2.7
1,556
49.7
305
1.5
16.2
11.8
1.9
Source: Company, Angel Research
Stock Info
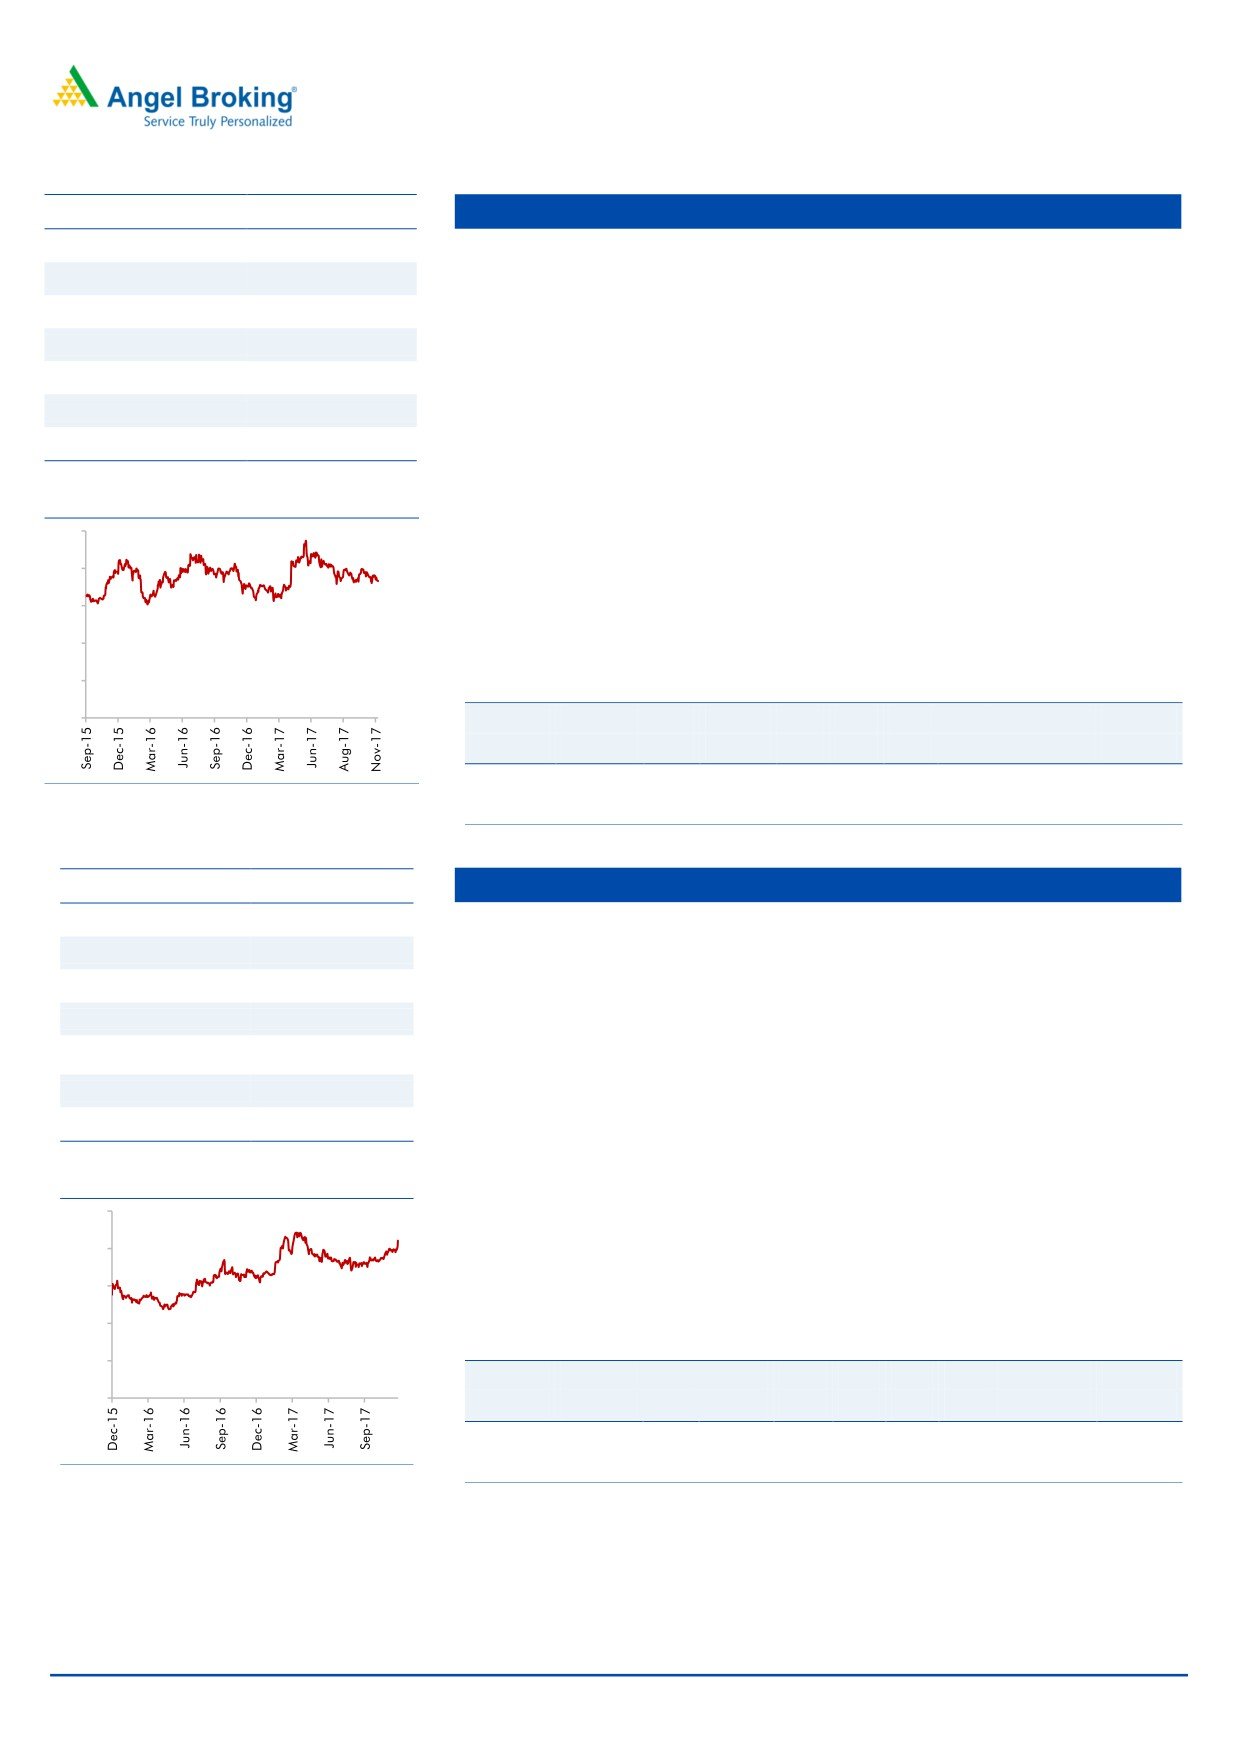
Karur Vysa Bank
CMP
113
Loan growth to pick up from FY18 onwards: KVB had a fairly strong loan
TP
161
CAGR of 14.9% over FY11-17.However, FY17 was year of consolidation and
Upside
42.5%
loan book grew by only 4.7%. We expect loan growth to pick up to 11% over
Sector
Banking
FY17-19. Deposit growth is expected at 9% during the period.
Market Cap (` cr)
8,260
Asset quality likely to stabilize going ahead: KVB’s slippages remained high
during FY17 and hence GNPAs % went up to 3.58% vs 1.3%. However, large
Beta
0.9
part of the troubled accounts has been classified as NPAs and hence gradually
52 Week High / Low
150 / 74
we expect the asset quality to improve. While in Q1FY18 we saw some
pressure on asset quality, it still remained fairly under control.
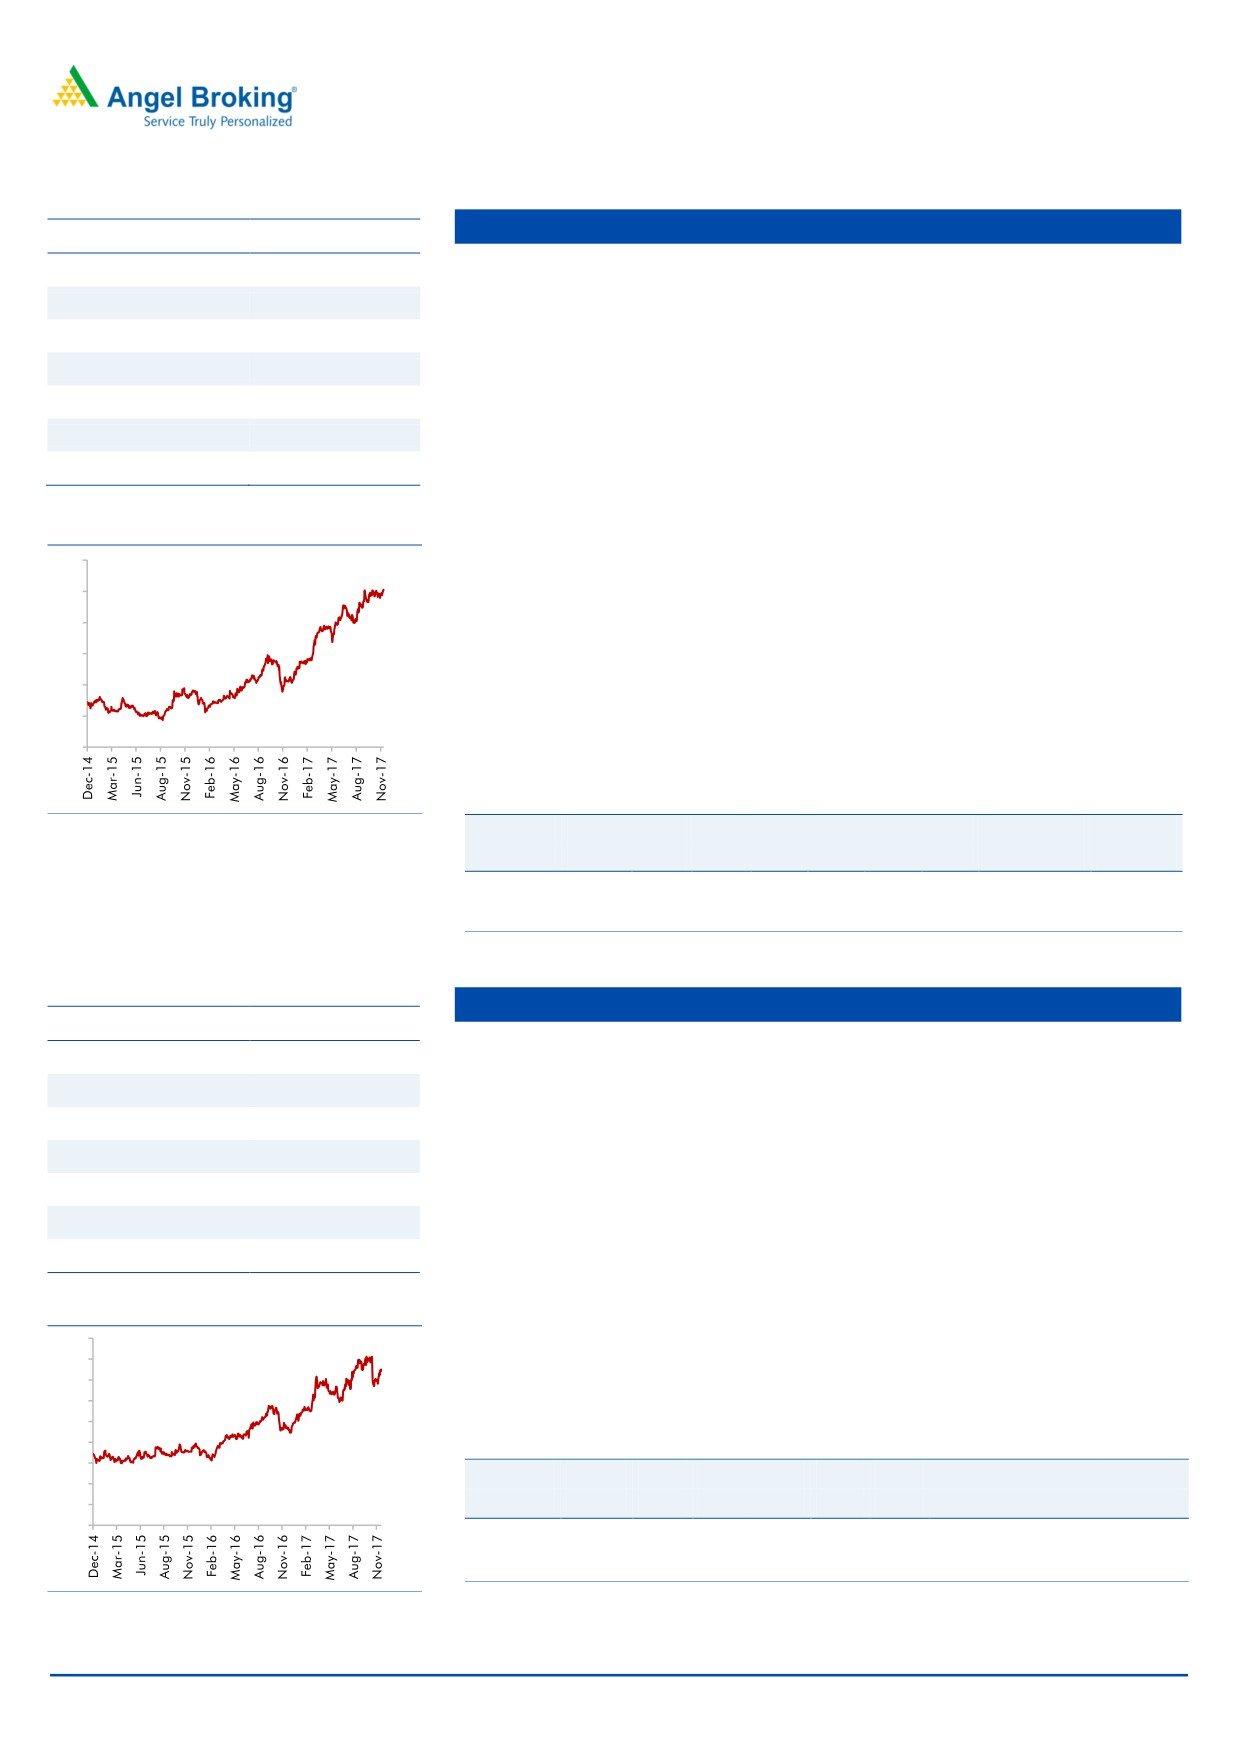
3 year-Chart
NIM likely to see further improvement: There were 25 bps improvements in
160
NIM during FY17, with share of CASA growing and cost of fund coming down
140
NIM is expected to improve further going ahead.
120
100
Outlook: We expect KVB to post a strong loan book & earnings CAGR of 11%
80
& 22% over FY2017-19E. The stock currently trades at 1.3x FY2019E ABV. We
60
have a BUY rating on the stock.
40
20
Key Financials
-
Y/E
Op. Inc
NIM
PAT
EPS
ABV
ROA
ROE
P/E
P/ABV
March
(` cr)
(%)
(` cr)
(`)
(`)
(%)
(%)
(x)
(x)
FY2018E
2,388
3.7
660
10.8
77.8
1
12.5
10.5
1.5
Source: Company, Angel Research
FY2019E
2,757
3.9
858
14.1
89.6
1.2
14.7
8.1
1.3
Source: Company, Angel Research
December 6, 2017
3
Top Picks Report | December 2017
Asian Granito
Stock Info
CMP
490
AGIL’s current, vitrified sales (35%) are lower as compared to its peers like
Somany Ceramics (47%) and Kajaria Ceramics (61%). Recently, AGIL has
TP
570
launched various products in premium segment. Going forward, we expect
Upside
16%
AGIL’s profit margin to improve due to increase in focus for higher vitrified
Sector
Cons. Durable
product sales, which is a high margin business.
Market Cap (` cr)
1,475
AGIL is continuously putting efforts to increase the B2C sales from the current
Beta
1.2
level (35-36% in FY17). It is expected to reach up to 50% in next 2-3 years on
52 Week High / Low
532 / 176
the back of various initiatives taken by AGIL to increase direct interaction with
customers like strengthening distribution network, participation in key trade
exhibition, etc.
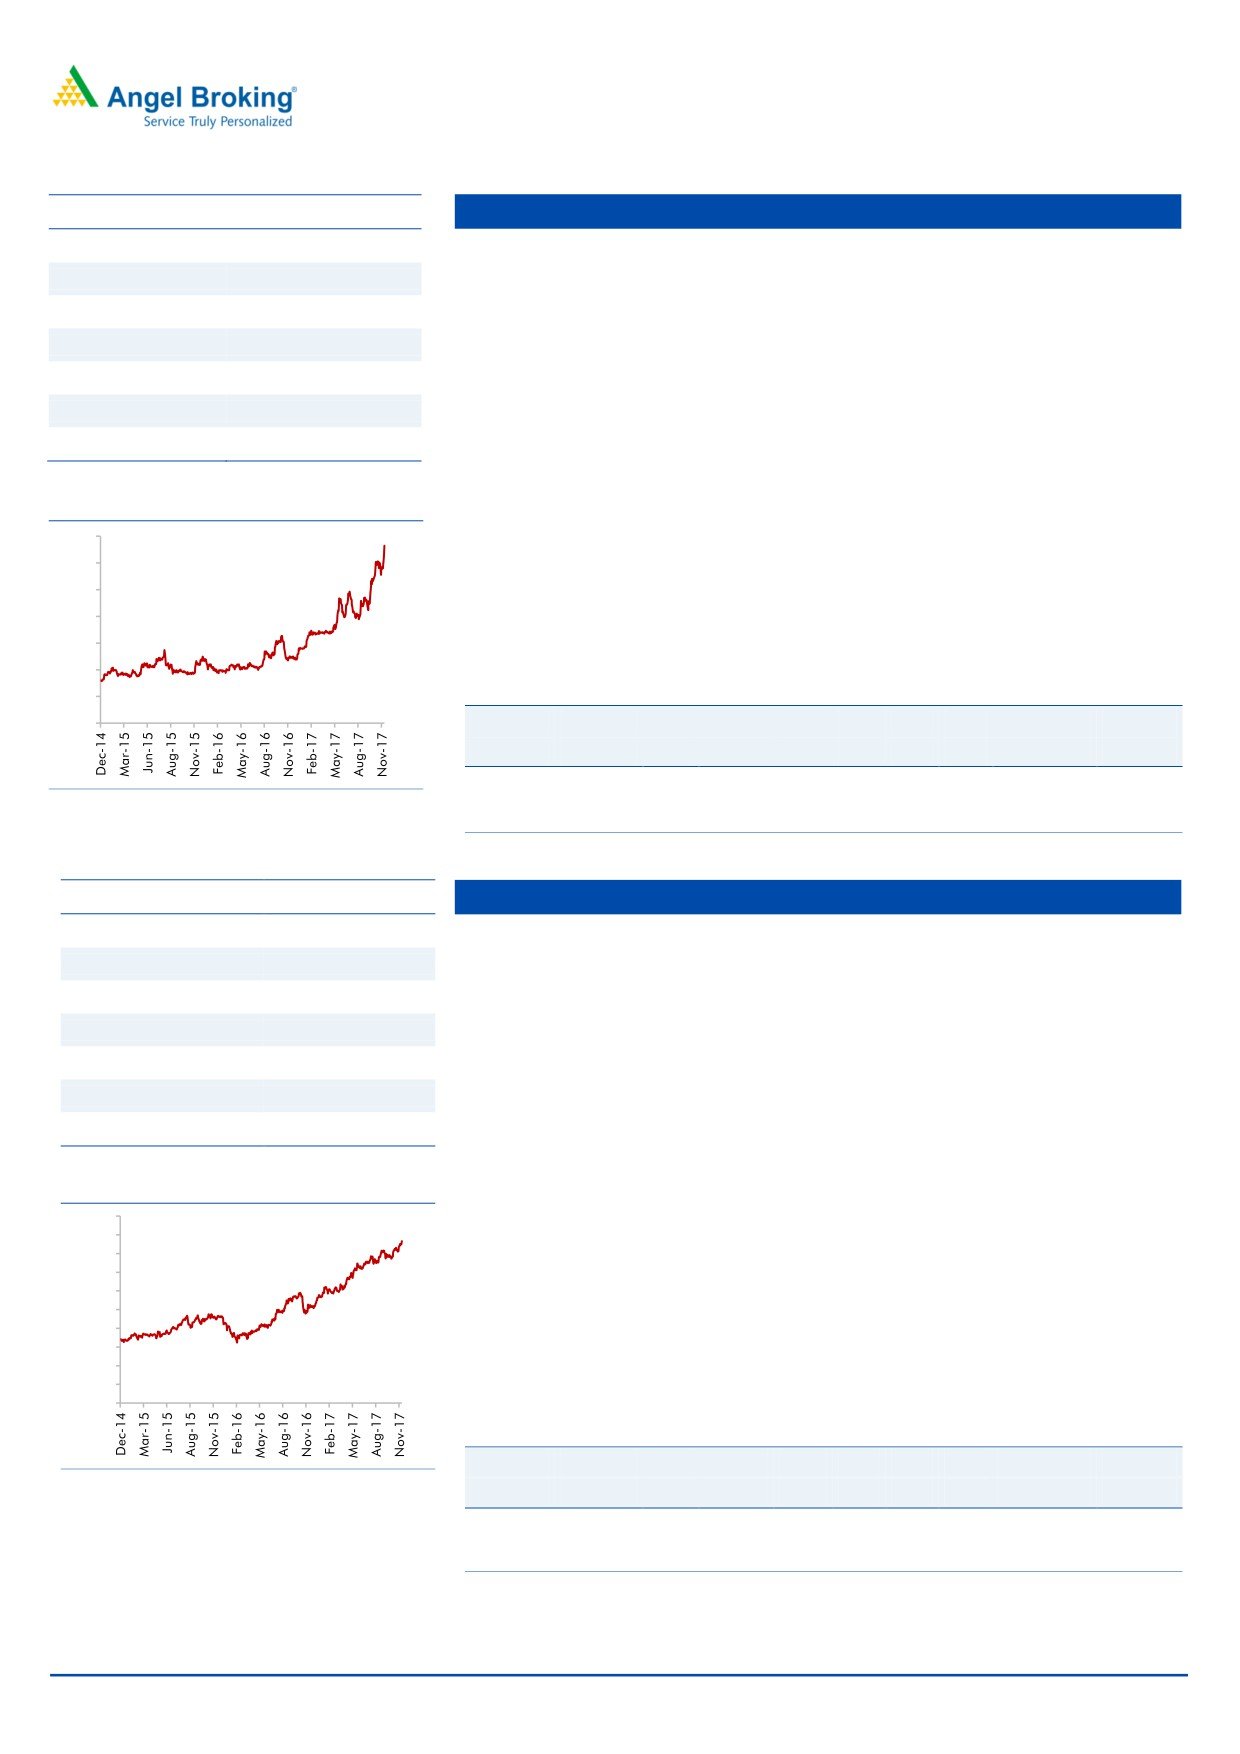
3 year-Chart
In July FY2016, AGIL acquired Artistique Ceramic which has a better margin
600
profile. Going forward, we expect the company to improve its operating
500
margin from 7.5% in FY16 (excluding merger) to
13-13.5% in coming
400
financial year. Artisique Ceramics has a contract with RAS GAS to supply
300
quality natural gas at a discounted rate of 50% to current market rate, which
200
would reduce the overall power & fuel cost of the company.
100
We expect AGIL to report a net revenue CAGR of ~10% to ~`1,286cr and net
profit CAGR of ~29% to `65cr over FY2017-19E. We recommend a Buy
-
rating on the stock.
Key Financials
Source: Company, Angel Research
Y/E
Sales
OPM
PAT
EPS
ROE
P/E
P/BV
EV/EBITDA
EV/Sales
March
(` cr)
(%)
(` cr)
(`)
(%)
(x)
(x)
(x)
(x)
FY2018E
1,140
13.1
49
16.3
10.9
30.1
3.3
11.6
1.5
FY2019E
1,286
13.3
65
21.6
12.6
22.7
2.9
9.9
1.3
Source: Company, Angel Research
Blue Star
Stock Info
CMP
760
BSL is one of the largest air-conditioning companies in India. With a mere 3%
penetration level of ACs vs 25% in China, the overall outlook for the room air-
TP
867
conditioner (RAC) market in India is favourable.
Upside
14%
BSL's RAC business has been outgrowing the industry by ~10% points over the
Sector
Cons. Durable
last few quarters, resulting in the company consistently increasing its market
Market Cap (` cr)
7,280
share. This has resulted in the Cooling Products Division (CPD)'s share in
Beta
0.4
overall revenues increasing from~23% in FY2010 to ~45% in FY2017
52 Week High / Low
826 / 436
(expected to improve to ~47-48% in FY2018E). With strong brand equity and
higher share in split ACs, we expect the CPD to continue to drive growth.
3 year-Chart
Aided by increasing contribution from the Unitary Products, we expect the
900
overall top-line to post a revenue CAGR of ~19% over FY2017-19E and
800
700
margins to improve from
5.8% in FY2017 to
6.6% in FY2019E. We
600
recommend a buy rating on the stock.
500
400
Key Financials
300
Y/E
Sales
OPM
PAT
EPS
ROE
P/E
P/BV
EV/EBITDA
EV/Sales
200
100
March
(` cr)
(%)
(` cr)
(`)
(%)
(x)
(x)
(x)
(x)
-
FY2018E
5,220
6.3
161
16.8
19.0
45.2
9.0
23.3
1.5
FY2019E
6,207
6.6
214
22.3
23.3
34.1
7.9
18.7
1.2
Source: Company, Angel Research
Source: Company, Angel Research
December 6, 2017
4
Top Picks Report | December 2017
Stock Info
Siyaram Silk Mills
CMP
721
SSML has strong brands which cater to premium as well as popular mass
TP
757
segments of the market. Further, SSML entered the ladies' salwar kameez and
Upside
5%
ethnic wear segment. Going forward, we believe that the company would be able to
Sector
Textile
leverage its brand equity and continue to post strong performance.
Market Cap (` cr)
3,379
The company has a nationwide network of about 1,600 dealers and business
partners. It has a retail network of 160 stores and plans to add another
Beta
0.7
300-350 stores going forward. Further, the company's brands are sold across
52 Week High / Low
222/782
3,00,000 multi brand outlets in the country.
Going forward, we expect SSML to report a net sales CAGR of ~12% to
3 year-Chart
~`1,981cr and adj.net profit CAGR of ~16% to `123cr over FY2017-19E on
700
back of market leadership in blended fabrics, strong brand building, wide
600
distribution channel, strong presence in tier II and tier III cities and emphasis
500
on latest designs and affordable pricing points. At the current market price,
400
SSML trades at an inexpensive valuation. We have an accumulate
300
recommendation on the stock and target price of `757.
200
100
Key Financials
-
Y/E
Sales
OPM
PAT
EPS
ROE
P/E
P/BV
EV/EBITDA
EV/Sales
March
(` cr)
(%)
(` cr)
(`)
(%)
(x)
(x)
(x)
(x)
FY2018E
1,769
12.7
106
22.6
15.4
31.9
4.9
16.4
2.1
Source: Company, Angel Research
FY2019E
1,981
12.7
123
26.2
15.5
27.5
4.3
14.4
1.8
Source: Company, Angel Research
Stock Info
Maruti Suzuki
CMP
8,600
The Automobile sector is expected to benefit from the GST implementation.
TP
9,495
The sector has seen a pick up in the volumes in FY17 as there were several
Upside
10.5%
positive factors like normal monsoon and lower interest rates.
Sector
Automobiles
Maruti Suzuki continues to hold ~52% market share in the passenger vehicles.
Market Cap (` cr)
2,59,808
The launch of exciting models has helped the company to ride on the
Beta
1.0
premiumization wave that is happening in the country. In the last two years,
52 Week High / Low
8,696/5,040
company has seen improvement in the business mix with the pie of the utility
vehicles growing from ~4% to current 15%. The 2-3 months of waiting period
of new models, launch of Swift Hatchback in January-2018 and headroom for
3 year-Chart
more capacity utilization at Gujarat plant are the near term earning triggers.
10,000
9,000
8,000
Due to the favorable business mix, company has also been seeing
7,000
improvement in the margins. Company has already moved from ~11-12%
6,000
5,000
EBITDA margin range in FY14 to current ~17% margin range in 2QFY18.
4,000
Together with higher operating leverage at Gujarat plant, increasing Nexa
3,000
outlets, and improving business mix, we believe that company has further
2,000
1,000
room to improve its margins. We have an accumulate rating on the stock.
-
Key Financials
Y/E
Sales
OPM
PAT
EPS
ROE
P/E
P/BV
EV/EBITDA
EV/Sales
Source: Company, Angel Research
March
(` cr)
(%)
(` cr)
(`)
(%)
(x)
(x)
(x)
(x)
FY2018E
80,815
15.6
8,506
281.7
21.7
30.5
6.6
18.5
2.9
FY2019E
96,680
16.9
10,991
364.0
22.8
23.6
5.4
13.7
2.3
Source: Company, Angel Research
December 6, 2017
5
Top Picks Report | December 2017
Stock Info
TV Today Network
CMP
392
TTNL enjoys a strong viewership ranking in the Hindi and English news
TP
435
channel categories. The company’s Hindi news channel - Aaj Tak has
Upside
11%
maintained its market leadership position occupying the No.1 rank for several
Sector
Media
consecutive years in terms of viewership. Its English news channel - India
Today too has been continuously gaining viewership; it has now captured the
Market Cap (` cr)
2,334
No. 2 ranking from No. 4 earlier. Its other channels like Dilli Aaj Tak and Tez
Beta
0.9
are also popular among viewers.
52 Week High / Low
434 /210
TTNL is a play of higher operating leverage that would be visible as
advertisement revenues gain traction. Going ahead, we expect EBITDA
3 year-Chart
margins would improve.
450
400
350
We expect TTNL to report a net revenue CAGR of ~11% to ~`727cr and net
300
profit CAGR of ~14% to `122cr over FY2017-19E. We have an accumulate
250
rating on the stock
200
150
100
Key Financials
50
-
Y/E
Sales
OPM
PAT
EPS
ROE
P/E
P/BV
EV/EBITDA
EV/Sales
March
(` cr)
(%)
(` cr)
(`)
(%)
(x)
(x)
(x)
(x)
FY2018E
669
26.9
109
18.3
15.3
21.4
3.2
11.3
3.0
Source: Company, Angel Research
FY2019E
749
26.9
122
20.5
17.5
19.1
3.4
10.2
2.8
Source: Company, Angel Research
Music Broadcast
Stock Info
Radio Industry is protected by licenses for 15 years, thereby restricting the entry
CMP
384
of new players. This would support the existing companies to strengthen their
TP
434
position and maintain a healthy growth rate.
Upside
13%
It has grabbed the Number 1 position in Mumbai, Bengaluru and Delhi in
Sector
Media
terms of number of listener. This is helping MBL to charge premium rate,
Market Cap (` cr)
2,192
which resulting into higher EBITDA margin (33.6%) compare to 22% of ENIL.
Beta
0.6
MBL outperformed its closest peer with 18.4% CAGR in revenue over FY2013-
52 Week High / Low
415/333
17 (ENIL reported 13.2% CAGR in revenue). On the profitability front too,
MBL, with 32.3% CAGR in PAT over FY2013-17, has performed much better
3 year-Chart
than ENIL (-5.2% CAGR in PAT). Moreover, Radio City posted a six year CAGR
420
of 12.1% v/s. 9.1% of industry owing to higher advertising volumes.
400
Capex for 39 licenses have been done for the next 15 years, hence no heavy
380
incremental Capex requirement would emerge. Moreover, the maintenance
360
Capex would be as low as `5-10cr. This would leave sufficient cash flow to
340
distribute as dividend. We have a Buy recommendation on the stock and
target price of `434.
320
300
Key Financials
Y/E
Sales
OPM
PAT
EPS
ROE
P/E
P/BV
EV/EBITDA
EV/Sales
March
(` cr)
(%)
(` cr)
(`)
(%)
(x)
(x)
(x)
(x)
Source: Company, Angel Research
FY2018E
317
34.4
56
9.8
9.3
39.6
3.7
18.6
6.4
FY2019E
372
34.9
80
14.0
12.0
27.8
3.3
15.1
5.3
Source: Company, Angel Research
December 6, 2017
6
Top Picks Report | December 2017
Stock Info
KEI Industries
CMP
384
KEI’s current order book (OB) stands at `2,780cr (segmental break-up:
TP
425
`1,990cr in EPC, `560cr in Cable & `230cr in EHV). Its OB grew by ~28% in
Upside
11%
the last 3 years due to strong order inflows from State Electricity Boards, Power
Sector
Cable
grid, etc.
Market Cap (` cr)
3,009
KEI’s consistent effort to increase its retail business from 30-32% of revenue in
Beta
1.3
FY17 to 40-45% of revenue in the next 2-3 years on the back of strengthening
52 Week High / Low
412/106
distribution network (currently 926 which is expect to increase `1,500 by FY19)
and higher ad spend (increased from `2cr in FY13 to `7.5cr in FY17 and
expected to spend).
3 year-Chart
450
KEI’s export (FY17 - 8-10% of revenue) is expected to reach a level of ~14-
400
15% in next two years with higher order execution from current OB and
350
300
participation in various international tenders. We expect a strong
~26%
250
growth CAGR over FY2017-19 in exports. We expect KEI to report net revenue
200
150
CAGR of ~13% to ~`3,392cr and net profit CAGR of ~19% to `140cr over
100
FY2017-19E. Hence we have an accumulate rating on the stock.
50
-
Key Financials
Y/E
Sales
OPM
PAT
EPS
ROE
P/E
P/BV
EV/EBITDA
EV/Sales
March
(` cr)
(%)
(` cr)
(`)
(%)
(x)
(x)
(x)
(x)
Source: Company, Angel Research
FY2018E
3,001
10.0
119
15.5
21.0
22.7
4.8
10.3
1.1
FY2019E
3,392
10.0
140
18.1
20.0
19.4
3.9
9.2
0.9
Source: Company, Angel Research
Stock Info
GIC Housing Finance Ltd
CMP
408
Backed by the new management, GICHF is aiming for 2.0x growth in the loan
TP
655
book over the period of FY16-FY19E to `16,000cr. GICHF has healthy capital
Upside
60%
adequacy, and is seeing an increase in demand for home loans. GICHF’s
Sector
Financials
loan book is expected to report 24.3% loan growth over next two years.
GICHF is consistently decreasing bank borrowing and increasing high yield
Market Cap (` cr)
2,197
loan book which is expected to boost its Net Interest Margin. The share of
Beta
1.3
bank borrowing was 75% in FY15, which fell to 55% in FY17. In our opinion,
52 Week High / Low
623 /251
the impetus on lower bank borrowings and increasing high yield loan book is
likely to result in 17bps NIM over FY16-FY19E.
3 year-Chart
GICHF’s asset quality is on the higher side compared to other HFCs (As on
700
FY17 GNPA-2.3% and NPA-0.3%). This is primarily due to GICHF has not
600
written off any bad asset and has not sold any bad assets to ARC. New
500
Management is expediting asset quality improvement.
400
We expect the GICHF’s loan growth to grow at a CAGR of 24.3% over next
300
two years and RoA/RoE to improve from 1.7%/19.0% in FY17 to 2.0%/23.0%
200
in FY19E.The stock is currently trading at 1.9x FY2019E ABV. We have a Buy
100
rating on the stock.
-
Key Financials
Y/E
Op. Inc
NIM
PAT
EPS
ABV
ROA
ROE
P/E
P/ABV
Source: Company, Angel Research
March
(` cr)
(%)
(` cr)
(`)
(`)
(%)
(%)
(x)
(x)
FY2018E
376
3.6
180
33
184
1.7
20
12
2.2
FY2019E
477
3.7
215
40
219
1.9
23
10
1.9
Source: Company, Angel Research
December 6, 2017
7
Top Picks Report | December 2017
Stock Info
Navkar
CMP
181
NCL is one of the largest and one of the three CFS at JNPT with rail
TP
265
connectivity, helping it garner high market share at the port. NCL is in a massive
Upside
46%
expansion mode where it is increasing its capacity by 234% to 1,036,889 TEUs
Sector
Logistics
at JNPT and coming up with an ICD at Vapi (with Logistics Park).
Market Cap (` cr)
2,728
The ICD with rail link should benefit from first mover advantage in a region
Beta
0.8
that has huge market potential and accounts for ~27% of volumes at JNPT.
The ICD should be able to capture the EXIM volumes from the region through
52 Week High / Low
247 / 155
rail link that till now was being custom cleared at JNPT (Import) or being
transported via road and consolidated at JNPT (Export). South Gujarat
3 year-Chart
250
volumes will now head straight to the Vapi ICD; thus the company can now
cater to bulk commodities and domestic traffic that it had been rejecting owing
200
to capacity constraints at CFS.
150
We expect NCL to successfully use its rail advantage and scale up its
100
utilizations at both JNPT and Vapi ICD. We have a Buy rating on the stock.
50
Key Financials
-
Y/E
Sales
OPM
PAT
EPS
ROE
P/E
P/BV
EV/EBITDA
EV/Sales
March
(` cr)
(%)
(` cr)
(`)
(%)
(x)
(x)
(x)
(x)
FY2018E
400
41.5
104
7.3
6.9
22.5
1.8
17.8
7.4
Source: Company, Angel Research
FY2019E
530
41.5
142
9.9
8.6
15.4
1.6
13.3
5.5
Source: Company, Angel Research
Stock Info
Alkem Laboratories
CMP
2,080
Alkem is 5th largest pharma company is the domestic market and also has
TP
2,287
presence in US. It derives 73% of its revenues come from the Indian markets
Upside
10%
while rest come from the other countries. Alkem has leadership position in the
domestic anti infective segment and it is ranked #3 in Gastro-Intestinal and
Sector
Pharmaceutical
Pain/Analgesics segments. Company holds ~3.6% and ~7.9% market share
Market Cap (` cr)
24,869
in the formulations and overall prescriptions in the country.
Beta
0.4
In the domestic market, company operates in acute and chronic segments. It is
52 Week High / Low
2,238 /1,535
a prominent player in acute segment has forayed in chronic segment from
which it expects faster growth. Alkem has been outperforming the domestic
3 year-Chart
industry growth which is likely to continue. Company is focusing on
2,500
monetization of its pipeline (92 ANDAs) in the US with high single digit ANDA
launches to grow the US revenues at ~20% growth rate from FY17-FY19E.
2,000
Overall outlook remains strong with 9% CAGR in the topline and 13% CAGR
1,500
in the bottom-line. We have an accumulate rating on the stock.
1,000
Key Financials
500
Y/E
Sales
OPM
PAT
EPS
ROE
P/E
P/BV
EV/EBITDA
EV/Sales
-
March
(` cr)
(%)
(` cr)
(`)
(%)
(x)
(x)
(x)
(x)
FY2018E
6,272
17.5
862
72.1
17.6
28.9
5.1
22.3
3.9
FY2019E
7,254
19.8
1,139
95.3
19.6
21.8
4.3
16.7
3.3
Source: Company, Angel Research
Source: Company, Angel Research
December 6, 2017
8
Top Picks Report | December 2017
Stock Info
LT Foods
CMP
73
LT Foods LTD (LTFL) is branded specialty Foods Company engaged in milling,
TP
96
processing and marketing of branded/non-branded basmati rice and
Upside
31%
manufacturing of rice food products in the domestic and overseas markets.
Sector
Food Processing
LTFL’s flagship brand Daawat enjoys 22% market share in the branded rice
Market Cap (` cr)
1,943
market of India. It also has strong market share in North America selling
Beta
1.0
Basmati rice under the brand ‘Royal’. Currently it has access to 1,40,000
52 Week High / Low
84 / 21
traditional retail outlets, 93% reach of towns with over 2 lakh population,and
a access to 3000 Wholesalers. It has also strong network in modern trade.
3 year-Chart
LTFL is the 1st Rice company to place Brown Basmati Rice in Medical Chains.
90
80
The company has a well-diversified product basket catering to consumers of
70
60
all income groups. The company is present in segments like Basmati rice,
50
Specialty rice (non-Basmati) and Other food products.
40
30
Outlook remains strong with 14%/20% CAGR in the top-line/bottom-line. We
20
10
recommend Buy on the stock with Target Price of `96 (15x FY2019E EPS).
-
Key Financials
Y/E
Sales
OPM
PAT
EPS
ROE
P/E
P/BV
EV/EBITDA
EV/Sales
March
(` cr)
(%)
(` cr)
(`)
(%)
(x)
(x)
(x)
(x)
Source: Company, Angel Research
FY2018E
3,747
11.5
139
5.2
17.5
14.0
2.4
8.2
0.9
FY2019E
4,234
11.5
170
6.4
17.6
11.4
2.0
7.2
0.8
Source: Company, Angel Research
Stock Info
Century Plyboards India
CMP
308
Century Plyboards India Ltd (CPIL) is a plywood manufacturer dealing in
TP
400
plywood, laminates, MDF (Medium Density Fibreboard) and others with
Upside
30%
presence across India and overseas. CPIL is also engaged in logistics business
Sector
Miscellaneous
through management of a container freight station.
Market Cap (` cr)
6,854
Beta
1.0
Indian plywood industry is estimated at `18,000cr and is largely unorganised
(~75% share of revenues). However, with the implementation of GST, the
52 Week High / Low
326/154
share of organized players is expected to improve, which would be beneficial
for branded players like CPIL.
3 year-Chart
350
CPIL has recently added new MDF plant (1,98,000 m3, to generate ~`450-
300
500cr revenue), laminates
(4.8 mn sheets by scaling ~50%, to generate
250
~`250-300cr revenue), particle boards
(`100cr of revenue). Capacity
200
addition across segments would boost revenue and profitability going ahead.
150
100
We expect CPIL to report net revenue & PAT CAGR of ~17% & 16%
50
respectively. We have a Buy recommendation with Target Price of `400.
-
ey Financials
Y/E
Sales
OPM
PAT
EPS
ROE
P/E
P/BV
EV/EBITDA
EV/Sales
Source: Company, Angel Research
March
(` cr)
(%)
(` cr)
(`)
(%)
(x)
(x)
(x)
(x)
FY2018E
450
41.5
124
8.7
8.4
22.5
1.8
16.6
6.9
FY2019E
617
41.5
181
12.7
11.0
15.4
1.6
12.0
5.0
Source: Company, Angel Research
December 6, 2017
9
Top Picks Report | December 2017
Research Team Tel: 022 - 39357800
DISCLAIMER
Angel Broking Private Limited (hereinafter referred to as “Angel”) is a registered Member of National Stock Exchange of India Limited,
Bombay Stock Exchange Limited and Metropolitan Stock Exchange Limited. It is also registered as a Depository Participant with CDSL
and Portfolio Manager and investment advisor with SEBI. It also has registration with AMFI as a Mutual Fund Distributor. Angel Broking
Private Limited is a registered entity with SEBI for Research Analyst in terms of SEBI (Research Analyst) Regulations, 2014 vide
registration number INH000000164. Angel or its associates has not been debarred/ suspended by SEBI or any other regulatory
authority for accessing /dealing in securities Market. Angel or its associates/analyst has not received any compensation / managed or
co-managed public offering of securities of the company covered by Analyst during the past twelve months.
This document is solely for the personal information of the recipient, and must not be singularly used as the basis of any investment
decision. Nothing in this document should be construed as investment or financial advice. Each recipient of this document should
make such investigations as they deem necessary to arrive at an independent evaluation of an investment in the securities of the
companies referred to in this document (including the merits and risks involved), and should consult their own advisors to determine
the merits and risks of such an investment.
Reports based on technical and derivative analysis center on studying charts of a stock's price movement, outstanding positions and
trading volume, as opposed to focusing on a company's fundamentals and, as such, may not match with a report on a company's
fundamentals. Investors are advised to refer the Fundamental and Technical Research Reports available on our website to evaluate the
contrary view, if any.
The information in this document has been printed on the basis of publicly available information, internal data and other reliable
sources believed to be true, but we do not represent that it is accurate or complete and it should not be relied on as such, as this
document is for general guidance only. Angel Broking Pvt. Limited or any of its affiliates/ group companies shall not be in any way
responsible for any loss or damage that may arise to any person from any inadvertent error in the information contained in this report.
Angel Broking Pvt. Limited has not independently verified all the information contained within this document. Accordingly, we cannot
testify, nor make any representation or warranty, express or implied, to the accuracy, contents or data contained within this document.
While Angel Broking Pvt. Limited endeavors to update on a reasonable basis the information discussed in this material, there may be
regulatory, compliance, or other reasons that prevent us from doing so.
This document is being supplied to you solely for your information, and its contents, information or data may not be reproduced,
redistributed or passed on, directly or indirectly.
Neither Angel Broking Pvt. Limited, nor its directors, employees or affiliates shall be liable for any loss or damage that may arise from
or in connection with the use of this information.
Ratings (Based on expected returns
Buy (> 15%)
Accumulate (5% to 15%)
Neutral (-5 to 5%)
over 12 months investment period):
Reduce (-5% to -15%)
Sell (< -15)