Angel Top Picks - August 2016
Angel Top Picks - August 2016
The Indian equity market has been one of the most resilient performers post the
The implementation of the GST will
Brexit and has gained ~5% since then. Though an easy liquidity scenario is
possibly be the most significant reform
largely responsible for the rally, still one can’t ignore the evident improvement in
post economic liberalisation in 1991; it
the Indian economy on the back of sustained domestic consumption. While the
will transform the economy into a single
market with uniform tax structure.
global economy remains fragile, the Indian economy is expected to stay perched
on the path of growth. There have been many domestic reforms in the last two
decades; in our opinion the GST will possibly be the most significant one post
economic liberalisation in 1991. It will transform the economy into a single
market with a uniform tax structure across states and will significantly reduce the
complexities in doing business. Although the impact of GST on the corporate
sector and the economy as a whole will be visible with a lag of a few years but
we strongly believe it has the potential to push GDP growth, while keeping
inflation under check.
Post GST, what will be the next level of
With the GST now having been enacted, the question is what will be the next
growth for our markets? The answer lies
lever of growth for our markets? The answer lies in corporate earnings, which we
in corporate earnings, which we feel
feel should grow by 16-17% for FY2017. As we had indicated earlier, the
should grow by 15-16% for FY2017.
economy will get a boost on increased spending by the government on various
infrastructure projects and on the back of its emphasis on the development of
rural areas. We have seen a series of orders opening up in the road construction
space, redevelopment plans, as well as metro projects, and a lot more are in the
pipeline. This should act as a favourable impetus not only for specific directly
concerned sectors but also support the overall corporate sector growth.
Good monsoon has led to the highest
This year the country is likely to receive an above normal monsoon with the
plantation of pulses in the last five
rainfall until now being in excess by 1%. Further, the planting of pulses is at
years, which would lead to softening of
among the highest levels in the last five years. On this account, we believe that
food inflation, thus paving the way for
food inflation would peter down. The RBI could possibly go for a rate cut in its
lower interest rates.
upcoming monetary policy meet as most macro data points hint at easing of
inflation. The 10 year G-Sec yield has already seen an ~35bp drop in the last
40-50 days, indicating lower interest rates.
We have been vocal about consumption and infrastructure based themes playing
out well and the recent favourable developments and cues mentioned above add
to our conviction. We continue to like consumption based companies like Blue
Star, Voltas, Bajaj Electricals, Siyaram Silk Mills and Radico Khaitan. We have
already seen a revival in tractor demand and to play the monsoon theme we
believe Goodyear India is the right candidate as it is among the leaders in terms
of market share in tractor tyres. To play on the government’s infrastructure
spending and in anticipation of a lower interest rates regime, we believe ITNL,
Mahindra Life Space, LIC Housing Finance, Dewan Housing and Equitas Holding
are good picks. While NBCC has already met our target price, we still have a
positive view on the stock and will revisit the target price post its 1QFY2017
results.
Please refer to important disclosures at the end of this report
1
Top Picks Report | August 2016
Large Cap
EPS
PER
EV/Sales
ROE
Company
Sector
Rating
CMP (`)
Target (`)
Upside (%)
FY17E FY18E
FY17E FY18E
FY17E FY18E
FY17E FY18E
Amara Raja
Auto Ancill.
Buy
876
1,076
22.8
35.3
43.5
25.2
20.5
2.8
2.3
25.9
26.0
BEL
Capital Goods
Buy
1,231
1,414
15.0
58.7
62.5
20.9
19.7
2.7
2.4
*44.6
*46.3
HCL Tech
IT
Buy
826
1,000
21.1
55.7
64.1
14.8
12.9
1.9
1.4
20.3
17.9
HDFC Bank
Financials
Accumulate
1,242
1,350
8.7
58.4
68.0
21.3
18.3
-
-
18.8
18.6
Infosys
IT
Buy
1,085
1,370
26.3
64.8
72.0
16.7
15.1
3.0
2.6
22.0
22.3
LIC Housing Fin.Financials
Buy
511
582
13.9
40.6
47.8
13.1
11.1
-
-
19.9
20.1
Voltas
Capital Goods
Buy
347
407
17.2
12.9
16.3
26.9
21.3
1.8
1.5
16.7
18.5
Source: Angel Research; *Note- Adj. RoEs
Mid Cap
EPS
PER
EV/Sales
ROE
Company
Sector
Rating
CMP (`) Target (`)
Upside (%)
FY17E FY18E
FY17E FY18E
FY17E FY18E
FY17E FY18E
Bajaj Electricals
Cons. Durable Accumulate
268
299
11.2
12.4
15.7
20.1
15.8
0.5
0.5
14.4
16.1
Blue Star
Cons. Durable Accumulate
496
527
6.3
14.9
22.1
35.3
23.7
1.2
1.0
20.4
26.4
Dewan Housing Financials
Buy
234
270
15.4
29.7
34.6
7.9
6.8
-
-
16.1
16.8
Equitas Holdings Financials
Buy
173
235
35.8
6.7
9.4
29.7
21.0
-
-
10.9
11.5
Goodyear India Tyre
Buy
533
631
18.4
49.4
52.6
10.8
10.1
0.4
0.4
18.2
17.0
IL&FS Transport. Infra
Buy
71
93
31.0
8.6
5.6
8.8
7.8
3.6
3.3
4.2
5.0
Jagran Prakashan Media
Accumulate
185
205
10.8
10.8
12.5
17.1
14.8
2.6
2.3
21.7
21.7
Mahindra LifespaceReal Estate
Buy
436
554
27.0
18.3
33.8
23.8
12.9
2.9
2.3
4.9
8.5
Navkar Corp.
Logistics
Buy
205
265
29.0
6.8
11.5
30.3
17.8
8.1
5.4
6.9
10.5
Radico Khaitan
Breweries & Dist.
Buy
90
125
39.2
6.3
7.4
14.2
12.2
1.2
1.1
8.6
9.3
Siyaram Silk Mills Textile
Buy
1, 050
1,347
28.3
104.9
122.4
10.0
8.6
0.7
0.7
16.4
16.4
TV Today
Media
Buy
297
363
22.4
18.4
21.4
16.2
13.9
2.4
1.9
17.4
17.2
Source: Angel Research
August 5, 2016
2
Top Picks Report | August 2016
Top Picks - Large Cap
August 5, 2016
3
Top Picks Report | August 2016
Stock Info
Amara Raja Batteries
CMP
876
Amara Raja Batteries Ltd (ARBL) is the second largest lead acid storage battery
TP
1,076
manufacturer in the country. It has been outpacing market leader Exide (ARBL
Upside
22.8%
grew at a 24% CAGR over FY2010-15 as compared to Exide's growth of 13%),
leading to its market share improving from 25% in FY10 to about 35%
Sector
Auto Ancillary
currently. ARBL's outperformance has been mainly on back of its association
Market Cap (` cr)
15,241
with global battery leader Johnson Controls Inc (which also holds 26% stake in
Beta
0.831
ARBL) for manufacturing ducts.
52 Week High / Low
1,132 / 773
With the automotive OEMs following a policy of having multiple vendors and
with ARBL’s products enjoying a strong brand recall in the replacement
segment, the company is well poised to gain further market share. Given the
3 year-Chart
economic recovery and market share gains, the company is expected to grow at
1,200
a CAGR of 18% over the next two years as against industry growth of 10-12%.
1,000
ARBL is a well diversified auto ancillary player having presence across the
800
automotive and the industrial segment. It has a broad OEM as well as
600
replacement customer base. We believe ARBL is a high quality stock to play
the auto sector revival. We maintain our Buy rating on the stock.
400
200
Key Financials
-
Y/E
Sales
OPM PAT EPS ROE P/E P/BV EV/EBITDA EV/Sales
March
(` cr)
(%)
(` cr)
(`)
(%)
(x)
(x)
(x)
(x)
FY2017E
5,429
17.5
604
35.3
25.9
25.2
6
15.8
2.8
Source: Company, Angel Research
FY2018E
6,471
17.6
742
43.5
26.0
20.5
4.9
13.0
2.3
Source: Company, Angel Research
Stock Info
Bharat Electronics (BEL)
CMP
1,231
High priority to the defense sector in the government’s ‘Make in India’
TP
1,414
campaign, with (1) emphasis on indigenization, (2) increase in FDI limits from
26% to 49%, and (3) over $50bn worth of projects cleared by Defense
Upside
14.9%
Acquisition Council (DAC) in the last 26 months, indicate at the sector being at
Sector
Capital Goods
an inflexion point where Indian defense capex cycle is entering a new era of
Market Cap (` cr)
29,534
growth. The current bid pipeline could lead to strong award activity for the
next few years and BEL could emerge as a beneficiary.
Beta
1.1
BEL in FY2016 had ~35% market share in the defense electronics space.
52 Week High / Low
1,417 / 983
Considering (1) bid-pipeline of Indian Air Force and Navy’s platform projects,
which have high defense electronic component, (2) BEL’s in-house R&D
3 year-Chart
capabilities, and (3) its zero debt status, we believe that BEL would maintain its
1600
strong market positioning in the defense electronics space.
1400
We expect BEL to trade at a premium to its historical valuations on account of
1200
1000
uptick in investment cycle. Current low competitive intensity which should
800
enable BEL to justifiably command scarcity premium, coupled with the fact that
600
the company is the largest listed defense player, makes the stock more
400
attractive. We maintain BUY rating on the stock with price target of `1,414.
200
0
Key Financials
Y/E
Sales
OPM PAT EPS Adj. ROE P/E P/BV EV/EBITDA EV/Sales
March
(` cr)
(%)
(` cr)
(`)
(%)
(x)
(x)
(x)
(x)
Source: Company, Angel Research
FY2017E
8,137
16.8
1,410
58.7
44.6
20.9
3.0
15.7
2.7
FY2018E
9,169
17.2
1,499
62.5
46.3
19.7
2.8
13.7
2.4
Source: Company, Angel Research
August 5, 2016
4
Top Picks Report | August 2016
Stock Info
HCL Technologies
CMP
826
Healthy pipeline: The company’s engineering services has been seeing lumpy
TP
1,000
growth over the last few quarters. This is however largely a function of the
Upside
21.1%
timing of large transformational deals. 6-8 of the large deals signed a few
Sector
IT
quarters ago will aid the company to continue to post industry leading growth.
We expect HCL Tech to post a USD and INR revenue CAGR of 16.3% and
Market Cap (` cr)
1,16,521
18.0%, respectively, over FY2016-18E (inclusive of the acquisition of
Beta
0.8
Geometric Software and the Volvo deal).
52 Week High / Low
997 / 707
Robust outlook: For FY2017 revenues are expected to grow between 12.0-
14.0% in CC. Revenue guidance is based on FY2016 (April to March’2016)
3 year-Chart
average exchange rates. The above constant currency guidance translates to
1200
11.2% to 13.2% growth in US$ terms.
1000
Outlook and Valuations: The stock is attractively valued at the current market
800
price and hence we maintain our Buy with a price target of `1,000.
600
400
Key Financials
200
Y/E
Sales
OPM PAT EPS ROE P/E P/BV EV/EBITDA EV/Sales
0
June
(`cr)
(%)
(`cr)
(`)
(%)
(x)
(x)
(x)
(x)
FY2017E
49,242
20.5
7,862
55.7
20.3
12.9
2.6
7.6
1.6
FY2018E
57,168
20.5
9,037
64.1
17.9
11.2
2.0
5.6
1.1
Source: Company, Angel Research
Source: Company, Angel Research
Stock Info
HDFC Bank
CMP
1,242
Strong capital adequacy will enable continued growth going ahead: HDFC
TP
1,350
Bank continued to report strong loan growth of 23% yoy and with capital
Upside
8.7%
adequacy ratio of 15.5% at the end of 1QFY2017, the bank has enough
Sector
Financials
scope to continue to grow its loan book and increase its market share.
Market Cap (` cr)
315,262
Asset quality rock-solid: The bank has been able to maintain its asset quality
consistently, though it saw some weakness during 1QFY17 with Gross NPA
Beta
0.8
ratio and the Net NPA ratio at
1.04% and
0.32%, respectively, in a
52 Week High / Low
1,258 / 929
challenging macro environment. We don’t see asset quality weakening further.
Outlook: The bank’s credit and deposit growth beat the industry growth rate,
3 year-Chart
driven by strong retail business. This provides strong visibility for a robust 20%
1,400
earnings trajectory, coupled with high quality of earnings. This in our view
1,200
justifies a premium valuation multiple. At the current market price, the bank is
1,000
trading at 3.2x its FY2018E ABV. We recommend an Accumulate rating on the
800
600
stock, with a target price of `1,350
400
Key Financials
200
-
Y/E
Op. Inc NIM
PAT
EPS
ABV ROA ROE P/E P/ABV
March
(` cr)
(%)
(` cr)
(`)
(`)
(%)
(%)
(x)
(x)
FY2017E
46,097
4.5
14,806
58.4
333.1
2.0
18.8
21.3
3.8
Source: Company, Angel Research
FY2018E
55,433
4.5
17,237
68.0
398.6
2.0
18.6
18.3
3.2
Source: Company, Angel Research
August 5, 2016
5
Top Picks Report | August 2016
Stock Info
Infosys
CMP
1,085
Strong revenue guidance for FY17: The Management has guided towards
TP
1,370
higher revenue growth for FY2017, ie of 11.5-13.5% in CC terms and 12.7-
Upside
26.3%
14.7% in INR terms (exchange rate as on March 31, 2016). For FY2016, the
Sector
IT
company posted a 13.3% growth in CC terms V/s a guidance of 12.8-13.2%
growth (in CC). We expect the company to post ~13.0% USD revenue growth
Market Cap (` cr)
2,49,218
in FY2017.
Beta
0.8
Aims to be US$20bn company by FY20: The company expects its revenue to
52 Week High / Low
1,278 / 1,012
rise to US$20bn by FY2020, up from US$8.7bn in FY2015, as it focuses on
acquisitions and winning more new technology services, implying a
14%
3 year-Chart
CAGR over the period. Over the near term, we expect Infosys to post a 13.0%
1400
USD revenue growth in FY2017. Over FY2016-18E, we expect USD and INR
1200
revenue to grow at a CAGR of 13.0% and 13.0%, respectively.
1000
Outlook and Valuations: The stock trades at a valuation of 15.1x FY2018E
earnings. We recommend Buy on the stock with a price target of `1,370.
800
600
Key Financials
Y/E
Sales
OPM PAT EPS ROE P/E P/BV EV/EBITDA EV/Sales
400
March
(` cr)
(%)
(` cr)
(`)
(%)
(x)
(x)
(x)
(x)
FY2017E
69,934
27.5
14,886
64.8
22.2
16.7
3.7
10.8
3.0
FY2018E
79,025
27.5
16,529
72.0
22.3
15.1
3.4
9.3
2.6
Source: Company, Angel Research
Source: Company, Angel Research
Stock Info
LIC Housing Finance
CMP
511
Significant under penetration of mortgages in India: India is expected to
TP
582
witness a robust housing finance growth going forward as the mortgage
Upside
13.9%
penetration in India remains at very low levels at 9% to GDP as compared to
Sector
Financials
the developed countries where it is in the range of 60-100%.
Market Cap (` cr)
25,803
NIM expansion visible: LICHF is able to raise funds from low-cost NCDs due
Beta
1.4
to its strong AAA credit rating and backing by strong promoters like LIC. In a
declining interest rate environment, NBFCs like LICHF are well-placed to
52 Week High / Low
537 / 389
witness margin improvement in our view.
3 year-Chart
Outlook: For companies like LICHF, the funding environment has eased; thus
600
it will lead to lower cost of borrowing, while outlook for growth in retail
housing loans remains positive, going forward. We expect the company to
500
post a healthy loan book CAGR of 19% over FY2016-18E, which is likely to
400
reflect in earnings CAGR of ~20%, over the same period. The stock currently
300
trades at 2.1x FY2018E ABV. We maintain our Buy rating on the stock, with a
200
target price of `582.
100
Key Financials
-
Y/E
Op. Inc NIM
PAT
EPS
ABV ROA ROE P/E P/ABV
March
(` cr)
(%)
(` cr)
(`)
(`)
(%)
(%)
(x)
(x)
Source: Company, Angel Research
FY2017E
3,712
2.6
1,968
39.0
207.9
1.5
19.9
13.1
2.5
FY2018E
4,293
2.5
2,323
46.0
243.4
1.5
20.1
11.1
2.1
Source: Company, Angel Research
August 5, 2016
6
Top Picks Report | August 2016
Stock Info
Voltas
CMP
347
Growth in UCP segment to continue: Voltas has maintained 20%+ market
TP
407
share in domestic air-conditioning market despite stiff competition from MNC
Upside
17.2%
players. With economic indicators turning favorable, the company’s
competitive positioning should help its UCP segment to report a 19.5% top-
Sector
Construction & Eng.
line and 16.6% EBIT CAGR, respectively, during FY2016-18E.
Market Cap (` cr)
11,485
Gradual recovery in EMP business: In the run-up to the Qatar World Cup
Beta
1.4
2022 and Dubai Expo 2020, we expect international awarding activity to
52 Week High / Low
376/ 211
catch-up from FY2017E onwards. Surge in order book should translate to
uptick in execution (10.7% top-line CAGR during FY2016-18E). With legacy
projects completed and contribution of high margin projects kicking-in, we
3 year-Chart
expect segment margins to expand from 1.4% in FY2016 to 5.0% in FY2018E.
400
350
Strong growth Outlook: On the back of strong 13.3% top-line and 18.1%
300
bottom-line CAGR during FY2016-18E, we expect Voltas to report strong
250
16.7%/18.5% RoE for FY2017/18E, respectively. Considering the positive cues,
200
case for improvement in business segments’ performances and growth potential, we
150
expect improved profitability and better investment return ratios, going forward. We
100
assign 25.0x PE multiple to our FY2018E EPS estimate of `16.3/share and arrive at
50
0
a price target of `407. Given the upside, we recommend Buy on the stock.
Key Financials
Y/E
Sales
OPM PAT EPS ROE P/E P/BV EV/EBITDA EV/Sales
Source: Company, Angel Research
March
(` cr)
(%)
(` cr)
(`)
(%)
(x)
(x)
(x)
(x)
FY2017E
6,511
7.9
427
12.9
16.7
26.9
4.2
22.2
1.8
FY2018E
7,514
8.7
538
16.3
18.5
21.3
3.7
17.5
1.5
Source: Company, Angel Research
August 5, 2016
7
Top Picks Report | August 2016
Top Picks - Mid Cap
August 5, 2016
8
Top Picks Report | August 2016
Stock Info
Bajaj Electricals
CMP
268
The company is among the top 4 players in the consumer durables space
TP
299
across all its product categories (leader in small appliances; number-4 in fans
Upside
11.2%
and lighting). It has a strong distribution reach with 4,000 distributors
Sector
Cons. Durable
reaching out to 400,000 retailers.
Market Cap (` cr)
2,712
In the 3 years preceding FY2016, the company’s E&P segment had been
Beta
0.9
underperforming owing to cost overruns and delays in project executions.
However, the segment has turned around in FY2016 on the profitability front
52 Week High / Low
283 / 155
and delivered a healthy EBIT margin of ~6% for the year. Currently the
segment’s order book stands at `2,480cr.
3 year-Chart
With expectation of timely execution of new projects in the E&P segment and
400
with the Lighting and Consumer Durables segments expected to benefit from
350
300
an improvement in consumer sentiments going forward, we expect the
250
company’s top-line to grow at a CAGR of ~15% to `6,098cr and bottom-line
200
to grow at a CAGR of 29% to `159cr over FY2016-FY2018E. We recommend
150
a Buy rating on the stock.
100
50
Key Financials
0
Y/E
Sales OPM PAT EPS ROE P/E P/BV EV/EBITDA EV/Sales
March
(` cr)
(%)
(` cr)
(`)
(%)
(x)
(x)
(x)
(x)
FY2017E
5,351
5.6
125
12.4
14.4
20.1
3.1
9.2
0.5
Source: Company, Angel Research
FY2018E
6,098
5.9
159
15.7
16.1
15.8
2.8
7.8
0.5
Source: Company, Angel Research
Stock Info
Blue Star
CMP
496
BSL is one of the largest air-conditioning companies in India. With a mere
TP
527
3% penetration level of ACs vs 25% in China, the overall outlook for the room
Upside
6.3%
air-conditioner (RAC) market in India is favourable.
Sector
Cons. Durable
BSL’s RAC business has been outgrowing the industry by ~10% points over the
Market Cap (` cr)
4,723
last few quarters, resulting in the company consistently increasing its market
share (~7% in FY2014 to 10.5% at present). This has resulted in the Cooling
Beta
0.6
Products Division (CPD)'s share in overall revenues increasing from~23% in
52 Week High / Low
449 / 306
FY2010 to ~42% in FY2016 (expected to improve to ~47% in FY2018E). With
strong brand equity and higher share in split ACs, we expect the CPD to
3 year-Chart
continue to drive growth.
600
Aided by increasing contribution from the CPD, we expect the overall top-line
500
to post a revenue CAGR of ~15% over FY2016-18E and margins to improve
400
from 5.7% in FY2015 to 7.1% in FY2018E. Moreover, the merger of Blue Star
Infotech has infused cash and strengthened the balance sheet. We have an
300
Accumulate recommendation on the stock.
200
100
Key Financials
0
Y/E
Sales OPM PAT EPS ROE P/E P/BV EV/EBITDA EV/Sales
March
(` cr)
(%)
(` cr)
(`)
(%)
(x)
(x)
(x)
(x)
FY2017E
4,283
5.9
142
14.9
20.4
35.3
6.8
20.1
1.2
Source: Company, Angel Research
FY2018E
5,077
7.3
211
22.1
26.4
23.7
5.8
13.6
1.0
Source: Company, Angel Research
August 5, 2016
9
Top Picks Report | August 2016
Stock Info
Dewan Housing Finance
CMP
234
3rd largest private sector housing finance company: We expect DHFL’s AUM to
TP
270
grow at a CAGR of 21% over FY2016-18, as demand for housing in the
Upside
15.4%
middle and low income group picks up, while PAT CAGR is expected to be
22%
Sector
Financials
Seasoned and granular loan book with stable asset quality: Individual
Market Cap (` cr)
6,839
borrowers account for 72%, while the high yielding loan against property (LAP)
Beta
1.6
+SME and projects loans account for 19% and 9% of advances respectively. Despite
52 Week High / Low
268 / 141
strong loan growth, the GNPAs and NNPAs are likely to be at ~1.17% and 0.82%,
respectively, for FY2017. We don’t expect any major deterioration in the asset
quality going ahead.
3 year-Chart
Lower cost of funds will help maintain NIM: Nearly 70% of the bank
300
borrowings are due for maturity over the next three years and swapping a part
250
of that with non-convertible debentures (NCDs), where it has ~100bp cost
200
benefit, will help DHFL in maintaining its NIM at ~2.9%.
150
Outlook: We expect the company to post a healthy loan book CAGR of 21%
100
over FY2015-18E, which is likely to translate in an earnings CAGR of 22%,
50
over the same period. The stock currently trades at 1.1x FY2018E ABV. We
maintain Buy on the stock, with a target price of `270.
-
Key Financials
Y/E
Op. Inc NIM
PAT
EPS
ABV ROA ROE P/E P/ABV
Source: Company, Angel Research
March
(` cr)
(%)
(` cr)
(`)
(`)
(%)
(%)
(x)
(x)
FY2017E
2,225
2.9
866
29.7
184.0
1.1
16.1
7.9
1.3
FY2018E
2,688
2.9
1,084
34.6
215.3
1.2
16.8
6.8
1.1
Source: Company, Angel Research
Stock Info
Equitas Holdings
CMP
173
Early mover advantage in the SFB category: Equitas was one of the ten NBFCs
TP
235
to get the license to start a small finance bank (SFB). As the entire book of
Upside
35.8%
Equitas qualifies for PSL, meeting the 75% PSL target will not be a challenge.
Sizeable and diversified loan book will keep it ahead of other upcoming SFBs.
Sector
Financials
Asset quality and return ratios are likely to remain stable: Equitas will have to
Market Cap (` cr)
5,796
maintain CRR & SLR going ahead; hence yield on total assets is likely to come
Beta
0.9
down. However, as a bank it will be able to raise deposits and hence there will
52 Week High / Low
206 / 134
be reduction in cost of funds. As a result, spreads may not decline much which
in turn will help in maintaining the ROE & ROA which although could undergo
a marginal decline. Also we don’t expect any major deterioration in the asset
3 year-Chart
quality going ahead.
220
NIM likely to remain healthy: Equitas will be able to take deposits after it
200
formally starts banking operations leading to ~250bp reduction in cost of
180
funds. Hence we expect the NIM to remain strong at ~11%, going ahead.
160
Outlook: We expect the company to post a strong loan book & earnings
140
CAGR of 38% & 37% over FY2016-18E. The stock currently trades at 2.2x
120
FY2018E BV. We maintain Buy on the stock, with a target price of `235.
100
Key Financials
Y/E
Op. Inc NIM
PAT
EPS
ABV ROA ROE P/E P/ABV
March
(` cr)
(%)
(` cr)
(`)
(`)
(%)
(%)
(x)
(x)
Source: Company, Angel Research
FY2017E
1,076
11.7
224
6.7
68.2
2.8
12.4
27.6
2.7
FY2018E
1,465
11.4
315
9.4
77.6
2.8
12.9
19.7
2.3
Source: Company, Angel Research
August 5, 2016
10
Top Picks Report | August 2016
Stock Info
IL&FS Transportation Networks
CMP
71
ITNL reported commercial operations date (CoD) for JSEL and PSRDCL. Also,
TP
93
completion certificate was issued for BKEL. TRDCL P-III and CNTL are expected
Upside
31.0%
to commence in the next few months. Further, RIDCRO P-III, KSEL, KNEL, and
Sector
Construction
BAEL are expected to commence operations in next few months. Accordingly,
we expect revenue from these projects to increase by ~`4cr/day (unadj. for
Market Cap (` cr)
2,334
stake).
Beta
1.0
Strategic initiatives like stake sale at SPV level, listing of operational BOT
52 Week High / Low
145/64s
projects under InvITs, and re-financing of BOT projects should help the
company unlock value. Money raised from these initiatives could be used to
3 year-Chart
lower debt and improve the profitability.
300
With 7+ projects expected to commence in the next 12 months, we expect the
250
debt repayment cycle at SPV level to commence, resulting in the overall consol.
200
D/E levels peaking out at ~4.0x. With concerns over higher D/E levels allayed
150
to a certain extent, coupled with the attractive valuations of 0.3x FY2017E
100
P/BV multiple that the ITNL stock is trading at, we maintain our Buy on the
50
stock with price target of `93.
0
Key Financials
Y/E
Sales
OPM PAT EPS ROE P/E P/BV EV/EBITDA EV/Sales
March
(` cr)
(%)
(` cr)
(`)
(%)
(x)
(x)
(x)
(x)
Source: Company, Angel Research
FY2017E
8,946
31.0
266
8.1
4.2
8.8
0.3
11.6
3.6
FY2018E
10,017
31.6
299
9.1
5.0
7.8
0.3
10.5
3.3
Source: Company, Angel Research
Stock Info
Goodyear India
CMP
533
Normal monsoon to energize stagnant tractor demand: Goodyear India (GIL)
TP
631
is a leader in the tractor tyre segment in India with tractor tyres accounting for
Upside
18.4%
~50% of its overall revenues. GIL’s performance on the top-line front has
been under pressure on account of below par monsoon over the past two
Sector
Tyres
years. As tractor sales have strong correlation with monsoons, the normal
Market Cap (` cr)
1,229
monsoon this year should translate into a higher demand for tractor tyres.
Beta
0.6
Strong finances and Balance Sheet: GIL is a debt free-cash rich company with
52 Week High / Low
662 / 443
RoIC estimated at ~84% for FY2018. The company’s cash and equivalents
are `334cr for FY2016, which amount to ~28% of the current market cap.
3 year-Chart
Outlook and valuation: On an adjusted basis (for FY end March), we expect
the top-line to post a CAGR of 7.5% over FY2016-18E to `1,704cr mainly on
800
700
account of rebound in tractor tyre volumes and expect net profit to improve to
600
`121cr in FY2018E. At the current market price, the stock is trading at a PE of
500
10.0x its FY2018E earnings. We have a Buy rating on the stock and assign a
400
target price of `631 based on a target PE of 12.0x for FY2018E.
300
200
100
Key Financials
0
Y/E
Sales
OPM PAT EPS ROE P/E P/BV EV/EBITDA EV/Sales
March
(` cr)
(%)
(` cr)
(`)
(%)
(x)
(x)
(x)
(x)
FY2017E
1,598
10.4
114
49.4
18.2
10.8
1.8
4.3
0.4
FY2018E
1,704
10.2
121
52.6
17.0
10.1
1.6
3.6
0.4
Source: Company, Angel Research
Source: Company, Angel Research
August 5, 2016
11
Top Picks Report | August 2016
Stock Info
Jagran Prakashan
CMP
185
We expect JPL to register a net sales CAGR of ~12% over FY2016-18E, on
TP
205
back of (a) strong growth in advertising revenue due to improvement in GDP
growth, and (b) improvement in circulation revenue owing to combination of
Upside
10.8%
increase in cover price and volume growth.
Sector
Media
Further the acquisition of Radio City would also boost the company's revenue
Market Cap (` cr)
6,150
going ahead. Radio City has ~20 stations across 7 states in the country and is
second only to ENIL in all its operating circles, ie Delhi, Mumbai, Bengaluru,
Beta
0.6
Chennai, Ahmedabad, Hyderabad, Pune and Lucknow. The company covers
52 Week High / Low
190/110
~51% (~66mn people) of the total radio population.
Raw material prices have been in a declining trend. Thus, considering lower
3 year-Chart
news print costs, healthy sales, and higher margins in the radio business, we
expect an adj. net profit CAGR of ~12% over FY2016-18E to `409cr.
200
180
Considering Dainik Jagran's strong presence in the rapidly growing Hindi
160
markets, we expect JPL to benefit from an eventual recovery in the Indian
140
economy. Hence, we maintain an Accumulate rating on the stock with a target
120
100
price of `205.
80
60
Key Financials
40
20
Y/E
Sales
OPM PAT EPS ROE P/E P/BV EV/EBITDA EV/Sales
0
March
(` cr)
(%)
(` cr)
(`)
(%)
(x)
(x)
(x)
(x)
FY2017E
2,355
28.0
353
10.8
21.7
17.1
3.7
9.2
2.6
FY2018E
2,635
28.0
409
12.5
21.7
14.8
3.2
8.0
2.3
Source: Company, Angel Research
Source: Company, Angel Research
Stock Info
Mahindra Lifespace
CMP
436
Speedy execution & speedier sales: MLF has 13 projects under implementation
TP
554
across cities. MLF has exhibited fast completion of projects (4-4.5 years in
Mumbai, other-wise 3-3.5 years across other cities), compared to others. Sales
Upside
27.0%
cycle in ~65% of projects is faster than execution cycle, contrary to industry
Sector
Real Estate
trends. This fast execution and sales is optimal, as it helps MLF in revenue
Market Cap (` cr)
1,789
recognition, inventory cycle (better than Oberoi, DLF), cash flows and
profitability. This translates in creating a virtuous cycle of continuous fast growth.
Beta
0.4
Strong revenue growth visibility in short-to-long run: MLF as of 4QFY2016 is
52 Week High / Low
559 / 415
pursuing ~4.0mn sq. ft. of sale of the total ~15.0mn sq. ft. of saleable area.
Having sold ~60% of ongoing projects, we expect MLF to launch ~2.8mn
3 year-Chart
sq.ft. of saleable area in rational way during 4QFY2016-2QFY2018E, across
700
6 cities. Maturity at existing projects, new launches give better revenue visibility
600
for medium-term. Further, MLF is sitting on land bank of 11.0mn sq.ft across
500
4 cities, which allays any concern over long-term revenue growth.
400
With Real Estate Regulatory Bill closer to reality, MLF should be minimally
300
impacted, given their strong parentage and ethically implemented processes.
200
In the longer-term organized, professionally run, well funded players would
100
enjoy strong trust due to their reliable and fast execution strategies. With
improvement in company’s fundamentals, strong earnings growth visibility
-
and long-term growth outlook, at current valuations of 1.1x FY2017E P/BV,
MLF looks attractive. We maintain BUY on MLF with target price of `554.
Source: Company, Angel Research
Key Financials
Y/E
Sales
OPM PAT EPS ROE P/E P/BV EV/EBITDA EV/Sales
March
(` cr)
(%)
(` cr)
(`)
(%)
(x)
(x)
(x)
(x)
FY2017E
925
18.4
75
18.3
4.9
23.8
1.1
15.7
2.9
FY2018E
1,139
22.3
138
33.8
8.5
12.9
1.1
10.1
2.3
Source: Company, Angel Research
August 5, 2016
12
Top Picks Report | August 2016
Stock Info
Navkar
CMP
205
NCL is one of the largest and one of the three CFS at JNPT with rail
TP
265
connectivity, helping it garner high market share at the port. NCL is in a massive
Upside
29.0%
expansion mode where it is increasing its capacity by 234% to 1,036,889 TEUs
at JNPT and coming up with an ICD at Vapi (with Logistics Park).
Sector
Logistics
Market Cap (` cr)
2,918
The ICD with rail link should benefit from first mover advantage in a region
that has huge market potential and accounts for ~27% of volumes at JNPT.
Beta
0.6
The ICD should be able to capture the EXIM volumes from the region through
52 Week High / Low
224 / 151
rail link that till now was being custom cleared at JNPT (Import) or being
transported via road and consolidated at JNPT (Export). South Gujarat
3 year-Chart
volumes will now head straight to the Vapi ICD; thus the company can now
cater to bulk commodities and domestic traffic that it had been rejecting owing
250
to capacity constraints at CFS.
200
We expect NCL to successfully use its rail advantage and scale up its
150
utilizations at both JNPT and Vapi ICD. We have a Buy rating on the stock.
100
Key Financials
50
Y/E
Sales
OPM PAT EPS ROE P/E P/BV EV/EBITDA EV/Sales
0
March
(` cr)
(%)
(` cr)
(`)
(%)
(x)
(x)
(x)
(x)
FY2017E
408
42.9
97
6.8
6.9
30.3
2.1
18.8
8.1
FY2018E
612
42.3
164
11.5
10.5
17.8
1.9
12.7
5.4
Source: Company, Angel Research
Source: Company, Angel Research
Stock Info
Radico Khaitan
CMP
90
The IMFL segment is under penetrated. Going forward, increase in income
TP
125
levels would lead to higher growth in IMFL brands. RKL has strong brands in
Upside
39.3%
the premium liquor category which reported a CAGR of ~26% over the last
Sector
Breweries & Distilleries
seven-year period. We expect the growth momentum to continue.
Market Cap (` cr)
1,202
We expect the price of ENA, a key raw material, to remain stable and
Beta
0.8
potentially even decline going forward due to higher sugar production and
lower demand for ethanol from Indian oil marketing companies
52 Week High / Low
131/81
We expect a significant hike in liquor prices in the coming financial year as
3 year-Chart
there haven't been any significant ones in recent times. Also, we believe that
industry leader - United Spirits would shift focus on profitability over volume
180
160
growth considering the debt on its balance sheet, which in turn, would lead to
140
increased scope for other liquor companies to hike prices.
120
100
On valuation basis, Radico is trading at huge discount to its close peer United
80
Spirits. We have a Buy rating on the stock and target price of
`125
60
(18x FY2018E EPS)
40
20
0
Key Financials
Y/E
Sales
OPM PAT EPS ROE P/E P/BV EV/EBITDA EV/Sales
March
(` cr)
(%)
(` cr)
(`)
(%)
(x)
(x)
(x)
(x)
FY2017E
1,659
13.0
84
6.3
8.6
14.2
1.2
8.9
1.2
Source: Company, Angel Research
FY2018E
1,802
13.2
98
7.4
9.3
12.2
1.1
8.0
1.1
Source: Company, Angel Research
August 5, 2016
13
Top Picks Report | August 2016
Stock Info
Siyaram Silk Mills
CMP
1,050
SSML has strong brands which cater to premium as well as popular mass
TP
1,347
segments of the market. Further, in FY2014, SSML entered the ladies' salwar
Upside
28.3%
kameez and ethnic wear segment. Going forward, we believe that the company
Sector
Textile
would be able to leverage its brand equity and continue to post strong performance.
Market Cap (` cr)
984
The company has a nationwide network of about 1,600 dealers and business
Beta
0.8
partners. It has a retail network of 160 stores and plans to add another 300-
350 stores going forward. Further, the company's brands are sold across
52 Week High / Low
1,400/896
3,00,000 multi brand outlets in the country.
Going forward, we expect SSML to report a net sales CAGR of ~12% to
3 year-Chart
~`2,040cr and adj.net profit CAGR of ~14% to `115cr over FY2016-18E on
1600
back of market leadership in blended fabrics, strong brand building, wide
1400
distribution channel, strong presence in tier II and tier III cities and emphasis
1200
1000
on latest designs and affordable pricing points. At the current market price,
800
SSML trades at an inexpensive valuation. We have a Buy rating on the stock
600
and target price of `1,347.
400
200
Key Financials
0
Y/E
Sales
OPM PAT EPS ROE P/E P/BV EV/EBITDA EV/Sales
March
(` cr)
(%)
(` cr)
(`)
(%)
(x)
(x)
(x)
(x)
FY2017E
1,799
11.6
98
104.9
16.4
10.0
1.6
6.4
0.7
Source: Company, Angel Research
FY2018E
2,040
11.7
115
122.4
16.4
8.6
1.4
5.5
0.7
Source: Company, Angel Research
Stock Info
TV Today Network
CMP
297
TTNL enjoys a strong viewership ranking in the Hindi and English news
TP
363
channel categories. The company’s Hindi news channel - Aaj Tak has
Upside
22.4%
maintained its market leadership position occupying the No.1 rank for several
Sector
Textile
consecutive years in terms of viewership. Its English news channel - India
Today too has been continuously gaining viewership; it has now captured the
Market Cap (` cr)
1,787
No. 2 ranking from No. 4 earlier. Its other channels like Dilli Aaj Tak and Tez
Beta
1.3
are also popular among viewers.
52 Week High / Low
351 /186
Out of the 7 radio stations, TTNL has sold off 4 (Jodhpur, Amritsar, Patiala
and Shimla) for `4cr. The remaining 3 stations are in the process of getting
3 year-Chart
sold off to ENIL but the sale will have to wait until concerns raised by the MIB
400
are resolved. Going forward, we expect them to be sold off and this would
350
prop up the company’s profitability.
300
250
We expect TTNL to report a net revenue CAGR of ~16% to ~`743cr and net
200
profit CAGR of ~16% to `128cr over FY2016-18E. We have a Buy rating on
150
the stock and target price of `363.
100
50
0
Key Financials
Y/E
Sales
OPM PAT EPS ROE P/E P/BV EV/EBITDA EV/Sales
March
(` cr)
(%)
(` cr)
(`)
(%)
(x)
(x)
(x)
(x)
FY2017E
637
27.5
110
18.4
17.4
16.2
2.8
8.7
2.4
Source: Company, Angel Research
FY2018E
743
27.5
128
21.4
17.2
13.9
2.4
7.1
1.9
Source: Company, Angel Research
August 5, 2016
14
Top Picks Report | August 2016
Macro watch
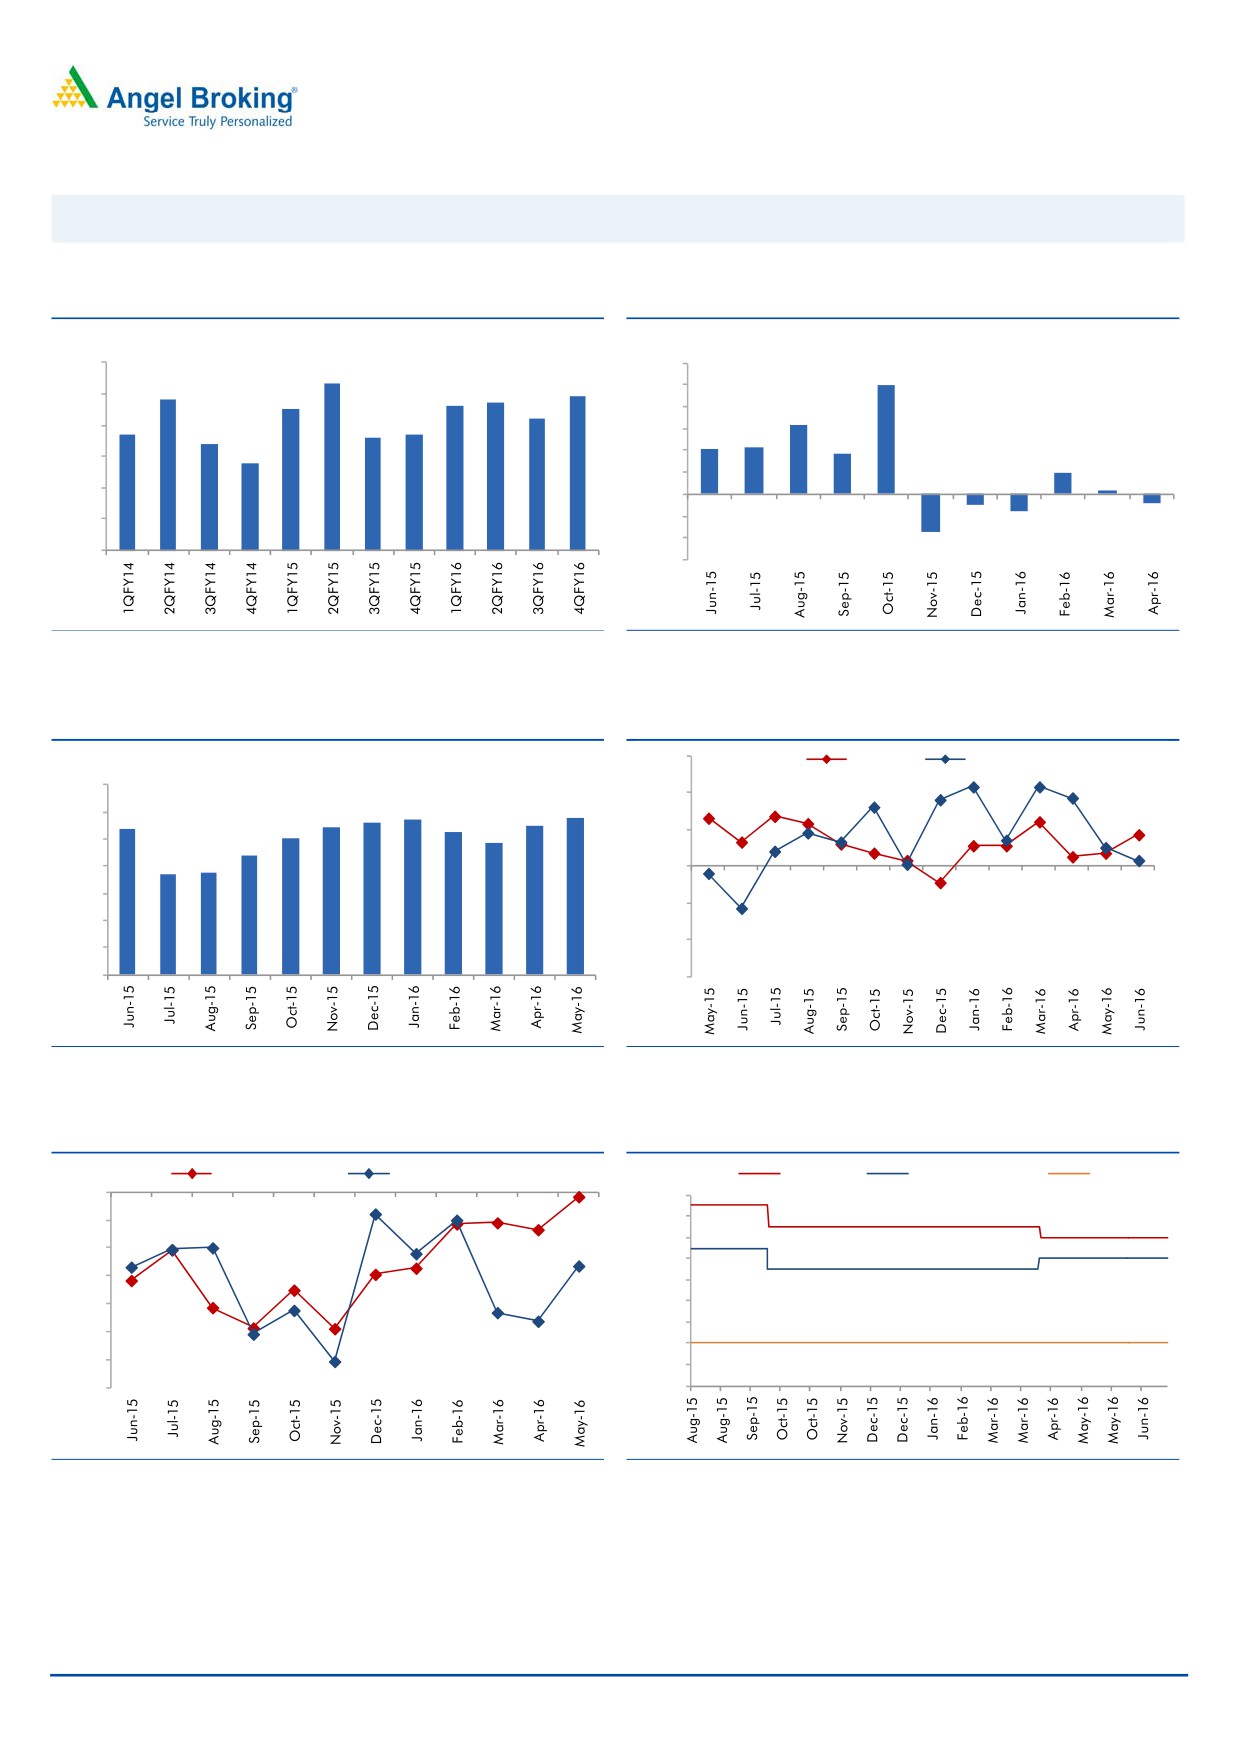
Exhibit 1: Quarterly GDP trends
Exhibit 2: IIP trends
(%)
(%)
9.0
12.0
8.3
9.9
7.8
7.7
7.9
10.0
8.0
7.5
7.6
7.2
8.0
6.3
6.7
6.6
6.7
7.0
6.4
6.0
4.2
4.3
3.7
5.8
4.0
6.0
2.0
2.0
0.3
5.0
-
4.0
(2.0)
(0.9)
(0.8)
(1.6)
(4.0)
3.0
(3.4)
(6.0)
Source: CSO, Angel Research
Source: MOSPI, Angel Research
Exhibit 3: Monthly CPI inflation trends
Exhibit 4: Manufacturing and services PMI
56.0
Mfg. PMI
Services PMI
(%)
7.0
54.0
5.7
5.8
5.4
5.4
5.6
5.5
6.0
5.3
5.0
4.8
52.0
5.0
4.4
3.7
3.7
4.0
50.0
3.0
48.0
2.0
46.0
1.0
-
44.0
Source: MOSPI, Angel Research
Source: Market, Angel Research; Note: Level above 50 indicates expansion
Exhibit 5: Exports and imports growth trends
Exhibit 6: Key policy rates
(%)
Exports yoy growth
Imports yoy growth
(%)
Repo rate
Reverse Repo rate
CRR
0.0
7.50
(5.0)
7.00
6.50
(10.0)
6.00
(15.0)
5.50
(20.0)
5.00
4.50
(25.0)
4.00
(30.0)
3.50
(35.0)
3.00
Source: Bloomberg, Angel Research
Source: RBI, Angel Research
August 5, 2016
15
Top Picks Report | August 2016
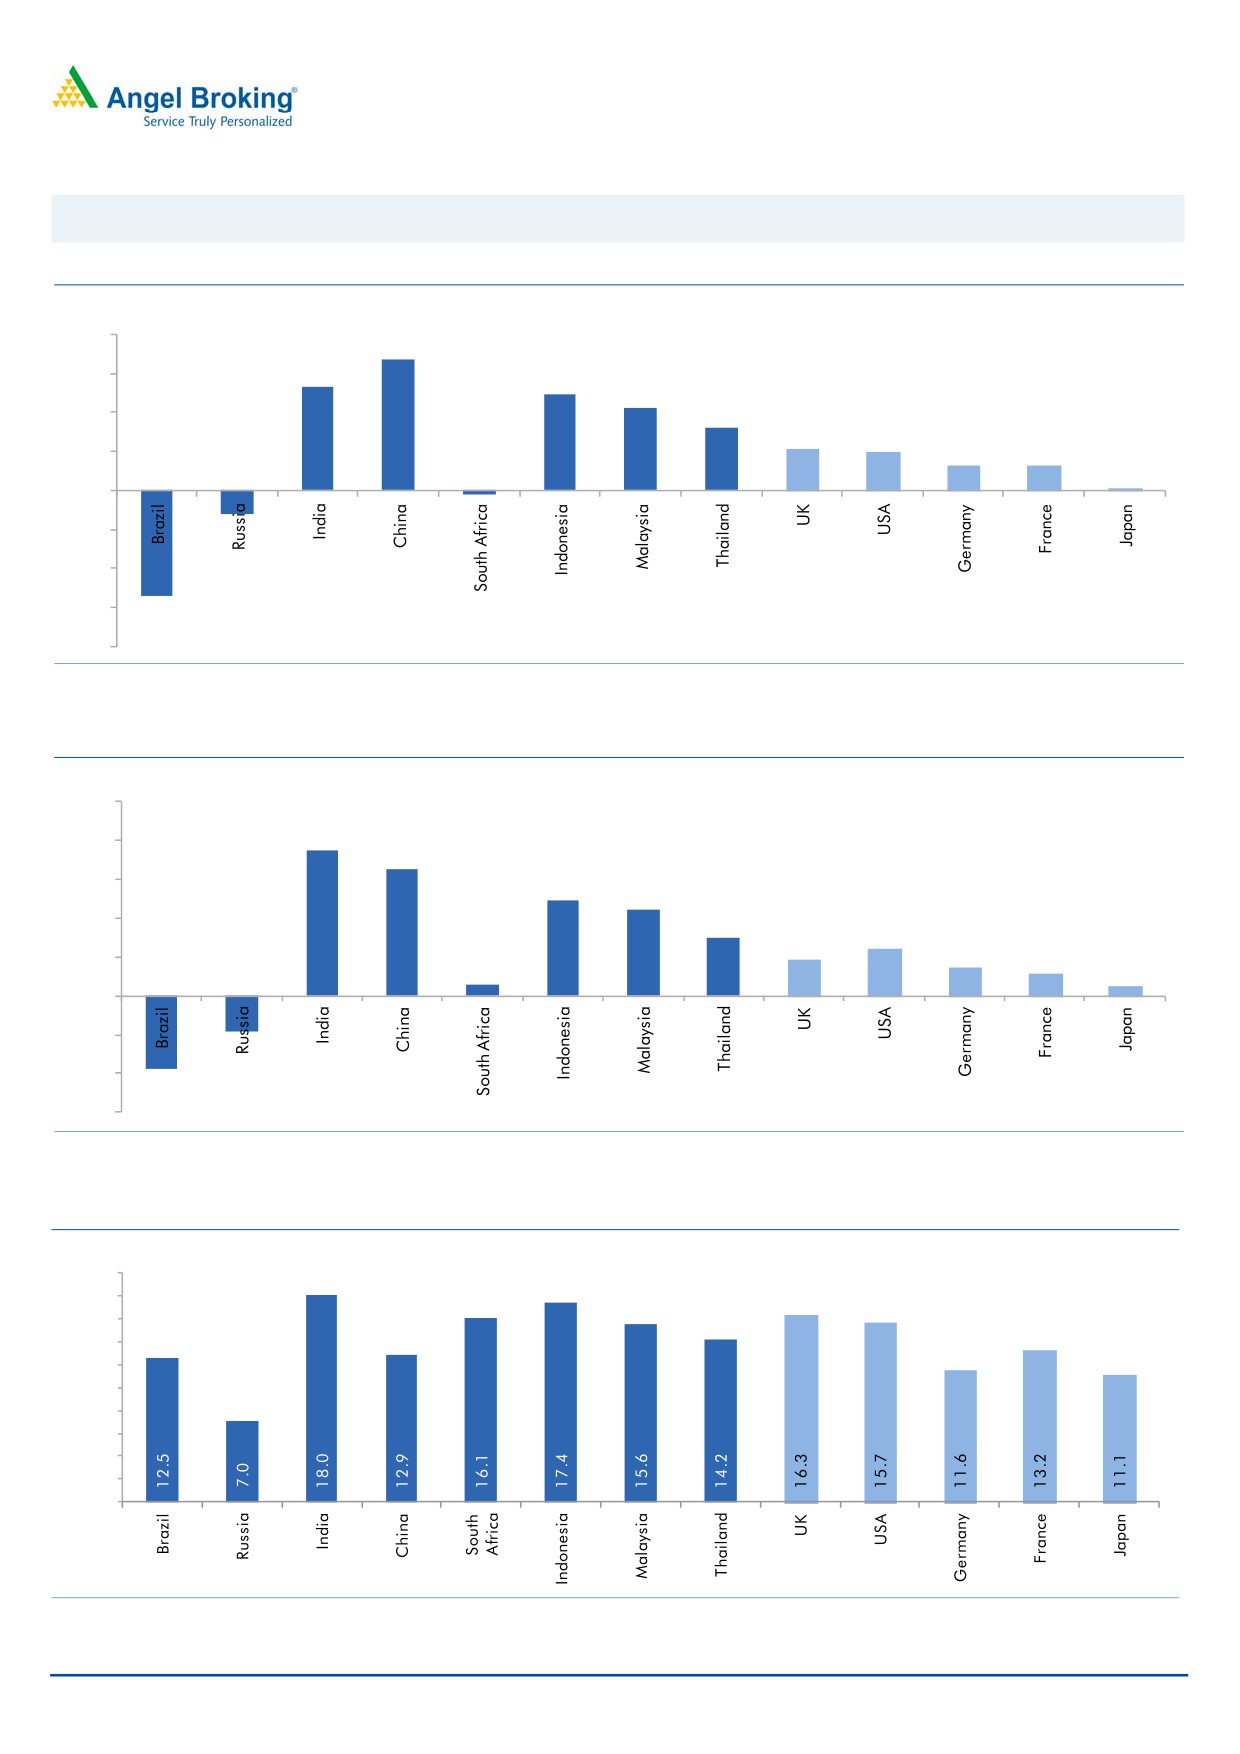
Global watch
Exhibit 1: Latest quarterly GDP Growth (%, yoy) across select developing and developed countries
(%)
8.0
6.7
6.0
5.3
4.9
4.2
4.0
3.2
2.1
2.0
2.0
1.3
1.3
0.1
-
(2.0)
(4.0)
(1.2)
(6.0)
(0.2)
(5.4)
(8.0)
Source: Bloomberg, Angel Research
Exhibit 2: 2015 GDP Growth projection by IMF (%, yoy) across select developing and developed countries
(%)
10.0
7.5
8.0
6.5
6.0
4.9
4.4
4.0
3.0
2.4
1.9
1.5
2.0
1.1
0.6
0.5
(3.8)
(1.8)
-
(2.0)
(4.0)
(6.0)
Source: IMF, Angel Research
Exhibit 3: One year forward P-E ratio across select developing and developed countries
(x)
20.0
18.0
16.0
14.0
12.0
10.0
8.0
6.0
4.0
2.0
-
Source: IMF, Angel Research
August 5, 2016
16
Top Picks Report | August 2016
Exhibit 4: Relative performance of indices across globe
Returns (%)
Country
Name of index
Closing price
1M
3M
1YR
Brazil
Bovespa
50,620
(3.1)
12.8
(6.7)
Russia
Micex
1,887
(3.4)
2.3
15.8
India
Nifty
8,221
6.7
16.9
(2.5)
China
Shanghai Composite
2,939
(1.8)
2.8
(40.5)
South Africa
Top 40
48,084
5.5
9.8
4.3
Mexico
Mexbol
45,928
1.3
2.9
3.1
Indonesia
LQ45
831
0.5
(0.7)
(9.8)
Malaysia
KLCI
1,636
(1.3)
(3.3)
(6.4)
Thailand
SET 50
917
3.3
7.7
(8.0)
USA
Dow Jones
17,807
0.3
5.1
(0.2)
UK
FTSE
6,210
0.4
0.9
(8.5)
Japan
Nikkei
16,642
(0.1)
3.8
(18.6)
Germany
DAX
10,103
1.8
3.3
(8.2)
France
CAC
4,422
2.3
0.1
(9.8)
Source: Bloomberg, Angel Research
August 5, 2016
17
Top Picks Report | August 2016
Stock Watch
August 5, 2016
18
Stock Watch | August 2016
Company Name
Reco
CMP
Target
Mkt Cap
Sales (` cr)
OPM (%)
EPS (`)
PER (x)
P/BV (x)
RoE (%)
EV/Sales (x)
(`)
Price (`)
(` cr)
FY17E
FY18E
FY17E
FY18E
FY17E
FY18E
FY17E
FY18E
FY17E
FY18E
FY17E
FY18E
FY17E
FY18E
Agri / Agri Chemical
Rallis
Neutral
218
-
4,235
1,937
2,164
13.3
14.3
9.0
11.0
24.2
19.8
4.2
3.7
18.4
19.8
2.2
2.0
United Phosphorus
Buy
602
684
25,796
15,176
17,604
18.5
18.5
37.4
44.6
16.1
13.5
3.2
2.6
21.4
21.2
1.8
1.5
Auto & Auto Ancillary
Ashok Leyland
Buy
86
111
24,588
22,407
26,022
10.6
10.6
5.2
6.4
16.6
13.5
3.7
3.2
23.6
24.7
1.2
1.0
Bajaj Auto
Neutral
2,740
-
79,281
25,093
27,891
19.5
19.2
143.9
162.5
19.0
16.9
5.3
4.6
30.3
29.3
2.9
2.5
Bharat Forge
Buy
724
875
16,843
7,726
8,713
20.5
21.2
35.3
42.7
20.5
16.9
3.8
3.4
18.9
20.1
2.2
1.9
Eicher Motors
Neutral
21,404
-
58,136
16,583
20,447
17.5
18.0
598.0
745.2
35.8
28.7
12.2
9.3
41.2
38.3
3.3
2.6
Gabriel India
Neutral
103
-
1,480
1,544
1,715
9.0
9.3
5.4
6.3
19.1
16.4
3.6
3.2
18.9
19.5
0.9
0.8
Hero Motocorp
Neutral
3,270
-
65,300
31,253
35,198
15.3
15.0
172.3
192.1
19.0
17.0
6.9
6.0
38.9
37.0
1.9
1.7
Jamna Auto Industries Neutral
191
-
1,524
1,486
1,620
9.8
9.9
15.0
17.2
12.7
11.1
2.8
2.4
21.8
21.3
1.1
1.0
L G Balakrishnan & Bros Neutral
465
-
729
1,302
1,432
11.6
11.9
43.7
53.0
10.6
8.8
1.5
1.4
13.8
14.2
0.6
0.6
Mahindra and Mahindra Neutral
1,437
-
89,229
46,534
53,077
11.6
11.7
67.3
78.1
21.3
18.4
3.5
3.0
15.4
15.8
1.9
1.6
Maruti
Neutral
4,888
-
147,648
69,186
82,217
14.7
14.4
198.5
241.4
24.6
20.2
4.8
3.9
20.2
19.9
1.8
1.5
Minda Industries
Neutral
1,155
-
1,832
2,728
3,042
9.0
9.1
68.2
86.2
16.9
13.4
3.8
3.0
23.8
24.3
0.7
0.6
Motherson Sumi
Neutral
348
-
45,992
45,896
53,687
7.8
8.2
13.0
16.1
26.7
21.6
8.6
6.9
34.7
35.4
1.0
0.9
Rane Brake Lining
Neutral
610
-
483
511
562
11.3
11.5
28.1
30.9
21.7
19.7
3.3
3.0
15.3
15.0
1.0
0.9
Setco Automotive
Neutral
50
-
668
741
837
13.0
13.0
15.2
17.0
3.3
2.9
0.5
0.5
15.8
16.3
1.3
1.2
Tata Motors
Neutral
500
-
144,447
300,209
338,549
8.9
8.4
42.7
54.2
11.7
9.2
1.9
1.6
15.6
17.2
0.6
0.5
TVS Motor
Accumulate
299
330
14,186
13,390
15,948
6.9
7.1
12.8
16.5
23.4
18.0
5.8
4.6
26.3
27.2
1.1
0.9
Amara Raja Batteries
Buy
876
1,076
14,968
5,717
6,733
18.7
18.8
38.4
48.9
22.8
17.9
5.7
4.6
25.3
24.8
2.6
2.1
Exide Industries
Neutral
173
-
14,714
7,439
8,307
15.0
15.0
8.1
9.3
21.4
18.6
3.0
2.7
14.3
16.7
1.6
1.4
Apollo Tyres
Buy
161
183
8,195
12,877
14,504
14.3
13.9
21.4
23.0
7.5
7.0
1.2
1.0
16.4
15.2
0.8
0.7
Ceat
Buy
856
1,119
3,462
7,524
8,624
13.0
12.7
131.1
144.3
6.5
5.9
1.2
1.0
19.8
18.6
0.5
0.5
JK Tyres
Neutral
91
-
2,062
7,455
8,056
15.0
15.0
21.8
24.5
4.2
3.7
0.9
0.7
22.8
21.3
0.4
0.3
Swaraj Engines
Neutral
1,120
-
1,391
660
810
15.2
16.4
54.5
72.8
20.5
15.4
6.4
5.8
31.5
39.2
1.9
1.6
Subros
Neutral
97
-
579
1,488
1,681
11.7
11.9
6.4
7.2
15.1
13.5
1.6
1.4
10.8
11.4
0.6
0.5
Indag Rubber
Neutral
176
-
463
286
326
19.8
16.8
11.7
13.3
15.1
13.2
2.5
2.4
17.8
17.1
1.3
1.1
Banking
Axis Bank
Neutral
546
-
130,245
58,081
66,459
3.5
3.5
32.3
44.6
16.9
12.2
2.2
1.93
13.6
16.5
-
-
Bank of Baroda
Neutral
156
-
35,830
19,980
23,178
1.8
1.8
11.5
17.3
13.5
9.0
1.5
1.3
8.3
10.1
-
-
Canara Bank
Neutral
257
-
13,966
15,225
16,836
1.8
1.8
14.5
28.0
17.7
9.2
1.2
1.0
5.8
8.5
-
-
Dewan Housing Finance Buy
234
270
6,838
2,225
2,688
2.9
2.9
29.7
34.6
7.9
6.8
1.3
1.1
16.1
16.8
-
-
Equitas Holdings
Buy
172
235
5,772
939
1,281
11.7
11.5
5.8
8.2
29.7
21.0
2.6
2.3
10.9
11.5
-
-
Federal Bank
Neutral
63
-
10,790
9,353
10,623
2.9
2.9
4.4
5.8
14.3
10.8
1.4
1.2
9.5
11.0
-
-
HDFC
Neutral
1,320
-
208,664
11,475
13,450
3.4
3.4
45.3
52.5
29.1
25.1
5.6
5.0
20.2
20.5
-
-
HDFC Bank
Neutral
1,242
-
314,430
46,097
55,433
4.5
4.5
58.4
68.0
21.3
18.3
3.7
3.12
18.8
18.6
-
-
ICICI Bank
Neutral
241
-
139,984
39,029
45,903
3.3
3.3
16.7
16.3
14.4
14.8
1.8
1.6
10.1
12.4
-
-
LIC Housing Finance
Buy
511
582
25,803
3,712
4,293
2.6
2.5
39.0
46.0
13.1
11.1
2.5
2.1
19.9
20.1
-
-
August 5, 2016
19
Stock Watch | August 2016
Company Name
Reco
CMP
Target
Mkt Cap
Sales (` cr)
OPM (%)
EPS (`)
PER (x)
P/BV (x)
RoE (%)
EV/Sales (x)
(`)
Price (`)
(` cr)
FY17E
FY18E
FY17E
FY18E
FY17E
FY18E
FY17E
FY18E
FY17E
FY18E
FY17E
FY18E
FY17E
FY18E
Punjab Natl.Bank
Neutral
122
-
24,034
23,532
23,595
2.3
2.4
6.8
12.6
18.0
9.7
2.8
2.0
3.3
6.5
-
-
South Ind.Bank
Neutral
21
-
2,869
6,435
7,578
2.5
2.5
2.7
3.1
7.9
6.9
1.0
0.9
10.1
11.2
-
-
St Bk of India
Neutral
221
-
171,169
79,958
86,060
2.6
2.6
13.4
20.7
16.5
10.7
1.3
1.3
11.5
12.8
-
-
Union Bank
Neutral
133
-
9,140
12,646
14,129
2.3
2.4
31.0
39.1
4.3
3.4
0.5
0.4
9.8
11.4
-
-
Vijaya Bank
Neutral
43
-
4,270
3,536
3,827
1.8
1.9
5.5
6.7
7.7
6.4
0.6
0.6
7.8
8.8
-
-
Yes Bank
Neutral
1,112
-
46,823
7,190
9,011
3.2
3.3
58.2
69.7
19.1
16.0
3.4
2.9
19.2
19.6
-
-
Capital Goods
ACE
Neutral
46
-
458
709
814
4.1
4.6
1.4
2.1
33.1
22.0
1.4
1.3
4.4
6.0
0.8
0.7
BEML
Buy
992
1,157
4,129
3,451
4,055
6.3
9.2
31.4
57.9
31.6
17.1
1.9
1.7
6.3
10.9
1.3
1.1
Bharat Electronics
Accumulate
1,231
1,414
29,543
8,137
9,169
16.8
17.2
58.7
62.5
21.0
19.7
3.2
2.9
44.6
46.3
2.6
2.4
Voltas
Buy
347
407
11,485
6,511
7,514
7.9
8.7
12.9
16.3
26.9
21.3
4.8
4.2
16.7
18.5
1.5
1.3
BGR Energy
Neutral
120
-
865
16,567
33,848
6.0
5.6
7.8
5.9
15.4
20.3
0.9
0.8
4.7
4.2
0.1
0.1
BHEL
Accumulate
134
142
32,773
28,797
34,742
-
2.8
2.3
6.9
58.2
19.4
1.0
1.0
1.3
4.8
0.8
0.5
Blue Star
Accumulate
484
495
4,611
4,351
5,024
6.4
7.1
17.2
20.6
28.2
23.4
18.3
15.3
23.1
24.1
1.1
0.9
Crompton Greaves
Neutral
79
-
4,939
5,777
6,120
5.9
7.0
3.3
4.5
23.9
17.5
1.0
1.0
4.4
5.9
0.8
0.6
Greaves Cotton
Neutral
139
-
3,397
1,755
1,881
16.8
16.9
7.8
8.5
17.8
16.4
3.6
3.3
20.6
20.9
1.7
1.5
Inox Wind
Buy
216
286
4,789
5,605
6,267
15.7
16.4
24.8
30.0
8.7
7.2
2.4
1.8
25.9
24.4
0.9
0.8
KEC International
Neutral
142
-
3,642
9,294
10,186
7.9
8.1
9.9
11.9
14.3
11.9
2.1
1.8
15.6
16.3
0.6
0.6
Thermax
Neutral
844
-
10,059
5,421
5,940
7.3
7.3
25.7
30.2
32.8
28.0
4.0
3.6
12.2
13.1
1.8
1.6
VATech Wabag
Buy
582
681
3,173
3,136
3,845
8.9
9.1
26.0
35.9
22.4
16.2
2.8
2.4
13.4
15.9
0.9
0.7
Cement
ACC
Neutral
1,662
-
31,213
11,225
13,172
13.2
16.9
44.5
75.5
37.4
22.0
3.5
3.3
11.2
14.2
2.8
2.4
Ambuja Cements
Neutral
264
-
41,024
9,350
10,979
18.2
22.5
5.8
9.5
45.6
27.8
3.8
3.4
10.2
12.5
4.4
3.7
India Cements
Neutral
117
-
3,579
4,364
4,997
18.5
19.2
7.9
11.3
14.7
10.3
1.1
1.0
8.0
8.5
1.6
1.4
JK Cement
Neutral
732
-
5,119
4,398
5,173
15.5
17.5
31.2
55.5
23.5
13.2
2.8
2.4
12.0
15.5
1.7
1.4
J K Lakshmi Cement
Neutral
421
-
4,959
2,913
3,412
14.5
19.5
7.5
22.5
56.2
18.7
3.5
2.9
12.5
18.0
2.3
1.9
Orient Cement
Neutral
164
-
3,359
2,114
2,558
18.5
20.5
8.1
11.3
20.2
14.5
3.0
2.5
14.0
2.2
1.7
UltraTech Cement
Neutral
3,661
-
100,472
25,768
30,385
21.0
23.5
111.0
160.0
33.0
22.9
4.2
3.7
13.5
15.8
4.0
3.3
Construction
ITNL
Buy
71
93
2,334
8,946
10,017
31.0
31.6
8.1
9.1
8.8
7.8
0.3
0.3
4.2
5.0
3.6
3.3
KNR Constructions
Neutral
585
-
1,645
1,210
1,595
15.4
16.0
33.9
52.1
17.3
11.2
2.6
2.3
13.6
18.0
1.4
1.0
Larsen & Toubro
Buy
1,470
1,700
137,038
67,665
77,249
10.7
11.5
57.3
71.2
25.7
20.7
2.3
2.2
12.6
14.3
2.2
1.9
Gujarat Pipavav Port
Neutral
170
-
8,235
705
788
52.2
51.7
5.0
5.6
34.1
30.4
3.4
3.0
11.2
11.2
11.3
9.6
MBL Infrastructures
Buy
120
285
498
2,797
3,405
14.7
15.4
21.0
34.8
5.7
3.5
0.6
0.5
11.0
16.2
0.8
0.8
Nagarjuna Const.
Neutral
77
-
4,281
8,842
9,775
9.1
8.8
5.3
6.4
14.5
12.0
1.1
1.1
8.2
9.1
0.6
0.5
PNC Infratech
Buy
554
647
2,842
2,350
2,904
13.4
13.7
48.0
42.0
11.5
13.2
2.2
2.0
16.8
13.2
1.3
1.1
Simplex Infra
Neutral
293
-
1,447
6,829
7,954
10.5
10.5
31.4
37.4
9.3
7.8
1.0
0.9
9.9
13.4
0.6
0.5
Power Mech Projects
Neutral
538
-
792
1,801
2,219
12.7
14.6
72.1
113.9
7.5
4.7
1.4
1.2
16.8
11.9
0.4
0.3
Sadbhav Engineering
Accumulate
289
298
4,960
3,598
4,140
10.3
10.6
9.0
11.9
32.1
24.3
3.4
3.0
9.9
11.9
1.6
1.4
August 5, 2016
20
Stock Watch | August 2016
Company Name
Reco
CMP
Target
Mkt Cap
Sales (` cr)
OPM (%)
EPS (`)
PER (x)
P/BV (x)
RoE (%)
EV/Sales (x)
(`)
Price (`)
(` cr)
FY17E
FY18E
FY17E
FY18E
FY17E
FY18E
FY17E
FY18E
FY17E
FY18E
FY17E
FY18E
FY17E
FY18E
NBCC
Neutral
242
-
14,499
7,428
9,549
7.9
8.6
8.2
11.0
29.5
22.0
1.5
1.2
28.2
28.7
1.6
1.2
MEP Infra
Neutral
43
-
705
1,877
1,943
30.6
29.8
3.0
4.2
14.5
10.3
7.0
4.7
0.6
0.6
1.7
1.6
SIPL
Neutral
99
-
3,487
1,036
1,252
65.5
66.2
(8.4)
(5.6)
-
-
3.7
4.2
(22.8)
(15.9)
11.6
9.7
Engineers India
Neutral
218
-
7,328
1,725
1,935
16.0
19.1
11.4
13.9
19.1
15.6
2.6
2.5
13.4
15.3
3.1
2.8
FMCG
Asian Paints
Neutral
1,127
-
108,073
17,128
18,978
16.8
16.4
19.1
20.7
59.0
54.4
20.5
19.4
34.8
35.5
6.3
5.7
Britannia
Neutral
2,873
-
34,472
9,795
10,940
14.1
14.1
80.3
93.0
35.8
30.9
14.7
11.4
41.2
-
3.3
2.9
Colgate
Neutral
940
-
25,567
4,605
5,249
22.8
22.8
25.2
28.5
37.3
33.0
25.3
22.5
64.8
66.8
5.5
4.8
Dabur India
Neutral
296
-
52,035
9,405
10,581
18.1
18.3
8.1
9.2
36.5
32.2
10.2
8.4
31.6
31.0
5.2
4.6
GlaxoSmith Con*
Neutral
6,355
-
26,725
4,959
5,623
17.4
18.0
190.5
219.3
33.4
29.0
9.1
7.9
29.6
29.5
4.7
4.1
Godrej Consumer
Neutral
1,584
-
53,929
10,335
11,518
18.4
18.6
41.5
46.0
38.2
34.4
8.5
7.2
24.9
24.8
5.2
4.6
HUL
Neutral
916
-
198,234
35,252
38,495
17.6
17.4
20.4
21.9
44.8
41.8
36.9
32.3
82.2
77.3
5.4
5.0
ITC
Accumulate
252
283
304,124
40,059
44,439
39.0
39.2
9.1
10.1
27.7
25.0
7.5
6.6
27.2
26.5
7.1
6.4
Marico
Neutral
295
-
38,047
6,730
7,649
17.3
17.5
6.4
7.6
46.1
38.8
13.9
11.7
33.2
32.5
5.5
4.8
Nestle*
Neutral
6,787
-
65,439
9,393
10,507
22.2
22.3
106.8
121.8
63.6
55.7
22.3
20.1
34.8
36.7
6.8
6.0
Tata Global
Neutral
138
-
8,729
9,072
9,687
9.4
9.8
7.2
7.8
19.2
17.7
2.1
2.0
7.6
7.9
0.9
0.9
Procter & Gamble
Buy
6,351
7,369
20,615
2,939
3,342
23.2
23.0
146.2
163.7
43.4
38.8
97.3
93.3
25.3
23.5
6.6
5.7
IT
HCL Tech^
Buy
824
1,000
116,197
49,242
57,168
20.5
20.5
55.7
64.1
14.8
12.8
3.0
2.3
20.3
17.9
1.9
1.4
Infosys
Buy
1,072
1,370
246,267
69,934
79,025
27.5
27.5
64.8
72.0
16.5
14.9
3.6
3.3
22.0
22.3
3.0
2.6
TCS
Accumulate
2,653
3,004
522,686
121,684
136,286
27.3
27.3
135.0
150.1
19.6
17.7
6.5
6.0
33.2
33.9
4.1
3.6
Tech Mahindra
Buy
500
700
48,502
30,347
33,685
17.0
17.0
37.5
41.3
13.3
12.1
2.9
2.5
21.8
20.7
1.3
1.1
Wipro
Buy
548
680
135,494
51,631
55,822
21.7
17.9
35.9
36.9
15.3
14.9
3.2
2.9
19.0
18.1
2.3
2.1
Media
D B Corp
Neutral
408
-
7,495
2,187
2,329
27.4
28.2
18.9
21.0
21.6
19.4
4.5
3.9
23.7
23.1
3.3
3.0
HT Media
Neutral
83
-
1,921
2,673
2,891
13.2
13.8
7.2
8.5
11.5
9.7
0.9
0.8
7.8
8.3
0.3
0.2
Jagran Prakashan
Accumulate
185
205
6,150
2,355
2,635
28.0
28.0
10.8
12.5
17.1
14.8
3.7
3.2
21.7
21.7
2.6
2.3
Sun TV Network
Neutral
461
-
18,171
2,850
3,265
70.1
71.0
26.2
30.4
17.6
15.2
4.5
4.0
24.3
25.6
5.8
4.9
Hindustan Media Ven.
Neutral
270
-
1,981
1,016
1,138
21.5
21.5
23.3
25.8
11.6
10.5
1.9
1.7
16.2
15.8
1.3
1.1
Metal
Coal India
Neutral
324
-
204,492
84,638
94,297
21.4
22.3
24.5
27.1
13.2
11.9
5.5
5.2
42.6
46.0
1.9
1.7
Hind. Zinc
Neutral
208
-
87,992
14,252
18,465
55.9
48.3
15.8
21.5
13.2
9.7
2.1
1.9
17.0
20.7
6.1
4.7
Hindalco
Neutral
137
-
28,301
107,899
112,095
7.4
8.2
9.2
13.0
14.9
10.5
0.7
0.7
4.8
6.6
0.8
0.7
JSW Steel
Neutral
1,706
-
41,243
53,201
58,779
16.1
16.2
130.6
153.7
13.1
11.1
1.8
1.5
14.0
14.4
1.5
1.3
NMDC
Neutral
102
-
40,440
6,643
7,284
44.4
47.7
7.1
7.7
14.4
13.2
1.2
1.2
8.8
9.2
3.7
3.4
SAIL
Neutral
47
-
19,329
47,528
53,738
(0.7)
2.1
(1.9)
2.6
-
18.0
0.5
0.5
(1.6)
3.9
1.2
1.1
Vedanta
Neutral
162
-
47,924
71,744
81,944
19.2
21.7
13.4
20.1
12.1
8.0
1.0
0.9
8.4
11.3
1.0
0.8
Tata Steel
Neutral
374
-
36,328
121,374
121,856
7.2
8.4
18.6
34.3
20.1
10.9
1.3
1.1
6.1
10.1
0.9
0.9
August 5, 2016
21
Stock Watch | August 2016
Company Name
Reco
CMP
Target
Mkt Cap
Sales (` cr)
OPM (%)
EPS (`)
PER (x)
P/BV (x)
RoE (%)
EV/Sales (x)
(`)
Price (`)
(` cr)
FY17E
FY18E
FY17E
FY18E
FY17E
FY18E
FY17E
FY18E
FY17E
FY18E
FY17E
FY18E
FY17E
FY18E
Oil & Gas
Cairn India
Neutral
189
-
35,369
9,127
10,632
4.3
20.6
8.8
11.7
21.4
16.1
0.7
0.7
3.3
4.2
5.2
4.3
GAIL
Neutral
374
-
47,403
56,220
65,198
9.3
10.1
27.1
33.3
13.8
11.2
1.3
1.2
9.3
10.7
1.0
0.9
ONGC
Accumulate
220
235
188,306
137,222
152,563
15.0
21.8
19.5
24.1
11.3
9.1
1.0
0.9
8.5
10.1
1.6
1.5
Indian Oil Corp
Neutral
546
-
132,518
373,359
428,656
5.9
5.5
54.0
59.3
10.1
9.2
1.6
1.4
16.0
15.6
0.5
0.4
Reliance Industries
Neutral
993
-
322,023
301,963
358,039
12.1
12.6
87.7
101.7
11.3
9.8
1.2
1.1
10.7
11.3
1.5
1.3
Pharmaceuticals
Alembic Pharma
Neutral
631
-
11,897
3,483
4,083
20.2
21.4
24.3
30.4
26.0
20.8
5.9
4.7
25.5
25.3
3.3
2.7
Aurobindo Pharma
Buy
752
877
44,016
15,720
18,078
23.7
23.7
41.4
47.3
18.2
15.9
4.7
3.7
29.6
26.1
3.0
2.6
Sanofi India*
Neutral
4,503
-
10,371
2,357
2,692
17.3
17.3
153.5
169.2
29.3
26.6
5.0
4.0
25.8
28.4
4.1
3.4
Cadila Healthcare
Buy
369
400
37,766
11,126
13,148
22.0
22.0
17.1
20.0
21.6
18.4
5.5
4.4
28.8
26.6
3.2
2.6
Cipla
Neutral
526
-
42,284
15,378
18,089
17.4
18.4
21.6
27.2
24.4
19.3
3.2
2.7
13.7
15.2
3.0
2.5
Dr Reddy's
Neutral
2,964
-
50,546
16,043
18,119
23.1
24.7
126.0
157.8
23.5
18.8
3.5
3.0
15.7
17.1
3.1
2.7
Dishman Pharma
Neutral
176
-
2,839
1,718
1,890
21.7
21.8
8.7
10.4
20.2
16.9
1.8
1.7
9.3
10.2
2.0
1.7
GSK Pharma*
Neutral
3,110
-
26,342
3,528
3,811
16.6
18.8
51.8
59.4
60.0
52.4
16.1
16.0
26.3
30.6
7.3
6.8
Indoco Remedies
Sell
314
225
2,894
1,112
1,289
18.2
18.2
13.2
15.6
23.8
20.1
4.2
3.6
19.2
19.2
2.7
2.3
Ipca labs
Buy
518
613
6,534
3,303
3,799
15.3
15.3
17.3
19.7
29.9
26.3
2.6
2.4
9.1
9.4
2.1
1.8
Lupin
Accumulate
1,658
1,809
74,727
15,912
18,644
26.4
26.7
58.1
69.3
28.5
23.9
5.5
4.5
21.4
20.9
4.8
4.0
Sun Pharma
Accumulate
849
944
204,340
31,129
35,258
30.0
30.9
28.0
32.8
30.3
25.9
4.7
3.9
18.7
18.9
6.1
5.2
Power
Tata Power
Neutral
71
-
19,149
36,916
39,557
17.4
27.1
5.1
6.3
13.9
11.2
1.2
1.1
9.0
10.3
1.5
1.4
NTPC
Neutral
159
-
130,979
86,605
95,545
17.5
20.8
11.8
13.4
13.5
11.9
1.4
1.3
10.5
11.1
2.8
2.8
Power Grid
Neutral
178
-
93,018
25,763
29,762
74.3
73.1
14.8
17.3
12.0
10.3
1.9
1.6
16.9
17.5
7.8
7.5
Real Estate
MLIFE
Buy
435
554
1,785
925
1,139
18.4
22.3
18.3
33.8
23.8
12.9
1.1
1.1
4.9
8.5
2.7
2.1
Telecom
Bharti Airtel
Neutral
365
-
146,005
105,086
114,808
34.5
34.7
12.2
16.4
29.9
22.3
2.0
1.9
6.8
8.4
2.3
2.0
Idea Cellular
Neutral
105
-
37,916
40,133
43,731
37.2
37.1
6.4
6.5
16.5
16.2
1.4
1.3
8.2
7.6
2.0
1.7
Others
Abbott India
Neutral
4,668
-
9,919
3,153
3,583
14.1
14.4
152.2
182.7
30.7
25.5
150.6
128.6
25.6
26.1
2.8
2.4
Bajaj Electricals
Accumulate
268
299
2,712
5,351
6,098
5.7
5.9
12.4
15.7
20.1
15.8
3.1
2.8
14.4
16.1
0.5
0.5
Banco Products (India)
Neutral
209
-
1,494
1,353
1,471
12.3
12.4
14.5
16.3
14.4
12.8
19.9
17.9
14.5
14.6
1.0
0.9
Coffee Day Enterprises
Neutral
237
-
4,884
2,964
3,260
20.5
21.2
4.7
8.0
-
29.6
2.7
2.5
5.5
8.5
2.1
1.8
Competent Automobiles Neutral
155
-
95
1,137
1,256
3.1
2.7
28.0
23.6
5.5
6.6
29.8
26.9
14.3
11.5
0.1
0.1
Elecon Engineering
Accumulate
56
63
606
1,482
1,660
13.7
14.5
3.9
5.8
14.3
9.6
3.3
3.1
7.8
10.9
0.7
0.6
Finolex Cables
Neutral
390
-
5,970
2,883
3,115
12.0
12.1
14.2
18.6
27.5
21.0
14.6
12.8
15.8
14.6
1.7
1.6
Garware Wall Ropes
Neutral
455
-
996
898
997
11.9
11.7
29.0
32.9
15.7
13.8
2.3
2.0
14.9
14.6
1.0
0.9
Goodyear India*
Buy
524
631
1,209
1,598
1,704
10.4
10.2
49.4
52.6
10.6
10.0
49.0
43.0
18.2
17.0
0.4
0.4
Hitachi
Neutral
1,347
-
3,663
2,081
2,433
8.8
8.9
33.4
39.9
40.3
33.8
32.5
27.1
22.1
21.4
1.8
1.5
August 5, 2016
22
Stock Watch | August 2016
Company Name
Reco
CMP
Target
Mkt Cap
Sales (` cr)
OPM (%)
EPS (`)
PER (x)
P/BV (x)
RoE (%)
EV/Sales (x)
(`)
Price (`)
(` cr)
FY17E
FY18E
FY17E
FY18E
FY17E
FY18E
FY17E
FY18E
FY17E
FY18E
FY17E
FY18E
FY17E
FY18E
HSIL
Neutral
311
-
2,247
2,384
2,515
15.8
16.3
15.3
19.4
20.3
16.0
20.2
17.4
7.8
9.3
1.1
1.0
Interglobe Aviation
Neutral
827
-
29,818
21,122
26,005
14.5
27.6
110.7
132.1
7.5
6.3
44.7
31.9
168.5
201.1
1.4
1.1
Jyothy Laboratories
Neutral
286
-
5,174
1,440
2,052
11.5
13.0
8.5
10.0
33.6
28.6
8.1
7.5
18.6
19.3
3.9
2.7
Kirloskar Engines India
Neutral
272
-
3,933
2,554
2,800
9.9
10.0
10.5
12.1
25.9
22.5
10.8
10.2
10.7
11.7
1.2
1.0
Linc Pen & Plastics
Neutral
262
-
387
382
416
9.1
9.1
13.1
14.7
20.0
17.8
3.3
2.9
16.7
16.3
1.1
1.0
M M Forgings
Buy
445
546
537
546
608
20.4
20.7
41.3
48.7
10.8
9.1
60.9
53.9
16.6
17.0
0.8
0.7
Manpasand Bever.
Neutral
695
-
3,479
836
1,087
19.6
19.4
16.9
23.8
41.1
29.2
4.9
4.3
12.0
14.8
3.8
2.8
MT Educare
Neutral
147
-
583
366
417
17.7
18.2
9.4
10.8
15.6
13.6
3.5
3.0
22.2
22.3
1.5
1.3
Narayana Hrudaya
Neutral
319
-
6,528
1,873
2,166
11.5
11.7
2.6
4.0
120.8
80.6
7.4
6.7
6.1
8.3
3.6
3.1
Navkar Corporation
Buy
205
265
2,918
408
612
42.9
42.3
6.8
11.5
30.2
17.8
2.1
1.9
6.9
10.5
8.1
5.4
Navneet Education
Neutral
95
-
2,263
1,062
1,147
24.0
24.0
6.1
6.6
15.6
14.3
3.2
2.8
20.5
19.8
2.2
2.0
Nilkamal
Neutral
1,166
-
1,740
1,995
2,165
10.7
10.4
69.8
80.6
16.7
14.5
66.6
57.9
16.6
16.5
0.9
0.7
Page Industries
Neutral
13,523
-
15,083
2,450
3,124
20.1
17.6
299.0
310.0
45.2
43.6
301.2
229.9
47.1
87.5
6.4
5.0
Parag Milk Foods
Neutral
315
-
2,653
1,919
2,231
9.3
9.6
9.4
12.9
33.4
24.4
5.2
4.3
15.5
17.5
1.5
1.3
Quick Heal
Neutral
266
-
1,865
408
495
27.3
27.0
7.7
8.8
34.4
30.3
3.2
3.2
9.3
10.6
3.6
3.0
Radico Khaitan
Buy
90
125
1,202
1,659
1,802
13.0
13.2
6.3
7.4
14.2
12.2
1.2
1.1
8.6
9.3
1.2
1.1
Relaxo Footwears
Neutral
474
-
5,685
2,085
2,469
9.2
8.2
7.6
7.9
62.7
59.6
24.3
20.7
17.9
18.8
2.9
2.4
S H Kelkar & Co.
Neutral
252
-
3,648
1,036
1,160
15.1
15.0
6.1
7.2
41.3
35.1
4.4
4.0
10.7
11.5
3.4
3.0
Siyaram Silk Mills
Buy
1,050
1,347
984
1,799
2,040
11.6
11.7
104.9
122.4
10.0
8.6
1.6
1.4
16.4
16.4
0.7
0.7
Styrolution ABS India*
Accumulate
602
643
1,059
1,440
1,537
9.2
9.0
40.6
42.6
14.8
14.1
37.9
34.4
12.3
11.6
0.7
0.6
Surya Roshni
Buy
171
201
749
3,342
3,625
7.8
7.5
17.3
19.8
9.9
8.7
18.8
15.1
10.5
10.8
0.5
0.4
Team Lease Serv.
Neutral
1,065
-
1,821
3,229
4,001
1.5
1.8
22.8
32.8
46.8
32.4
5.0
4.3
10.7
13.4
0.5
0.4
The Byke Hospitality
Neutral
164
-
657
287
384
20.5
20.5
7.6
10.7
21.6
15.3
4.5
3.6
20.7
23.5
2.3
1.7
Transport Corp. of India
Neutral
356
-
2,724
2,671
2,911
8.5
8.8
13.9
15.7
25.7
22.7
3.5
3.1
13.7
13.8
1.1
1.0
TVS Srichakra
Buy
2,348
2,932
1,798
2,304
2,614
13.7
13.8
231.1
266.6
10.2
8.8
263.8
207.7
33.9
29.3
0.8
0.7
UFO Moviez
Neutral
525
-
1,448
619
685
33.2
33.4
30.0
34.9
17.5
15.0
2.4
2.1
13.8
13.9
2.1
1.7
Visaka Industries
Neutral
156
-
248
1,051
1,138
10.3
10.4
21.0
23.1
7.4
6.7
20.0
18.7
9.0
9.2
0.5
0.5
VRL Logistics
Neutral
312
-
2,850
1,902
2,119
16.7
16.6
14.6
16.8
21.4
18.6
4.7
4.1
21.9
22.2
1.7
1.5
Wonderla Holidays
Neutral
400
-
2,260
287
355
38.0
40.0
11.3
14.2
35.4
28.2
5.1
4.4
21.4
23.9
7.5
6.1
Source: Company, Angel Research, Note: *December year end; #September year end;
&October year end; ^June year end; Price as of August 4, 2016
August 5, 2016
23
Top Picks Report | August 2016
Research Team Tel: 022 - 39357800
DISCLAIMER
Angel Broking Private Limited (hereinafter referred to as “Angel”) is a registered Member of National Stock Exchange of India Limited,
Bombay Stock Exchange Limited and Metropolitan Stock Exchange Limited. It is also registered as a Depository Participant with CDSL
and Portfolio Manager with SEBI. It also has registration with AMFI as a Mutual Fund Distributor. Angel Broking Private Limited is a
registered entity with SEBI for Research Analyst in terms of SEBI (Research Analyst) Regulations, 2014 vide registration number
INH000000164. Angel or its associates has not been debarred/ suspended by SEBI or any other regulatory authority for accessing
/dealing in securities Market. Angel or its associates/analyst has not received any compensation / managed or co-managed public
offering of securities of the company covered by Analyst during the past twelve months.
This document is solely for the personal information of the recipient, and must not be singularly used as the basis of any investment
decision. Nothing in this document should be construed as investment or financial advice. Each recipient of this document should
make such investigations as they deem necessary to arrive at an independent evaluation of an investment in the securities of the
companies referred to in this document (including the merits and risks involved), and should consult their own advisors to determine
the merits and risks of such an investment.
Reports based on technical and derivative analysis center on studying charts of a stock's price movement, outstanding positions and
trading volume, as opposed to focusing on a company's fundamentals and, as such, may not match with a report on a company's
fundamentals. Investors are advised to refer the Fundamental and Technical Research Reports available on our website to evaluate the
contrary view, if any.
The information in this document has been printed on the basis of publicly available information, internal data and other reliable
sources believed to be true, but we do not represent that it is accurate or complete and it should not be relied on as such, as this
document is for general guidance only. Angel Broking Pvt. Limited or any of its affiliates/ group companies shall not be in any way
responsible for any loss or damage that may arise to any person from any inadvertent error in the information contained in this report.
Angel Broking Pvt. Limited has not independently verified all the information contained within this document. Accordingly, we cannot
testify, nor make any representation or warranty, express or implied, to the accuracy, contents or data contained within this document.
While Angel Broking Pvt. Limited endeavors to update on a reasonable basis the information discussed in this material, there may be
regulatory, compliance, or other reasons that prevent us from doing so.
This document is being supplied to you solely for your information, and its contents, information or data may not be reproduced,
redistributed or passed on, directly or indirectly.
Neither Angel Broking Pvt. Limited, nor its directors, employees or affiliates shall be liable for any loss or damage that may arise from
or in connection with the use of this information.
August 5, 2016
24