2QFY2017 Result Update | Auto Ancillary
November 8, 2016
Amara Raja Batteries
BUY
CMP
`1,010
Performance Highlights
Target Price
`1,167
Y/E March (` cr)
3QFY16 3QFY15
% chg (yoy) 2QFY16
% chg (qoq)
Investment Period
12 Months
Net Sales
1,346
1,158
16.2
1,321
1.9
EBITDA
230
199
15.6
227
1.1
Stock Info
EBITDA Margin (%)
17.1
17.2
(8 bp)
17.2
(13 bp)
Sector
Auto Ancillary
Adj. PAT
136
123
11.2
131
4.3
Market Cap (` cr)
17,259
Source: Company, Angel Research
Net Debt (` cr)
(76)
Results ahead of estimates: Amara Raja Batteries (ARBL) reported 16.2% yoy
Beta
0.8
growth in its 2QFY2017 sales to `1,346cr. The company reported PAT of `136cr,
52 Week High / Low
1,077/773
yoy 11.2% growth. EBTIDA margins were at 17.1% vs. 17.2% in Q2FY2016.
Avg. Daily Volume
28,165
Margins contracted by 8bp yoy as raw material costs increased by 16.6% yoy. In
Face Value (`)
1
percent of sale terms, RM costs were at 64.3% vs. 64.0% in Q2FY2016. During
BSE Sensex
27,591
this period, lead prices have gone up by 9% yoy. In Q2FY2017, ARBL gained
Nifty
8,544
market share in the automotive battery segment, due to double digit growth in
Reuters Code
AMAR.BO
aftermarket brands, Amaron and PowerZone. During the quarter company also
Bloomberg Code
AMRJ@IN
saw higher sales of batteries to automobile OEMs. Capacity utilization improved
as exports have picked up. Company also reported a double digit growth in its
industrial battery business despite a challenging environment.
Shareholding Pattern (%)
Outlook and Valuation: We believe that ARBL is likely to continue gaining market
Promoters
52.1
share in the automotive battery segment. The strategy followed by automotive
MF / Banks / Indian Fls
7.8
OEMs of sourcing from multiple vendors as against having a single vendor is
FII / NRIs / OCBs
21.5
likely to benefit ARBL. Further, with the company’s strengthening distribution
Indian Public / Others
18.6
network in the Western and Eastern markets, we expect replacement sales to grow
in strong double digits, going forward. We also expect healthy growth in exports
as company is targeting ~10% of sales form exports from current ~6%. Overall,
Abs. (%)
3m 1yr
3yr
we expect ARBL to post a healthy top-line CAGR of 19% over FY2016 to FY2018E
Sensex
6.3
(2.3)
37.5
on the back of strong recovery in OEM market, brand strength and gain in
Amara Raja
11.6
14.2
221.6
market share. We also assume company to benefit from its ongoing capacity
expansion program. We expect ARBL to clock 20% earnings CAGR over the next
3-year price chart
two years. We maintain our positive view on the stock and reiterate our Buy rating
1200
on the stock with a target price of `1,167 (based on 28.5x FY2018E earnings).
1000
Key financials (Standalone)
800
Y/E March (` cr)
FY2015
FY2016
FY2017E
FY2018E
600
Net Sales
4,211
4,691
5,504
6,605
400
% chg
22.0
11.4
15.7
15.7
200
Net Profit
411
489
571
699
0
% chg
11.8
19.1
16.7
22.4
OPM (%)
16.7
17.4
17.6
17.5
EPS (`)
24.1
28.7
33.4
40.9
Source: Company, Angel Research
P/E (x)
42.0
35.3
30.2
24.7
P/BV (x)
10.2
8.2
6.7
5.4
RoE (%)
24.2
23.3
22.1
22.0
RoCE (%)
32.0
31.1
29.8
29.4
Amarjeet S Maurya
EV/Sales (x)
4.1
3.7
3.1
2.6
022-3935 7800 Ext: 6846
EV/EBITDA (x)
24.4
21.0
17.8
14.7
Source: Company, Angel Research; Note: CMP as of November 8, 2016
Please refer to important disclosures at the end of this report
1
Amara Raja Batteries | 2QFY2017 Result Update
Exhibit 1: Quarterly financial performance (Standalone)
Y/E March (` cr)
2QFY17
2QFY16
% chg (yoy) 1QFY17
% chg (qoq) 6MFY17 6MFY16
% chg (yoy)
Net Sales
1,346
1,158
16.2
1,321
1.9
2,666
2,289
16.5
Raw-material cost
865
742
16.6
875
(1.1)
1,739
1,476
17.9
(% of Sales)
64.3
64.0
66.2
519.2
491.5
Staff cost
69
58
19.6
66
5.7
135
114
18.5
(% of Sales)
5.2
5.0
5.0
40.3
37.9
Other Expenses
182
160
13.8
153
18.7
335
300
11.6
(% of Sales)
13.5
13.8
11.6
100.0
100.0
Total Expenditure
1,116
960
16.3
1,094
2.0
2,209
1,890
16.9
Operating Profit
230
199
15.6
227
1.1
457
399
14.6
OPM (%)
17.1
17.2
17.2
136.4
132.8
Interest
1
0
n.a.
1
6.4
2.89
1
118.9
Depreciation
46
34
33.2
44
3.7
90
67
33.7
Other Income
12
12
2.9
9
33.9
20.93
25
-16.9
PBT (excl. Extr. Items)
195
176
10.5
191
2.0
385
356
8.4
Extr. Income/(Expense)
0
PBT (incl. Extr. Items)
195
176
10.5
191
2.0
385
356
8.4
(% of Sales)
14.5
15.2
14.4
115.0
118.4
Provision for Taxation
58
53
8.9
60
(3.2)
118
111
6.9
(% of PBT)
29.9
30.4
31.5
44.3
45.2
Reported PAT
136
123
11.2
131
4.3
267
245
9.0
Adj PAT
136
123
11.2
131
4.3
267
245
9.0
Adj. PATM
10.1
10.6
9.9
79.7
81.6
Equity capital (cr)
17
17
17
17
17
Reported EPS (`)
7.98
7.18
11.2
7.65
4.3
15.6
14.3
9.0
Source: Company, Angel Research
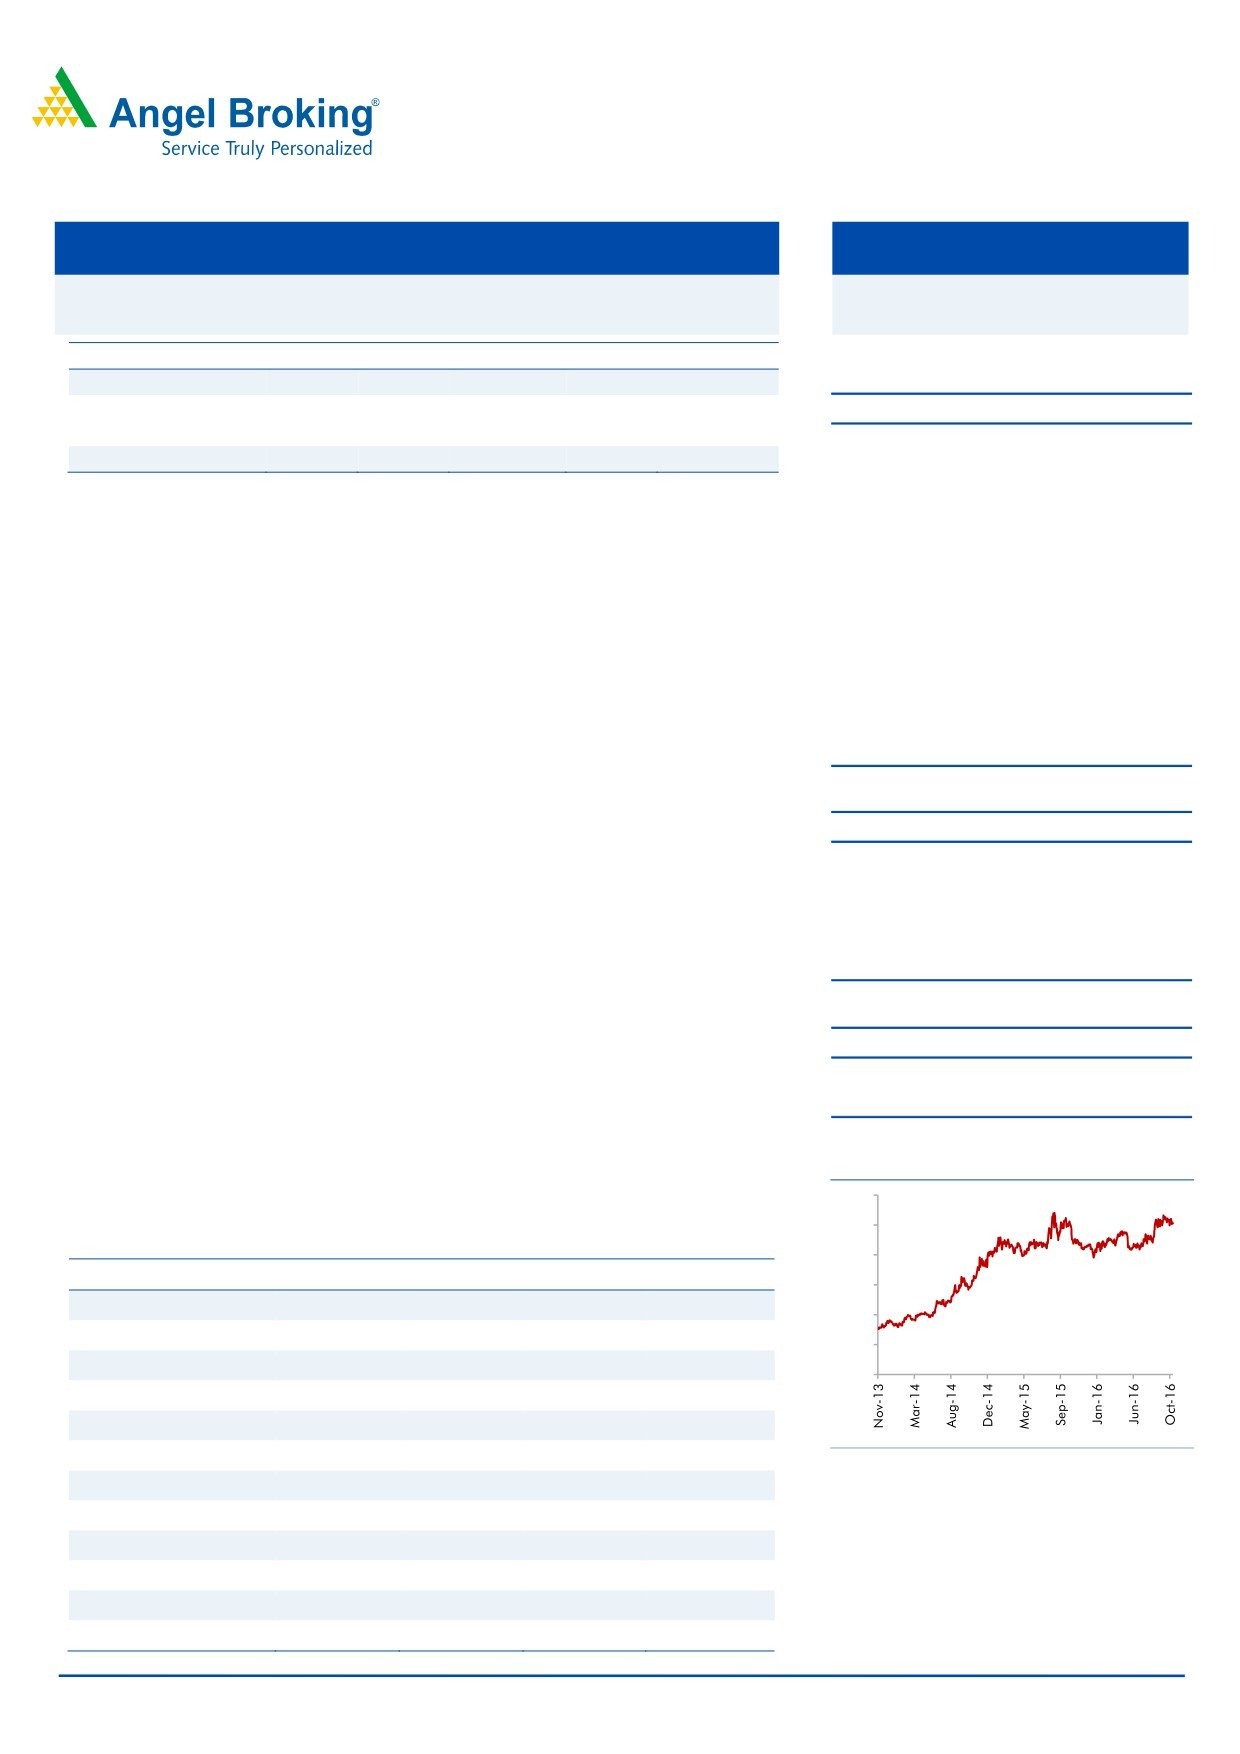
ARBL continues to gain market share: ARBL in the first quarter of FY2017 reported
a healthy 16.8% growth in its revenues and in Q2FY2017 the momentum has
continued. Its competitor Exide Industries in FY2017 so far has reported a yoy
growth of 11% which indicates that ARBL continues to gain market share. From the
results, it is also clear ARBL continues to maintain higher profitability compared to
its competitor. While ARBL reported EBITDA margin of 17.1% in Q2FY2017, Exide
Industries reported EBITDA margin of 15.2% in the same quarter. This superior
performance has on the back of competitive pricing, just in-time deliveries, custom
designed products and solutions and strong brand positioning.
November 8, 2016
2
Amara Raja Batteries | 2QFY2017 Result Update
Exhibit 2: Top-line is witnessing strong growth in FY2017
1,600
35
1,400
30
1,200
25
1,000
20
800
15
600
10
400
200
5
0
0
Net sales (` cr)
YoY growth (%)
Source: Company, Angel Research
Lead prices slowly firming up: In 2QFY2017, lead prices have moved up by 9%
yoy which led to increase in ARBL’s raw material costs. Its raw material costs
increased by 16.6% yoy vs. sales growth of 16.2% yoy which led to 22bp yoy
decline in gross margins to 35.7%.Currently the lead prices are at USD 2,070 per
MT, showing yoy rise of 23% indicating that the company may see rise in the raw
material prices in the next quarter.
Exhibit 3: Recent uptrend in lead prices
Exhibit 4: Flat EBITDA margin due to rising lead prices
2,500.0
250
20
2,300.0
200
15
150
2,100.0
10
100
5
1,900.0
50
0
0
1,700.0
1,500.0
EBITDA (` cr)
EBITDA margins (%)
Source: Company, Angel Research
Source: Company, Angel Research
November 8, 2016
3
Amara Raja Batteries | 2QFY2017 Result Update
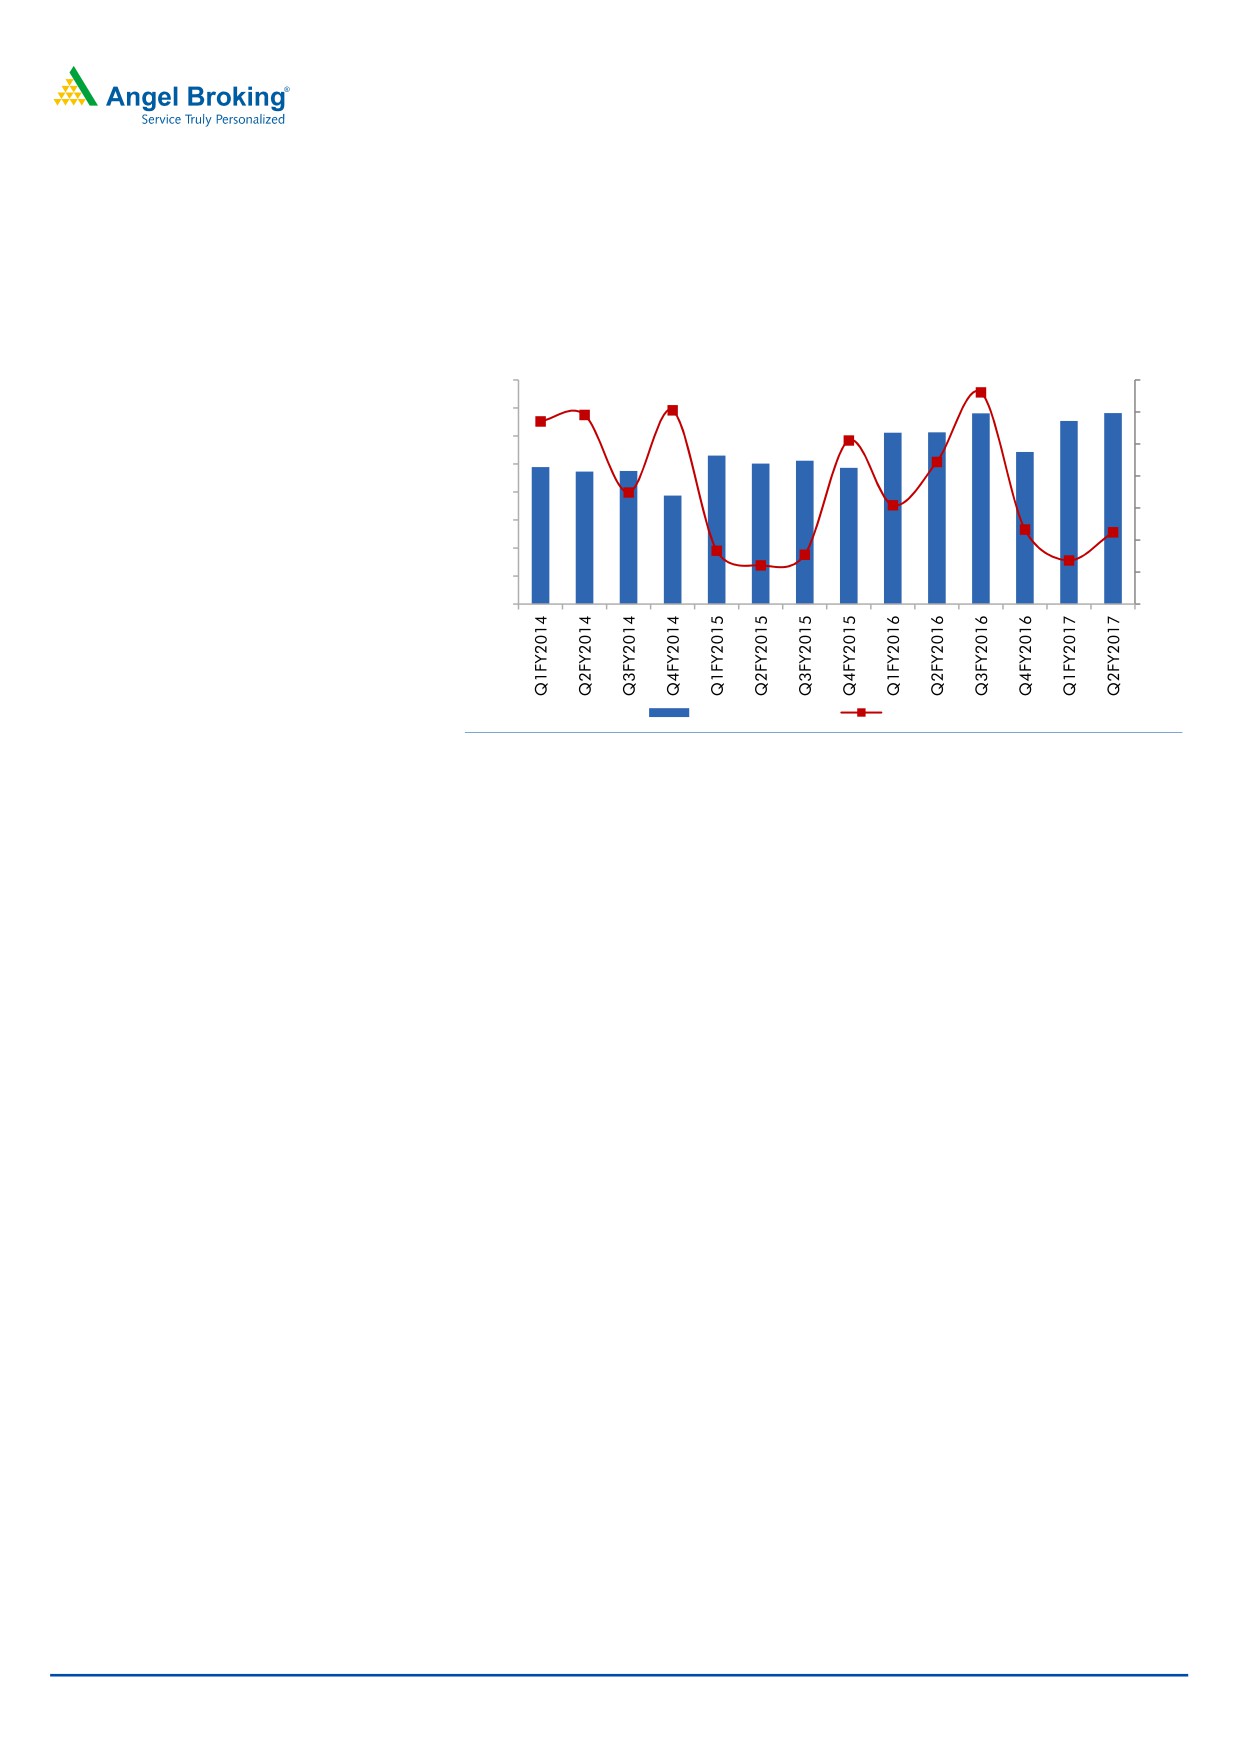
Net profit grows by yoy 11%: ARBL’s adjusted net profit for the quarter was at
`136cr, showing a yoy growth of 11.2%. Net margins however declined by
~100bp mainly due to the higher depreciation expenses on account its ongoing
capacity expansion plan, which rose by 33.2% yoy to `45.7cr.
Exhibit 5: Bottom-line growth impacted due to the high base in Q2FY16
160
35
140
30
120
25
100
20
80
15
60
10
40
20
5
0
0
Net profit (` cr)
YoY growth (%)
Source: Company, Angel Research
November 8, 2016
4
Amara Raja Batteries | 2QFY2017 Result Update
Investment arguments
Demand scenario for automotive and industrial batteries to remain positive in
the long run: We expect growth traction in the automotive battery segment to
continue over the next two years. The automotive OEM segment is likely to
witness strong growth over the next two years on the back of recovery in the
OEM sales, subdued fuel prices and further easing of interest rates. The high
margin automotive replacement demand is likely to maintain growth
momentum. Further, given the economic recovery, the industrial segment
(railways, UPS and telecom) is also poised to register double-digit growth over
the next two years.
Likely to outpace industry growth on increased sourcing by automotive OEM
segment: ARBL has outpaced the battery industry over the last four to five
years. Penetration into the new automotive OEM segment has led to market
share gains for ARBL. OEM customers both in the 4W and 2W segments have
strategically opted to source from ARBL in order to follow multiple sourcing
and reduce dependence on a single supplier. Also, by strengthening its
distribution reach in the Eastern and Western markets, ARBL is likely to gain
market share in the automotive replacement segment as well. We believe
ARBL would continue to gain market share in the near term and expect it to
post a top-line CAGR of 19% over FY2016-2018E.
Capacity expansion to address growing demand: To cater the growing
demand in automotive segment, ARBL has taken capacity expansion program
in 2W battery segment. This will be completed in the next four years taking its
capacity from current ~11mn units to ~25mn units per annum. ARBL has
already commissioned its Chittoor 2W battery capacity. On 4W battery front,
ARBL is expanding its capacity from 8.25mn units to 11mn units per year. The
tabular capacity has already been completed has started to contribute in
production. Overall company is in capacity expansion mode and
commissioning of new capacities will give a much required thrust for future
growth of the company.
Outlook and valuation
We believe that ARBL is likely to continue gaining market share in the automotive
battery segment. The strategy followed by automotive OEMs of sourcing from
multiple vendors as against having a single vendor is likely to benefit ARBL.
Further, with the company’s strengthening distribution network in the Western and
Eastern markets, we expect replacement sales to grow in strong double digits,
going forward. We also expect the Industrial segment growth to be in healthy
double digits over FY2017E-2018E, given that the telecom players are resorting to
aggressive network expansion, and also with ARBL entering tubular battery
manufacturing. We expect ARBL to record a healthy top-line CAGR of 19% over
FY2016 to FY2018E on the back of strong recovery in OEM market, brand
strength and gain in market share. We assume some impact of the increasing lead
prices on its raw material however we expect net profit growth to remain strong.
We expect ARBL to clock 20% earnings CAGR over the next two years. We
maintain our positive view on the stock and reiterate our Buy rating on the stock
with a target price of `1,167 (based on 28.5x FY2018E earnings).
November 8, 2016
5
Amara Raja Batteries | 2QFY2017 Result Update
Company background
Amara Raja Batteries Ltd (ARBL) is a leading automobile and industrial battery
manufacturer in India. It is the second largest lead acid battery manufacturer
having a market share of about ~35% in the organized battery industry. ARBL has
a technological tie-up with US based Johnson Controls, which also holds 26%
stake in it. The Automotive and Industrial battery segments each accounted for
~50% of the company's total revenue in FY2015.
November 8, 2016
6
Amara Raja Batteries | 2QFY2017 Result Update
Profit and loss statement (Standalone)
Y/E March (` cr)
FY13
FY14
FY15
FY16
FY17E
FY18E
Total operating income
2,979
3,452
4,211
4,691
5,504
6,605
% chg
25.5
15.9
22.0
11.4
17.3
20.0
Total Expenditure
2,517
2,880
3,510
3,874
4,537
5,447
Cost of Materials
1,991
2,283
2,776
2,964
3,513
4,241
Personnel
127
158
195
243
285
337
Others Expenses
399
439
538
666
739
869
EBITDA
461
572
702
817
967
1,159
% chg
29.0
23.9
22.8
16.4
18.4
19.8
(% of Net Sales)
15.5
16.6
16.7
17.4
17.6
17.5
Depreciation& Amortisation
66
65
134
140
175
200
EBIT
395
507
568
677
792
959
% chg
27.0
28.3
12.0
19.2
17.0
21.0
(% of Net Sales)
13.3
14.7
13.5
14.4
14.4
14.5
Interest & other Charges
0
1
0
0
5
4
Other Income
27
30
42
46
45
56
(% of PBT)
6.4
5.7
6.9
6.3
5.4
5.6
Share in profit of Ass.
-
-
-
-
-
-
Recurring PBT
422
537
610
722
833
1,011
% chg
32.4
27.2
13.6
18.4
15.3
21.4
Prior Period & Extra. Exp.
-
-
-
-
-
-
PBT (reported)
422
537
610
722
833
1,011
Tax
135
169
199
233
261
311
(% of PBT)
32.0
31.5
32.6
32.2
31.4
30.8
PAT (reported)
287
367
411
489
571
699
Add: Share of earnings of ass.
-
-
-
-
-
-
Less: Minority interest (MI)
-
-
-
-
-
-
PAT after MI (reported)
287
367
411
489
571
699
ADJ. PAT
287
367
411
489
571
699
% chg
32.4
28.2
11.8
19.1
16.7
22.4
(% of Net Sales)
9.6
10.6
9.8
10.4
10.4
10.6
Basic EPS (`)
16.8
21.5
24.1
28.7
33.4
40.9
Fully Diluted EPS (`)
16.8
21.5
24.1
28.7
33.4
40.9
% chg
32.4
28.2
11.8
19.1
16.7
22.4
November 8, 2016
7
Amara Raja Batteries | 2QFY2017 Result Update
Balance sheet statement (Standalone)
Y/E March (` cr)
FY13
FY14
FY15
FY16
FY17E
FY18E
SOURCES OF FUNDS
Equity Share Capital
17
17
17
17
17
17
Reserves& Surplus
1,043
1,346
1,683
2,085
2,570
3,164
Shareholders’ Funds
1,060
1,363
1,700
2,102
2,587
3,181
Minority Interest
-
-
-
-
-
-
Total Loans
88
86
76
74
75
75
Deferred Tax Liability
24
34
42
65
65
65
Total Liabilities
1,172
1,482
1,817
2,241
2,727
3,321
APPLICATION OF FUNDS
Gross Block
680
996
1,441
1,915
2,415
2,865
Less: Acc. Depreciation
314
365
497
598
773
973
Net Block
366
631
944
1,316
1,641
1,891
Capital Work-in-Progress
103
145
86
120
120
120
Investments
16
16
16
16
16
16
Current Assets
1,285
1,192
1,340
1,456
1,641
2,085
Inventories
293
335
418
602
709
851
Sundry Debtors
381
453
554
592
679
814
Cash
411
295
222
150
127
268
Loans & Advances
173
60
75
64
72
86
Other Assets
28
49
70
48
55
66
Current liabilities
603
505
574
674
697
797
Net Current Assets
682
687
766
782
944
1,288
Deferred Tax Asset
5
4
5
6
6
6
Mis. Exp. not written off
-
-
-
-
-
-
Total Assets
1,172
1,482
1,817
2,241
2,727
3,321
November 8, 2016
8
Amara Raja Batteries | 2QFY2017 Result Update
Cash flow statement (Standalone)
Y/E March (` cr)
FY13
FY14
FY15
FY16
FY17E FY18E
Profit before tax
422
537
610
722
833
1,011
Depreciation
59
65
134
140
175
200
Change in Working Capital
(9)
(132)
(145)
(68)
(185)
(203)
Interest / Dividend (Net)
(26)
(28)
(17)
(9)
5
4
Direct taxes paid
(137)
(160)
(192)
(218)
(261)
(311)
Others
27
(3)
5
(12)
-
-
Cash Flow from Operations
335
279
395
555
566
700
(Inc.)/ Dec. in Fixed Assets
(119)
(342)
(294)
(387)
(500)
(450)
(Inc.)/ Dec. in Investments
-
-
-
-
-
-
Cash Flow from Investing
(119)
(342)
(294)
(387)
(500)
(450)
Issue of Equity
-
-
-
-
-
-
Inc./(Dec.) in loans
-
(1)
-
-
1
-
Dividend Paid (Incl. Tax)
(32)
(43)
(65)
(161)
(86)
(105)
Interest / Dividend (Net)
(1)
(7)
138
70
(5)
(4)
Cash Flow from Financing
(34)
(51)
73
(92)
(90)
(109)
Inc./(Dec.) in Cash
182
(115)
174
76
(24)
141
Opening Cash balances
228
409
48
75
150
127
Closing Cash balances
411
295
222
150
127
268
November 8, 2016
9
Amara Raja Batteries | 2QFY2017 Result Update
Key ratios
Y/E March
FY13
FY14
FY15
FY16
FY17E FY18E
Valuation Ratio (x)
P/E (on FDEPS)
60.2
47.0
42.0
35.3
30.2
24.7
P/CEPS
65.6
48.9
39.9
31.7
27.4
23.1
P/BV
16.3
12.7
10.2
8.2
6.7
5.4
Dividend yield (%)
0.2
0.2
0.3
0.4
0.4
0.5
EV/Sales
5.7
4.9
4.1
3.7
3.1
2.6
EV/EBITDA
36.7
29.8
24.4
21.0
17.8
14.7
EV / Total Assets
9.5
8.6
7.2
5.9
5.0
4.1
Per Share Data (`)
EPS (Basic)
16.8
21.5
24.1
28.7
33.4
40.9
EPS (fully diluted)
16.8
21.5
24.1
28.7
33.4
40.9
Cash EPS
15.4
20.7
25.3
31.9
36.8
43.7
DPS
1.9
2.5
3.2
3.6
4.3
5.0
Book Value
62.1
79.8
99.5
123.0
151.5
186.3
Returns (%)
ROCE
34.4
35.0
32.0
31.1
29.8
29.4
Angel ROIC (Pre-tax)
54.8
44.6
36.9
33.7
31.5
32.2
ROE
27.1
27.0
24.2
23.3
22.1
22.0
Turnover ratios (x)
Asset Turnover (Gross Block)
4.4
3.5
2.9
2.4
2.3
2.3
Inventory / Sales (days)
36
35
36
47
47
47
Receivables (days)
47
48
48
46
45
45
Payables (days)
19
15
24
29
28
27
WC cycle (ex-cash) (days)
63
68
60
64
64
65
November 8, 2016
10
Amara Raja Batteries | 2QFY2017 Result Update
Research Team Tel: 022 - 39357800
DISCLAIMER
Angel Broking Private Limited (hereinafter referred to as “Angel”) is a registered Member of National Stock Exchange of India Limited,
Bombay Stock Exchange Limited and Metropolitan Stock Exchange Limited. It is also registered as a Depository Participant with CDSL
and Portfolio Manager with SEBI. It also has registration with AMFI as a Mutual Fund Distributor. Angel Broking Private Limited is a
registered entity with SEBI for Research Analyst in terms of SEBI (Research Analyst) Regulations, 2014 vide registration number
INH000000164. Angel or its associates has not been debarred/ suspended by SEBI or any other regulatory authority for accessing
/dealing in securities Market. Angel or its associates/analyst has not received any compensation / managed or co-managed public
offering of securities of the company covered by Analyst during the past twelve months.
This document is solely for the personal information of the recipient, and must not be singularly used as the basis of any investment
decision. Nothing in this document should be construed as investment or financial advice. Each recipient of this document should
make such investigations as they deem necessary to arrive at an independent evaluation of an investment in the securities of the
companies referred to in this document (including the merits and risks involved), and should consult their own advisors to determine
the merits and risks of such an investment.
Reports based on technical and derivative analysis center on studying charts of a stock's price movement, outstanding positions and
trading volume, as opposed to focusing on a company's fundamentals and, as such, may not match with a report on a company's
fundamentals. Investors are advised to refer the Fundamental and Technical Research Reports available on our website to evaluate the
contrary view, if any.
The information in this document has been printed on the basis of publicly available information, internal data and other reliable
sources believed to be true, but we do not represent that it is accurate or complete and it should not be relied on as such, as this
document is for general guidance only. Angel Broking Pvt. Limited or any of its affiliates/ group companies shall not be in any way
responsible for any loss or damage that may arise to any person from any inadvertent error in the information contained in this report.
Angel Broking Pvt. Limited has not independently verified all the information contained within this document. Accordingly, we cannot
testify, nor make any representation or warranty, express or implied, to the accuracy, contents or data contained within this document.
While Angel Broking Pvt. Limited endeavors to update on a reasonable basis the information discussed in this material, there may be
regulatory, compliance, or other reasons that prevent us from doing so.
This document is being supplied to you solely for your information, and its contents, information or data may not be reproduced,
redistributed or passed on, directly or indirectly.
Neither Angel Broking Pvt. Limited, nor its directors, employees or affiliates shall be liable for any loss or damage that may arise from
or in connection with the use of this information.
Disclosure of Interest Statement
Amara Raja Batteries
1. Financial interest of research analyst or Angel or his Associate or his relative
No
2. Ownership of 1% or more of the stock by research analyst or Angel or associates or relatives
No
3. Served as an officer, director or employee of the company covered under Research
No
4. Broking relationship with company covered under Research
No
Ratings (Based on expected returns
Buy (> 15%)
Accumulate (5% to 15%)
Neutral (-5 to 5%)
over 12 months investment period):
Reduce (-5% to -15%)
Sell (< -15)
November 8, 2016
11