2QFY2016 Result Update | Auto Ancillary
November 5, 2015
Amara Raja Batteries
BUY
CMP
`881
Performance Highlights
Target Price
`1,039
Y/E March (` cr)
2QFY16 2QFY15
% chg (yoy) 1QFY16
% chg (qoq)
Investment Period
12 Months
Net Sales
1,158
1,060
9.2
1,138
1.8
EBITDA
199
180
10.4
199
(0.1)
Stock Info
EBITDA Margin (%)
17.2
17.0
20 bp
17.5
(30 bp)
Sector
Auto Ancillary
Adj. PAT
123
100
22.2
122
0.4
Source: Company, Angel Research
Market Cap (` cr)
15,055
Net Debt (` cr)
(148)
Amara Raja Batteries (ARBL)’s 2QFY2016 results have come in line with
estimates. The top-line continued to grow in double digits, but the growth was
Beta
0.8
slightly moderated given the decrease in realization. Realization declined on
52 Week High / Low
1,132/643
account of passing of lower lead prices to consumers and due to slowdown in the
Avg. Daily Volume
46,950
UPS segment. Still, ARBL managed to keep its margins above the 17% mark. The
Face Value (`)
1
net profit grew in robust double-digits, and came in line with estimates.
BSE Sensex
26,304
Top-line maintains double-digit growth: ARBL’s revenues grew a healthy 9% yoy
Nifty
7,955
to `1,158cr on back of a robust 21% yoy growth in the automotive segment. The
Reuters Code
AMAR.BO
industrial segment was a bit subdued, growing by 5% yoy, due to slowdown in the
Bloomberg Code
AMRJ@IN
UPS segment.
Margin improvement and lower depreciation boosts profitability: For the quarter,
Shareholding Pattern (%)
ARBL’s net profit grew a robust 22% yoy to `122.6cr. Margin improvement due to
Promoters
52.1
soft lead prices coupled with lower depreciation expenses boosted the profits.
MF / Banks / Indian Fls
11.3
Outlook and Valuation: ARBL is likely to continue gaining market share in the
FII / NRIs / OCBs
24.9
automotive battery segment. The strategy followed by automotive OEMs of
Indian Public / Others
11.7
sourcing from multiple vendors as against having a single vendor is likely to
benefit ARBL. Further, given the strengthening distribution network in the Western
and Eastern markets, replacement sales are also expected grow in strong double
Abs. (%)
3m 1yr
3yr
digits, going forward. We also expect the industrial segment to recover from
Sensex
(6.8)
(5.8)
40.2
2HFY2016, given the network expansion by telecom players and with ARBL
Amara Raja
(9.9)
35.7
294.3
entering into tubular battery manufacturing. We expect ARBL to record a healthy
top-line CAGR of 19% over FY2015 to FY2017. Also, given the softness in lead
prices, margins are expected to remain at elevated levels. We expect ARBL to
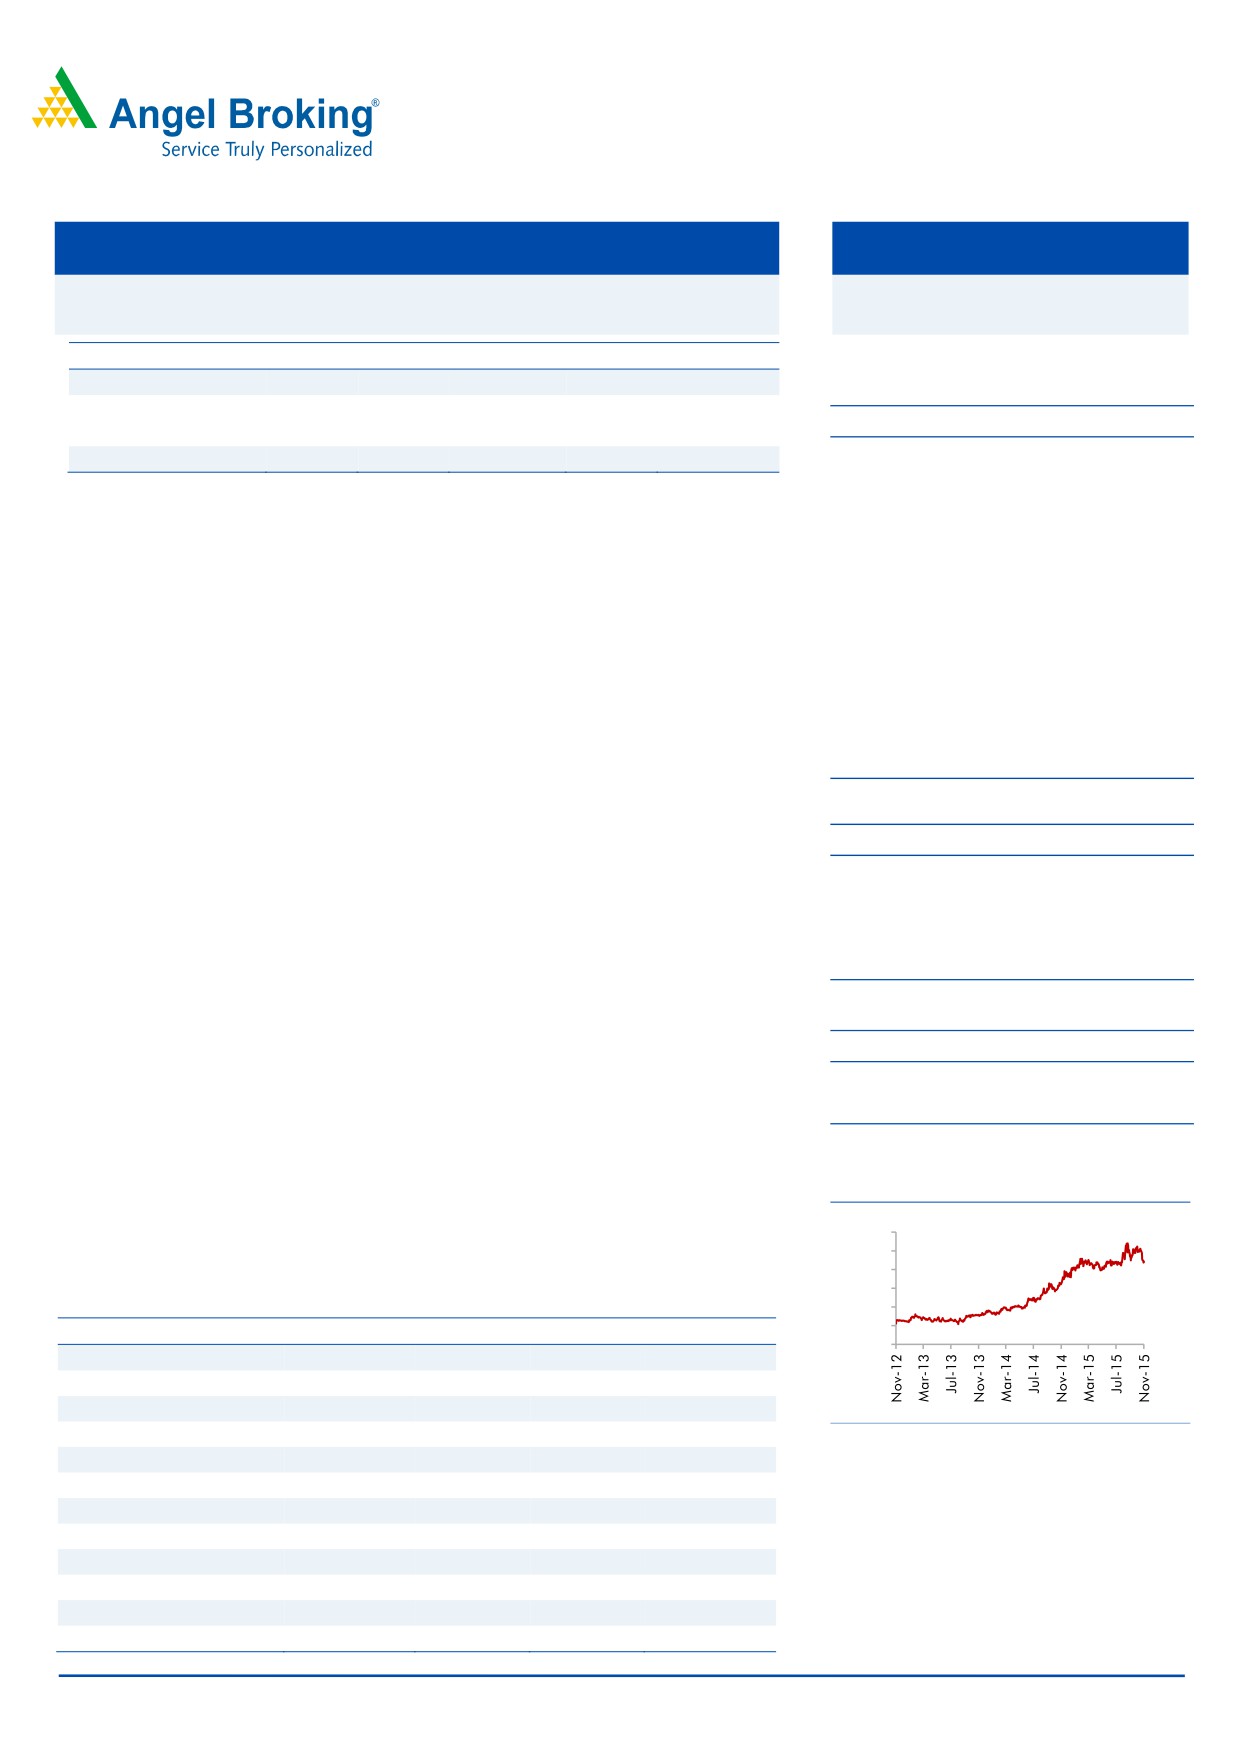
3-year price chart
clock 27% earnings CAGR over the next two years. Hence, we have a positive
1,200
view on the stock and maintain our Buy rating with a target price of `1,039
1,000
(based on 28x FY2017 earnings).
800
600
Key financials (Standalone)
400
200
Y/E March (` cr)
FY2014
FY2015
FY2016E
FY2017E
0
Net Sales
3,452
4,230
4,892
5,871
% chg
16.7
22.5
15.7
20.0
Net Profit
371
418
493
634
% chg
25.5
12.6
17.8
28.8
Source: Company, Angel Research
EBITDA (%)
16.7
17.2
17.4
17.6
EPS (`)
21.7
24.5
28.8
37.1
P/E (x)
40.5
36.0
30.6
23.7
P/BV (x)
11.0
8.9
7.1
5.7
RoE (%)
27.2
24.6
23.4
24.1
RoCE (%)
36.6
34.1
33.0
38.0
Bharat Gianani
EV/Sales (x)
4.3
3.5
3.1
2.5
022-3935 7800 Ext: 6817
EV/EBITDA (x)
25.8
20.5
17.5
14.2
Source: Company, Angel Research
Please refer to important disclosures at the end of this report
1
Amara Raja Batteries | 2QFY2016 Result Update
Exhibit 1: Quarterly financial performance (Standalone)
Y/E March (` cr)
2QFY16
2QFY15
% chg (yoy)
1QFY16
% chg (qoq)
1HFY16
1HFY15
% chg (yoy)
Net Sales
1,158
1,060
9.2
1,138
1.8
2,296
2,089
9.9
Consumption of RM
742
703
5.6
735
0.9
1,477
1,390
6.3
(% of Sales)
64.0
66.3
64.6
64.3
66.5
Staff Costs
58
48
20.8
56
3.7
114
95
19.8
(% of Sales)
5.0
4.5
4.9
5.0
4.5
Other Expenses
160
129
23.4
148
8.3
307
248
23.7
(% of Sales)
13.8
12.2
13.0
13.4
11.9
Total Expenditure
960
880
9.0
939
2.2
1,898
1,734
9.5
Operating Profit
199
180
10.4
199
(0.1)
397
356
11.8
OPM (%)
17.2
17.0
17.5
17.3
17.0
Interest
0
0
-
0
(33.3)
0
0
66.7
Depreciation
34
37
(6.4)
33
4.4
67
68
(0.7)
Other Income
12
11
6.4
13
(10.5)
25
17
46.5
PBT (incl. Extr. Items)
176
154
14.1
179
(1.6)
355
305
16.5
(% of Sales)
15.2
14.5
15.7
15.5
14.6
Provision for Taxation
53
54
(0.9)
57
(5.9)
110
98
12.0
(% of PBT)
30.4
35.0
31.8
31.1
32.3
Exceptional items
-
-
-
-
-
Reported PAT
123
100
22.2
122
0.4
245
206
18.6
Adj PAT
123
100
22.2
122
0.4
245
206
18.6
Adj. PATM
10.6
9.5
10.7
10.7
9.9
Equity capital (cr)
17.1
17.1
17.1
17.1
17.1
Reported EPS (`)
7.2
5.9
22.2
7.1
0.4
14.3
12.1
18.6
Source: Company, Angel Research
Top-line grows in double digits: ARBL revenues maintained healthy double digit
growth momentum, reporting a 9% yoy growth in 2QFY2016. ARBL continued to
gain market share in the automotive segment (constituting 55% of the topline),
registering a growth of about 21%. The automotive OEM segment reported growth
of 17% whereas the automotive replacement segment grew strongly 23%. The
industrial segment (contributing 45% of revenues) growth was relatively subdued
(reported 5% growth) owing to slowdown in the UPS segment. The revenues were
dragged by the pass thru of lower lead prices (lead prices have dipped by about
7% yoy) in both the automotive OEM and the industrial segment.
November 5, 2015
2
Amara Raja Batteries | 2QFY2016 Result Update
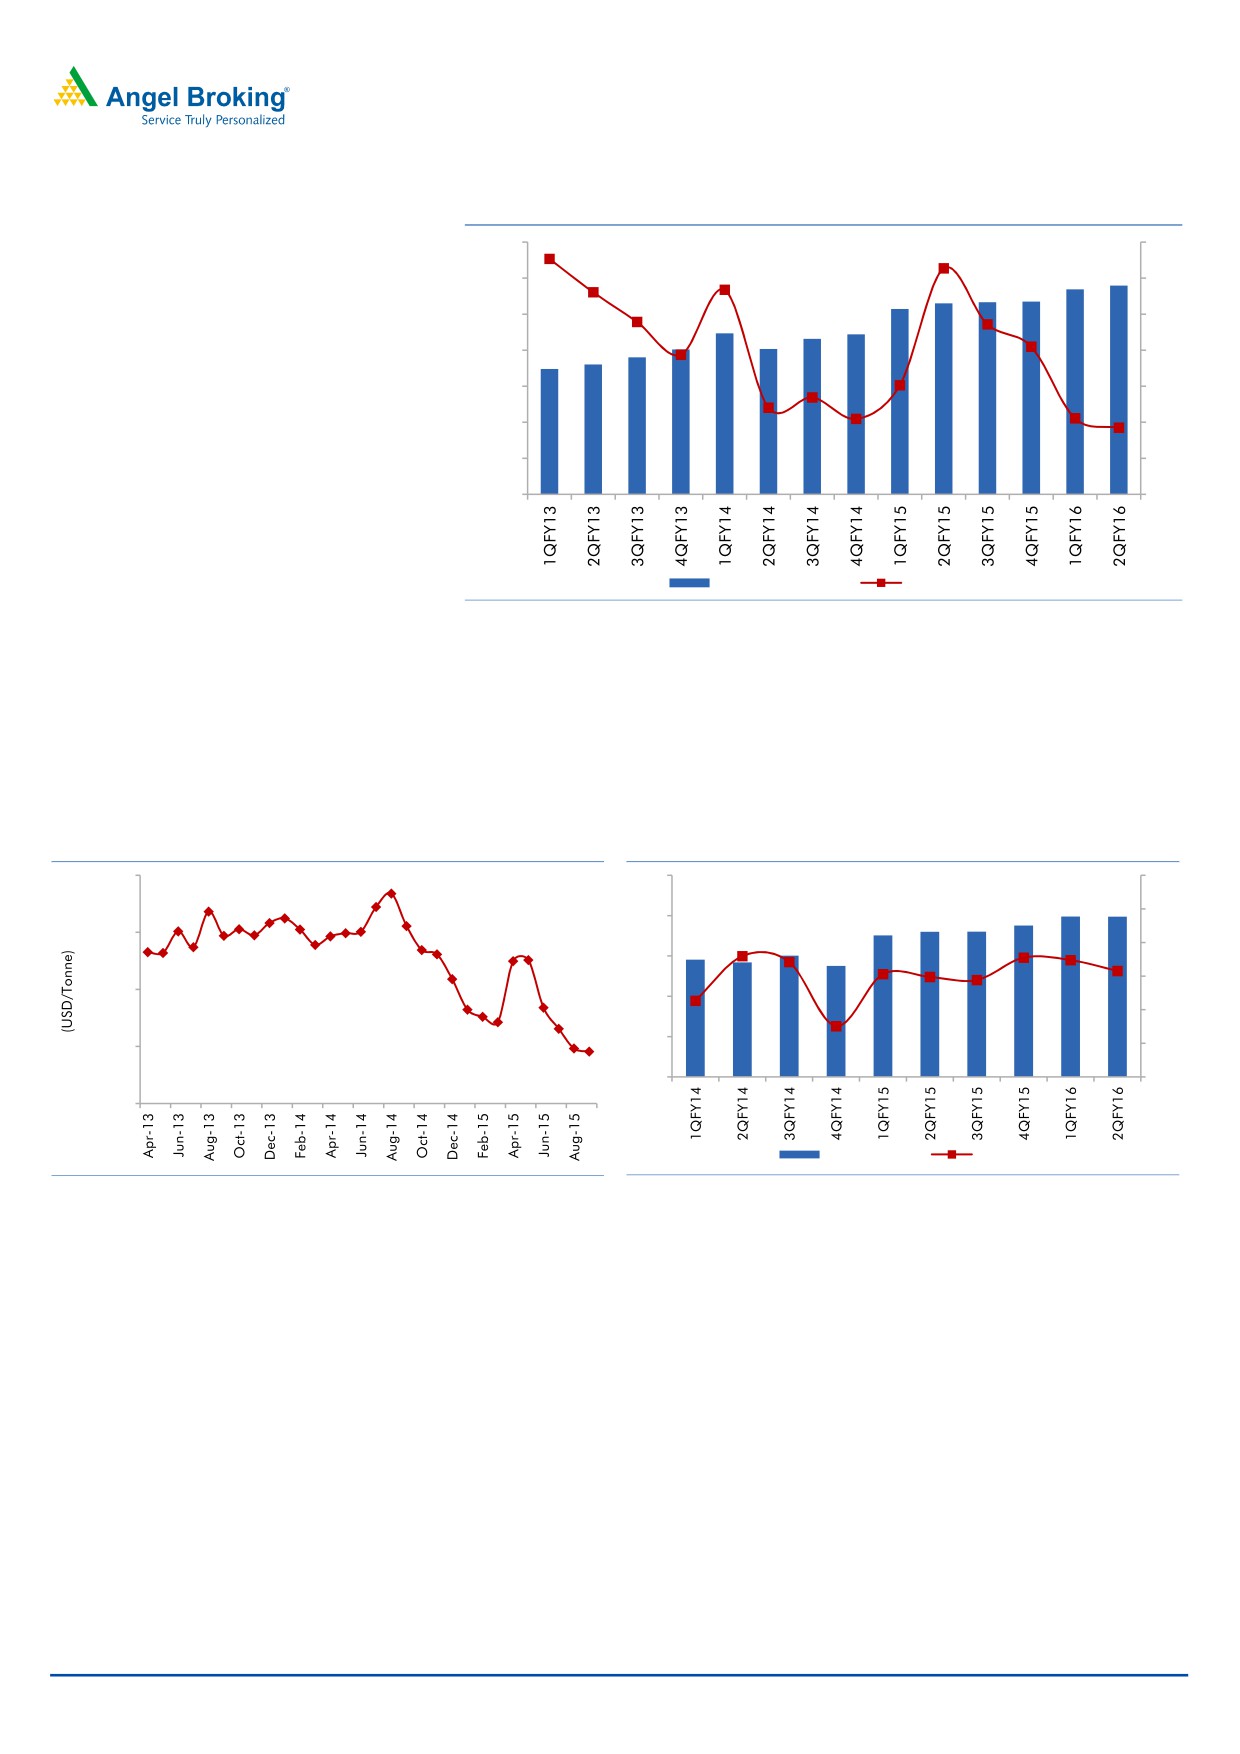
Exhibit 2: Double digit top-line growth continues
1,400
35
1,200
30
1,000
25
800
20
600
15
400
10
200
5
0
0
Net sales (` cr)
% yoy growth
Source: Company, Angel Research
Soft lead prices boost operating performance: ARBL continued to maintain margins
upward of the 17% mark. The margin for the quarter, at 17.2%, improved
marginally
20bp yoy. Raw material cost as a percentage of sales dipped
230bp yoy to 64%, given the softness in the price of lead, which is its key
raw material.
Exhibit 3: Average lead price trend
Exhibit 4: Soft lead prices boost EBITDA margin
2,300
250
20
19
200
2,100
18
150
17
1,900
100
16
50
1,700
15
0
14
1,500
EBIDTA (` cr)
Margin (%)
Source: Company, Angel Research
Source: Company, Angel Research
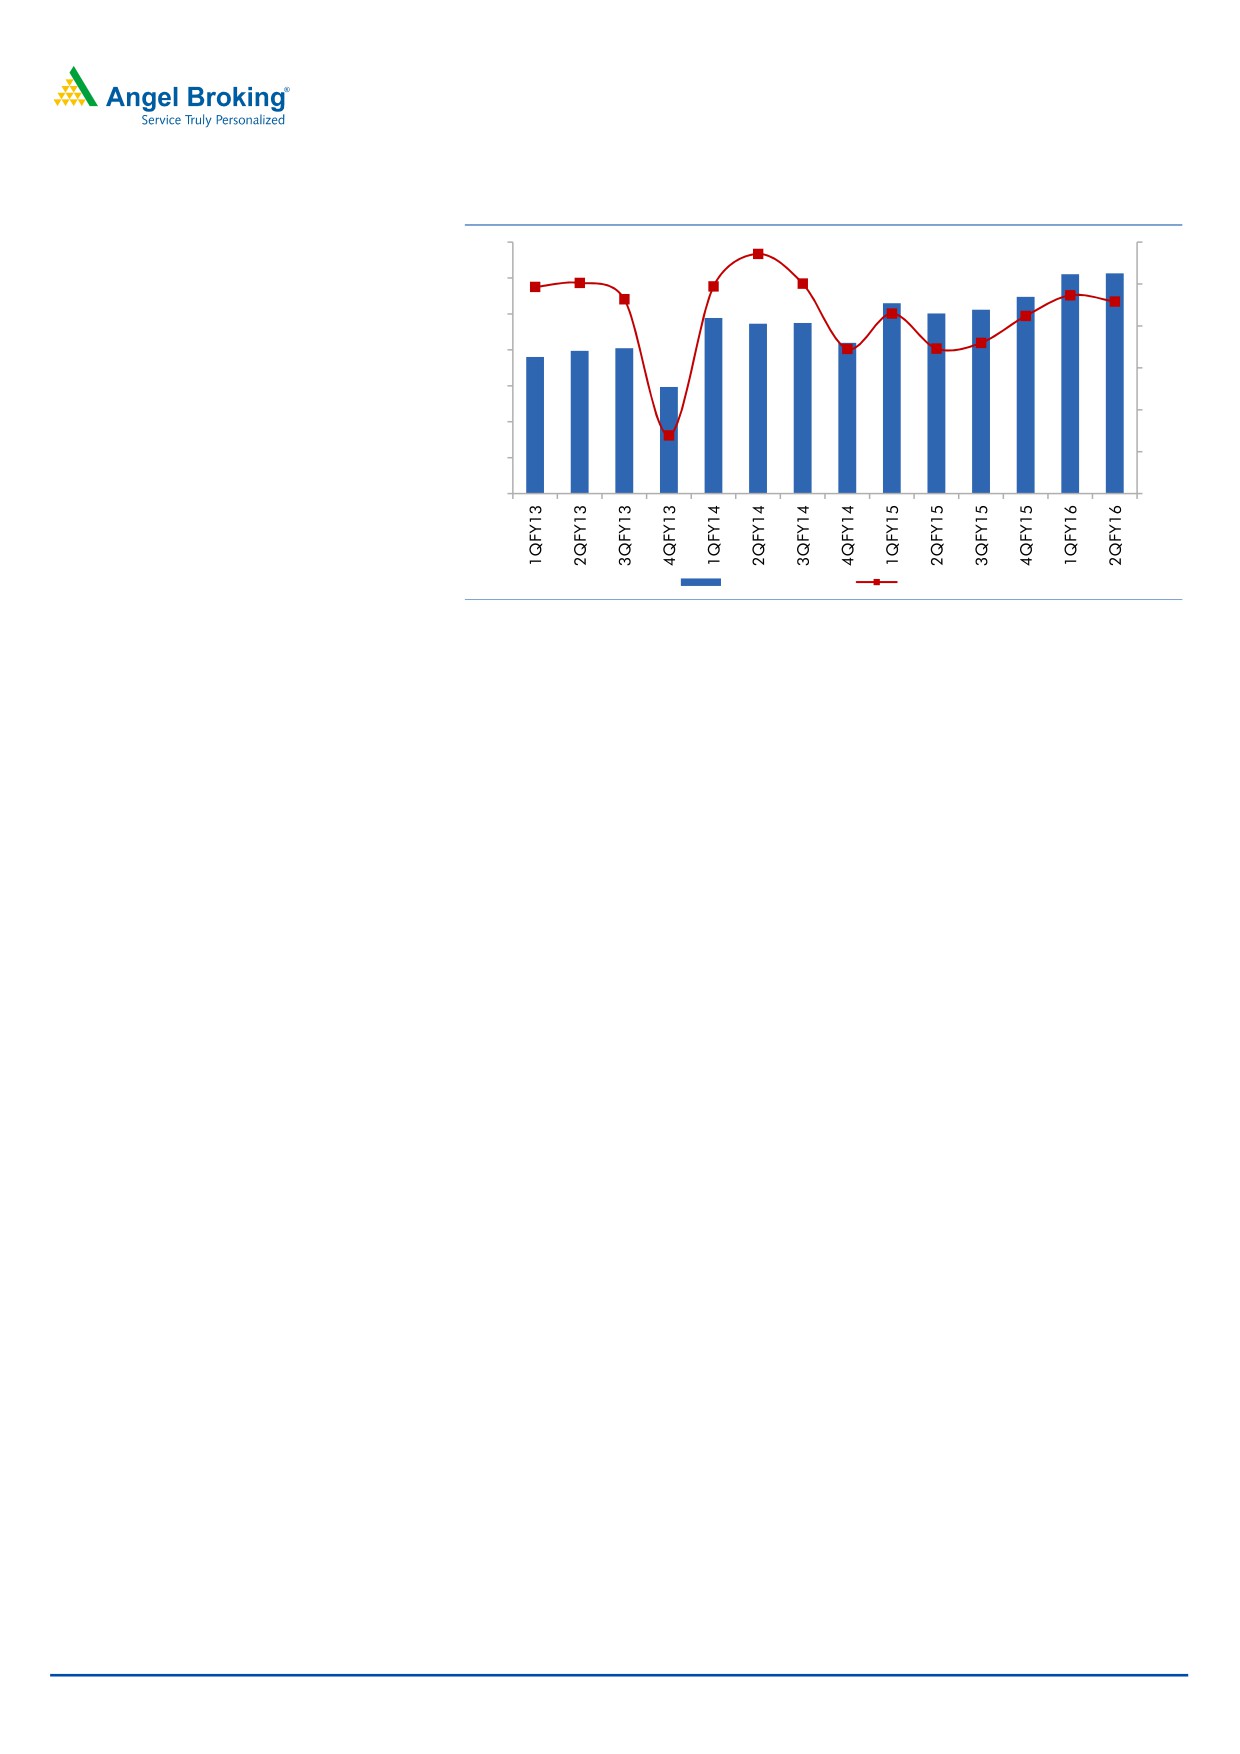
Net profit grows strongly on back of healthy top-line growth and margin
improvement: ARBL’s adjusted net profit for the quarter grew strongly by 22% yoy
to `123cr, tracking robust operating performance.
November 5, 2015
3
Amara Raja Batteries | 2QFY2016 Result Update
Exhibit 5: Strong bottom-line growth
140
12
120
11
100
10
80
9
60
8
40
7
20
0
6
Net Profit (` cr)
Margin (%)
Source: Company, Angel Research
November 5, 2015
4
Amara Raja Batteries | 2QFY2016 Result Update
Conference call - Key highlights
ARBL continues to outpace the automotive battery segment growth, on the
back of market share gains. During 1HFY2016, ARBL’s automotive
replacement segment, which constitutes about 36% of its revenues, grew by a
healthy 21% yoy. ARBL outpaced the auto replacement industry growth of 11-
12% yoy. ARBL’s current market share in the auto replacement segment stands
at about 25%.
ARBL outgrew the automotive OEM industry as well. In the 4W OEM segment
(which forms 15% of its top-line), ARBL grew 17% yoy as against industry
growth of 6-7% yoy. Similarly in the 2W OEM segment (which constitutes
about 4% of its topline), ARBL’s revenue grew 15% yoy as against a flat
industry.
ARBL expects the outperformance in the automotive segment (which forms
about 56% of the revenues) to continue given the increased sourcing by OEMs
and continued market share gains in the automotive replacement space given
the strengthening of its distribution network particularly in the Eastern and the
Western markets where it has a relatively lesser presence.
ARBL expects demand in the industrial segment (which forms about 44% of the
top-line) to pick up in 2HFY2016. Increased data usage and the need to
improvise on the call quality has led to tower additions by telecom players
(telecom forms about 22% of the top-line) which would boost demand, going
forward. Further, ARBL expects the UPS segment (which forms 15% of the top-
line) and other industrial segments to recover from 2HFY2016, which would
augment the industrial revenues.
In order to meet increased demand in both the automotive and the industrial
space, ARBL is expanding capacities. In the automotive 4W segment, ARBL has
current capacity of 8.25mn units with capacity utilization of 85%. ARBL can
enhance the 4W capacity by 6mn units by introducing new manufacturing
lines within the current location. In the automotive 2W segment, ARBL has
current capacity of 8.4mn units with the utilization level at 90%. ARBL is in the
process of expanding its 2W capacity to 11mn units by FY2016-end.
Similarly in the industrial segment, ARBL is enhancing large VRLA capacity
(suitable for making telecom batteries) by 20% to 1.4bn Ah which would come
on stream by FY2016-end. The capacity utilization in LVRLA stands at 97%. In
MVRLA (suitable for UPS), the company has capacity of 850mn Ah and the
capacity utilization currently stands at 80%.
In order to effectively tap the home inverter segment, ARBL is setting up a
tubular battery manufacturing plant with a capacity of 1.4mn units. ARBL is
investing `500cr in the plant and expects a revenue potential of `1,000cr at
full utilization. The first phase with capacity of 0.9mn units would commence in
December 2015 with the balance coming in by December 2016. ARBL
currently sells home inverters through the trading route and the current run
rate is of 0.35mn units.
ARBL has guided for overall capex of `900cr over the next two years.
November 5, 2015
5
Amara Raja Batteries | 2QFY2016 Result Update
As per ARBL, changes in lead prices are a pass thru to 60% of the customer
base (automotive OEM and the entire industrial segment). ARBL takes a call on
pricing in the automotive replacement market depending on the competitive
scenario. Currently, ARBL has not taken any pricing action in the replacement
space and is enjoying the benefits of lower lead prices.
November 5, 2015
6
Amara Raja Batteries | 2QFY2016 Result Update
Investment arguments
Demand scenario for automotive and industrial batteries to remain positive in
the long run: We expect growth traction in the automotive battery segment to
continue over the next two years. The automotive OEM segment has witnessed
volume recovery in FY2015 post improvement in consumer sentiments.
Further, robust automotive replacement demand is likely to maintain growth
momentum. Also, given the economic recovery, the industrial segment
(railways, UPS and telecom) is also poised to register double-digit growth over
the next two years.
Likely to outpace industry growth on increased sourcing from automotive OEM
segment: ARBL has outpaced the battery industry over the last four to five
years. Penetration into the new automotive OEM segment has led to market
share gains for ARBL. OEM customers both in the 4W and 2W segments have
strategically opted to source from ARBL in order to have multiple sourcing and
reduce dependence on a single supplier. Also, by strengthening its distribution
reach in the Eastern and Western markets, ARBL is likely to gain market share
in the automotive replacement segment as well. We believe ARBL would
continue to gain market share in the near term and expect it to post a top-line
CAGR of 21% over FY2015-2017.
Outlook and valuation
ARBL is likely to continue gaining market share in the automotive battery segment.
The strategy followed by automotive OEMs of sourcing from multiple vendors as
against having a single vendor is likely to benefit ARBL. Further, given the
strengthening distribution network in the Western and Eastern markets,
replacement sales are also expected grow in strong double digits, going forward.
We also expect the industrial segment to recover from 2HFY2016, given the
network expansion by telecom players and with ARBL entering into tubular battery
manufacturing. We expect ARBL to record a healthy top-line CAGR of 19% over
FY2015 to FY2017. Also, given the softness in lead prices, margins are expected
to remain at elevated levels. We expect ARBL to clock 27% earnings CAGR over the
next two years. Hence, we have a positive view on the stock and maintain our Buy
rating with target price of `1,039 (based on 28x FY2017 earnings).
Company background
Amara Raja Batteries Ltd (ARBL) is a leading automobile and industrial battery
manufacturer in India. It is the second largest lead acid battery manufacturer
having a market share of about 35% in the organized battery industry. ARBL has a
technological tie up with US based Johnson Controls, which also holds 26% stake
in it. The automotive and industrial battery segments each accounted for 50% of
the company's total revenue in FY2015.
November 5, 2015
7
Amara Raja Batteries | 2QFY2016 Result Update
Profit and loss statement (Standalone)
Y/E March (` cr)
FY2012
FY2013
FY2014
FY2015
FY2016E
FY2017E
Total operating income
2,375
2,959
3,452
4,230
4,892
5,871
% chg
34.4
24.6
16.7
22.5
15.7
20.0
Total expenditure
2,017
2,508
2,876
3,502
4,039
4,840
Net raw material costs
1,598
1,991
2,283
2,776
3,195
3,851
Employee expenses
100
126
158
195
234
274
Other expenses
319
390
435
531
611
715
EBITDA
357
451
575
728
853
1,031
% chg
38.4
26.1
27.6
26.5
17.2
20.9
(% of total op. income)
15.1
15.2
16.7
17.2
17.4
17.6
Depreciation & amort.
46
66
65
134
178
204
EBIT
323
431
541
617
725
920
% chg
45.4
33.7
25.5
14.1
17.5
26.9
(% of total op. income)
13.6
14.6
15.7
14.6
14.8
15.7
Interest and other charges
4
0
1
0
1
1
Other income
12
47
30
24
50
93
Recurring PBT
319
431
541
617
724
919
% chg
44.5
35.3
25.4
14.2
17.4
26.9
Extraordinary items
-
(9)
(4)
(7)
PBT (reported)
319
422
537
610
724
919
Tax
104
135
169
199
232
285
(% of PBT)
32.5
31.4
31.3
32.2
32.0
31.0
PAT (reported)
215
287
367
411
493
634
ADJ. PAT
215
296
371
418
493
634
% chg
45.7
37.6
25.5
12.6
17.8
28.8
(% of total op. income)
9.1
10.0
10.8
9.9
10.1
10.8
Adj. EPS (`)
12.6
17.3
21.7
24.5
28.8
37.1
% chg
45.7
37.6
25.5
12.6
17.8
28.8
November 5, 2015
8
Amara Raja Batteries | 2QFY2016 Result Update
Balance sheet statement (Standalone)
Y/E March (` cr)
FY2012 FY2013 FY2014 FY2015 FY2016E FY2017E
SOURCES OF FUNDS
Equity share capital
17
17
17
17
17
17
Reserves & surplus
806
1,043
1,346
1,682
2,091
2,618
Shareholders’ Funds
823
1,060
1,363
1,700
2,108
2,635
Total loans
84
87
84
74
50
50
Deferred tax liability
22
20
30
37
37
37
Other long term liabilities
Total Liabilities
930
1,166
1,477
1,811
2,195
2,722
APPLICATION OF FUNDS
Gross block
621
680
996
1,441
2,041
2,341
Less: Acc. depreciation
267
321
372
497
675
878
Net Block
355
359
623
944
1,367
1,463
Capital work-in-progress
32
103
145
86
100
100
Investments
16
16
16
16
22
25
Other noncurrent assets
0
0
0
0
0
0
Current assets
949
1,292
1,199
1,341
1,395
1,960
Cash
229
411
295
222
119
427
Loans & advances
131
201
113
140
160
192
Other
589
680
792
980
1,116
1,341
Current liabilities
422
604
506
578
689
827
Net current assets
527
688
693
764
707
1,134
Total Assets
930
1,166
1,477
1,811
2,195
2,722
November 5, 2015
9
Amara Raja Batteries | 2QFY2016 Result Update
Cash flow statement (Standalone)
Y/E March (` cr)
FY2012 FY2013 FY2014 FY2015 FY2016E FY2017E
Profit before tax
319
422
537
610
724
919
Depreciation
43
55
51
125
178
204
Change in working capital
55
21
(121)
(143)
(45)
(120)
Others
2
(2)
11
5
-
-
Direct taxes paid
(104)
(135)
(169)
(199)
(232)
(285)
Cash Flow from Operations
314
360
308
397
625
718
(Inc.)/Dec. in fixed assets
(76)
(130)
(357)
(388)
(614)
(300)
(Inc.)/Dec. in investments
(0)
-
-
-
(6)
(3)
Cash Flow from Investing
(76)
(130)
(357)
(388)
(620)
(303)
Issue of equity
Inc./(Dec.) in loans
(11)
3
(3)
(10)
(24)
-
Dividend paid (Incl. Tax)
(38)
(50)
(65)
(72)
(84)
(108)
Others
0
0
(0)
(0)
-
-
Cash Flow from Financing
(48)
(47)
(68)
(82)
(108)
(108)
Inc./(Dec.) in cash
189
182
(117)
(72)
(103)
308
Opening Cash balances
40
229
412
295
222
120
Closing Cash balances
229
412
295
222
120
427
November 5, 2015
10
Amara Raja Batteries | 2QFY2016 Result Update
Key ratios
Y/E March
FY2012
FY2013
FY2014
FY2015
FY2016E
FY2017E
Valuation Ratio (x)
P/E (on FDEPS)
70.0
50.9
40.5
36.0
30.6
23.7
P/CEPS
57.6
41.6
34.5
27.3
22.5
18.0
P/BV
18.3
14.2
11.0
8.9
7.1
5.7
Dividend yield (%)
0.2
0.3
0.4
0.4
0.6
0.7
EV/Sales
6.3
5.0
4.3
3.5
3.1
2.5
EV/EBITDA
41.6
32.6
25.8
20.5
17.5
14.2
EV / Total Assets
16.0
12.6
10.0
8.2
6.8
5.4
Per Share Data (`)
EPS (Basic)
12.6
17.3
21.7
24.5
28.8
37.1
EPS (fully diluted)
12.6
17.3
21.7
24.5
28.8
37.1
Cash EPS
15.3
21.2
25.5
32.3
39.2
49.1
DPS
1.9
2.5
3.2
3.6
4.9
6.3
Book Value
48.2
62.0
79.8
99.5
123.4
154.3
Dupont Analysis
EBIT margin
13.6
14.6
15.7
14.6
14.8
15.7
Tax retention ratio
0.7
0.7
0.7
0.7
0.7
0.7
Asset turnover (x)
3.4
3.9
2.9
2.7
2.4
2.6
ROIC (Post-tax)
31.1
39.2
31.4
26.3
23.8
27.7
Cost of Debt (Post Tax)
3.2
0.2
0.6
0.2
1.1
1.4
Leverage (x)
(0.2)
(0.3)
(0.2)
(0.1)
(0.0)
(0.1)
Operating ROE
26.2
27.3
26.7
24.1
23.0
23.9
Returns (%)
ROCE (Pre-tax)
34.7
37.0
36.6
34.1
33.0
33.8
Angel ROIC (Pre-tax)
46.1
57.1
45.8
38.9
34.9
40.1
ROE
26.1
27.9
27.2
24.6
23.4
24.1
Turnover ratios (x)
Asset Turnover (Gross Block)
3.8
4.3
3.5
2.9
2.4
2.5
Inventory / Sales (days)
41.0
36.1
35.4
36.1
35.9
36.1
Receivables (days)
49.1
47.0
47.9
47.8
46.8
46.8
Payables (days)
64.9
74.5
53.5
49.8
51.4
51.4
WC cycle (ex-cash) (days)
45.8
34.2
42.1
46.7
43.8
43.9
Solvency ratios (x)
Net debt to equity
(0.2)
(0.3)
(0.2)
(0.1)
(0.0)
(0.1)
Net debt to EBITDA
(0.4)
(0.7)
(0.4)
(0.2)
(0.1)
(0.4)
Interest Coverage (EBIT / Int.)
80.5
1603.1
753.9
2572.4
906.5
920.4
November 5, 2015
11
Amara Raja Batteries | 2QFY2016 Result Update
Research Team Tel: 022 - 39357800
DISCLAIMER
Angel Broking Private Limited (hereinafter referred to as “Angel”) is a registered Member of National Stock Exchange of India Limited,
Bombay Stock Exchange Limited and Metropolitan Stock Exchange of India Limited. It is also registered as a Depository Participant with
CDSL and Portfolio Manager with SEBI. It also has registration with AMFI as a Mutual Fund Distributor. Angel Broking Private Limited is
a registered entity with SEBI for Research Analyst in terms of SEBI (Research Analyst) Regulations, 2014 vide registration number
INH000000164. Angel or its associates has not been debarred/ suspended by SEBI or any other regulatory authority for accessing
/dealing in securities Market. Angel or its associates including its relatives/analyst do not hold any financial interest/beneficial
ownership of more than 1% in the company covered by Analyst. Angel or its associates/analyst has not received any compensation /
managed or co-managed public offering of securities of the company covered by Analyst during the past twelve months. Angel/analyst
has not served as an officer, director or employee of company covered by Analyst and has not been engaged in market making activity
of the company covered by Analyst.
This document is solely for the personal information of the recipient, and must not be singularly used as the basis of any investment
decision. Nothing in this document should be construed as investment or financial advice. Each recipient of this document should
make such investigations as they deem necessary to arrive at an independent evaluation of an investment in the securities of the
companies referred to in this document (including the merits and risks involved), and should consult their own advisors to determine
the merits and risks of such an investment.
Reports based on technical and derivative analysis center on studying charts of a stock's price movement, outstanding positions and
trading volume, as opposed to focusing on a company's fundamentals and, as such, may not match with a report on a company's
fundamentals.
The information in this document has been printed on the basis of publicly available information, internal data and other reliable
sources believed to be true, but we do not represent that it is accurate or complete and it should not be relied on as such, as this
document is for general guidance only. Angel Broking Pvt. Limited or any of its affiliates/ group companies shall not be in any way
responsible for any loss or damage that may arise to any person from any inadvertent error in the information contained in this report.
Angel Broking Pvt. Limited has not independently verified all the information contained within this document. Accordingly, we cannot
testify, nor make any representation or warranty, express or implied, to the accuracy, contents or data contained within this document.
While Angel Broking Pvt. Limited endeavors to update on a reasonable basis the information discussed in this material, there may be
regulatory, compliance, or other reasons that prevent us from doing so.
This document is being supplied to you solely for your information, and its contents, information or data may not be reproduced,
redistributed or passed on, directly or indirectly.
Neither Angel Broking Pvt. Limited, nor its directors, employees or affiliates shall be liable for any loss or damage that may arise from
or in connection with the use of this information.
Note: Please refer to the important ‘Stock Holding Disclosure' report on the Angel website (Research Section). Also, please refer to the
latest update on respective stocks for the disclosure status in respect of those stocks. Angel Broking Pvt. Limited and its affiliates may
have investment positions in the stocks recommended in this report.
Disclosure of Interest Statement
Amara Raja Batteries
1. Analyst ownership of the stock
No
2. Angel and its Group companies ownership of the stock
No
3. Angel and its Group companies' Directors ownership of the stock
No
4. Broking relationship with company covered
No
Note: We have not considered any Exposure below ` 1 lakh for Angel, its Group companies and Directors
Ratings (Based on expected returns
Buy (> 15%)
Accumulate (5% to 15%)
Neutral (-5 to 5%)
over 12 months investment period):
Reduce (-5% to -15%)
Sell (< -15)
November 5, 2015
12