Initiating coverage | Pharma
January 3, 2017
Alkem Laboratories
BUY
CMP
`1,620
Relieving pain
Target Price
`1,989
Alkem Laboratories is a Mumbai based pharma company engaged in
Investment Period
12 Months
manufacturing and marketing of generic drugs, APIs and neutraceutical products.
Company sells its drugs in India and ~50 countries including the US. It has 16
Stock Info
manufacturing facilities of which 14 are in India and two in the USA.
Sector
Pharma
Strong domestic business- Alkem is the 5th largest pharma company in India in
Market Cap (` cr)
19,397
terms of domestic revenues. Its acute segment contributes 88% of domestic
Net Debt (` cr)
80
revenue while chronic business contributes 12%. In the acute business, company
Beta
0.2
is ranked #1 in anti-infective segment and #3 each in pain and Gastro intestinal
52 Week High / Low
1,853/1,175
segments. Alkem is currently a small player in the chronic segment but it is
Avg. Daily Volume
36,397
expanding this business rapidly.
Face Value (`)
2
Domestic business to continue its outperformance vs. industry: Alkem is expected
BSE Sensex
26,595
to continue its outperformance vs. industry due to strong growth in its acute and
Nifty
8,180
chronic segments. Both segments are expected to grow at CAGR of 16% and 30%
Reuters Code
ALKE.BO
respectively in next 3 years due to higher sales of major brands and market share
gains. We expect domestic sales to grow at 15.8% CAGR to `5,620cr in FY19E,
Bloomberg Code
ALKEM IN
vs. domestic industry growth of ~14% in next 3 years.
US revenue to double with increased ANDA monetization: Alkem’s ANDA pipeline
Shareholding Pattern (%)
increased 2.5x from 31 ANDAs in FY12 to 76 ANDAs in H1FY17. ANDA
Promoters
66.9
approvals also grew by 2.8x during the same period. In next three years company
expects increased ANDA launches on the back of approval to 2/3rd of its pipeline.
MF / Banks / Indian Fls
3.3
This will to double its US revenue from `991cr in FY16 to `1,919cr in FY19E.
FII / NRIs / OCBs
3.7
Improving operating performance: Alkem’s operating performance is expected to
Indian Public / Others
26.1
improve with better sales mix (increasing exports) and market share gains in
chronic segment. The company has already seen margin improvement and with
rising profitability of US business, we estimate 70-100bps margin expansion.
Abs. (%)
3m 6m 1yr
Sensex
(4.6)
(2.1)
1.7
Outlook and Valuation: The stock at the CMP of `1,620 is available at P/E of
15.5x of FY19E EPS of `105, which is at ~15% discount to average P/E (18.4x) of
Alkem
(2.5)
18.7
8.2
the peer group. In our view this discount is unwarranted considering 1) Strong
earnings momentum (CAGR of 22.3% in PAT from FY16-FY19E vs. CAGR of
Price Chart
18.3% from FY11-FY16), 2) Improving RoE (average 21.5% RoE from FY17E-
2,000
1,800
FY19E) and 3) Increasing ANDA pipeline and near term launches in the US. We
1,600
rate Alkem ‘Buy’ with a price target of `1,989 (19.0x of FY19E earnings).
1,400
1,200
1,000
Key Financials (Consolidated)
800
Y/E March (` cr)
FY15
FY16
FY17E
FY18E
FY19E
600
Net Sales
3,743
4,992
6,043
6,893
8,114
400
% chg
19.7
33.3
21.1
14.1
17.7
200
0
Net Profit
392
684
973
1,062
1,251
% chg
(10.0)
71.9
44.5
9.2
17.8
OPM (%)
11.3
17.0
18.7
19.3
19.4
EPS (`)
32.8
56.3
81.4
88.8
104.7
Source: Company, Angel Research
P/E (x)
49.5
28.8
19.9
18.2
15.5
P/BV (x)
6.5
5.5
4.5
3.8
3.3
RoE (%)
13.1
19.2
22.7
20.9
21.0
RoCE (%)
8.0
17.6
20.3
20.5
21.1
Shrikant Akolkar
EV/Sales (x)
5.2
3.8
3.1
2.7
2.3
022 - 3935 7800 Ext: 6846
EV/EBITDA (x)
46.2
22.3
16.8
14.2
11.8
Source: Company, Angel Research; Note: CMP as of January 2, 2017
Please refer to important disclosures at the end of this report
1
Initiating coverage | Alkem Laboratories
Company background
Alkem is a leading Indian pharmaceutical company with major operations in India
and the USA. It is the fifth largest pharmaceutical company in India in terms of
domestic sales and a market leader in anti-infective therapeutic segment. Alkem
was founded in 1973 and produces branded generics, generic drugs, active
pharmaceutical ingredients, which are then sold in its end markets. For FY2016,
Alkem generated 73% revenue from domestic operations and rest 27% from
international operations. It has a portfolio of more than 800 brands in India and a
pipeline of 76 abbreviated new drugs applications (ANDA) of which 34 are
approved as of September Q2FY2016.
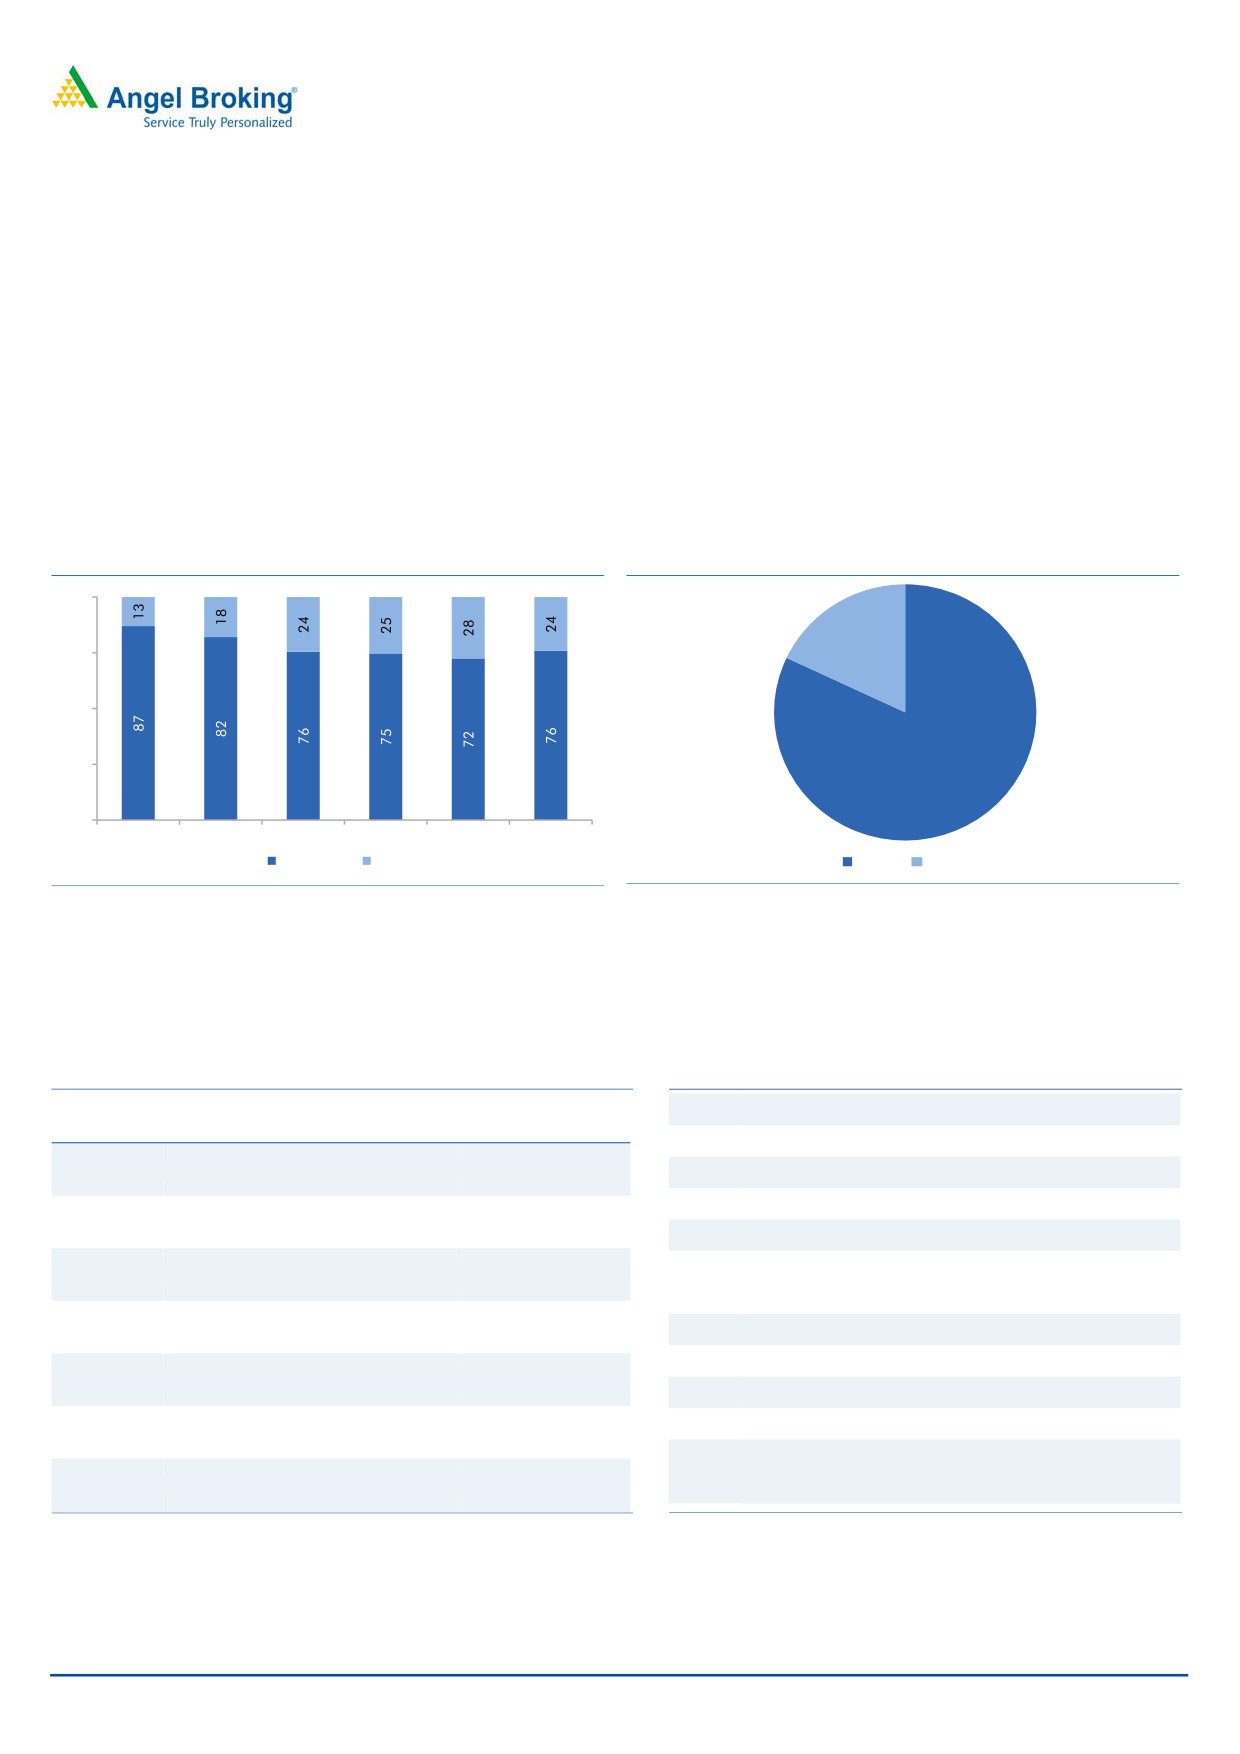
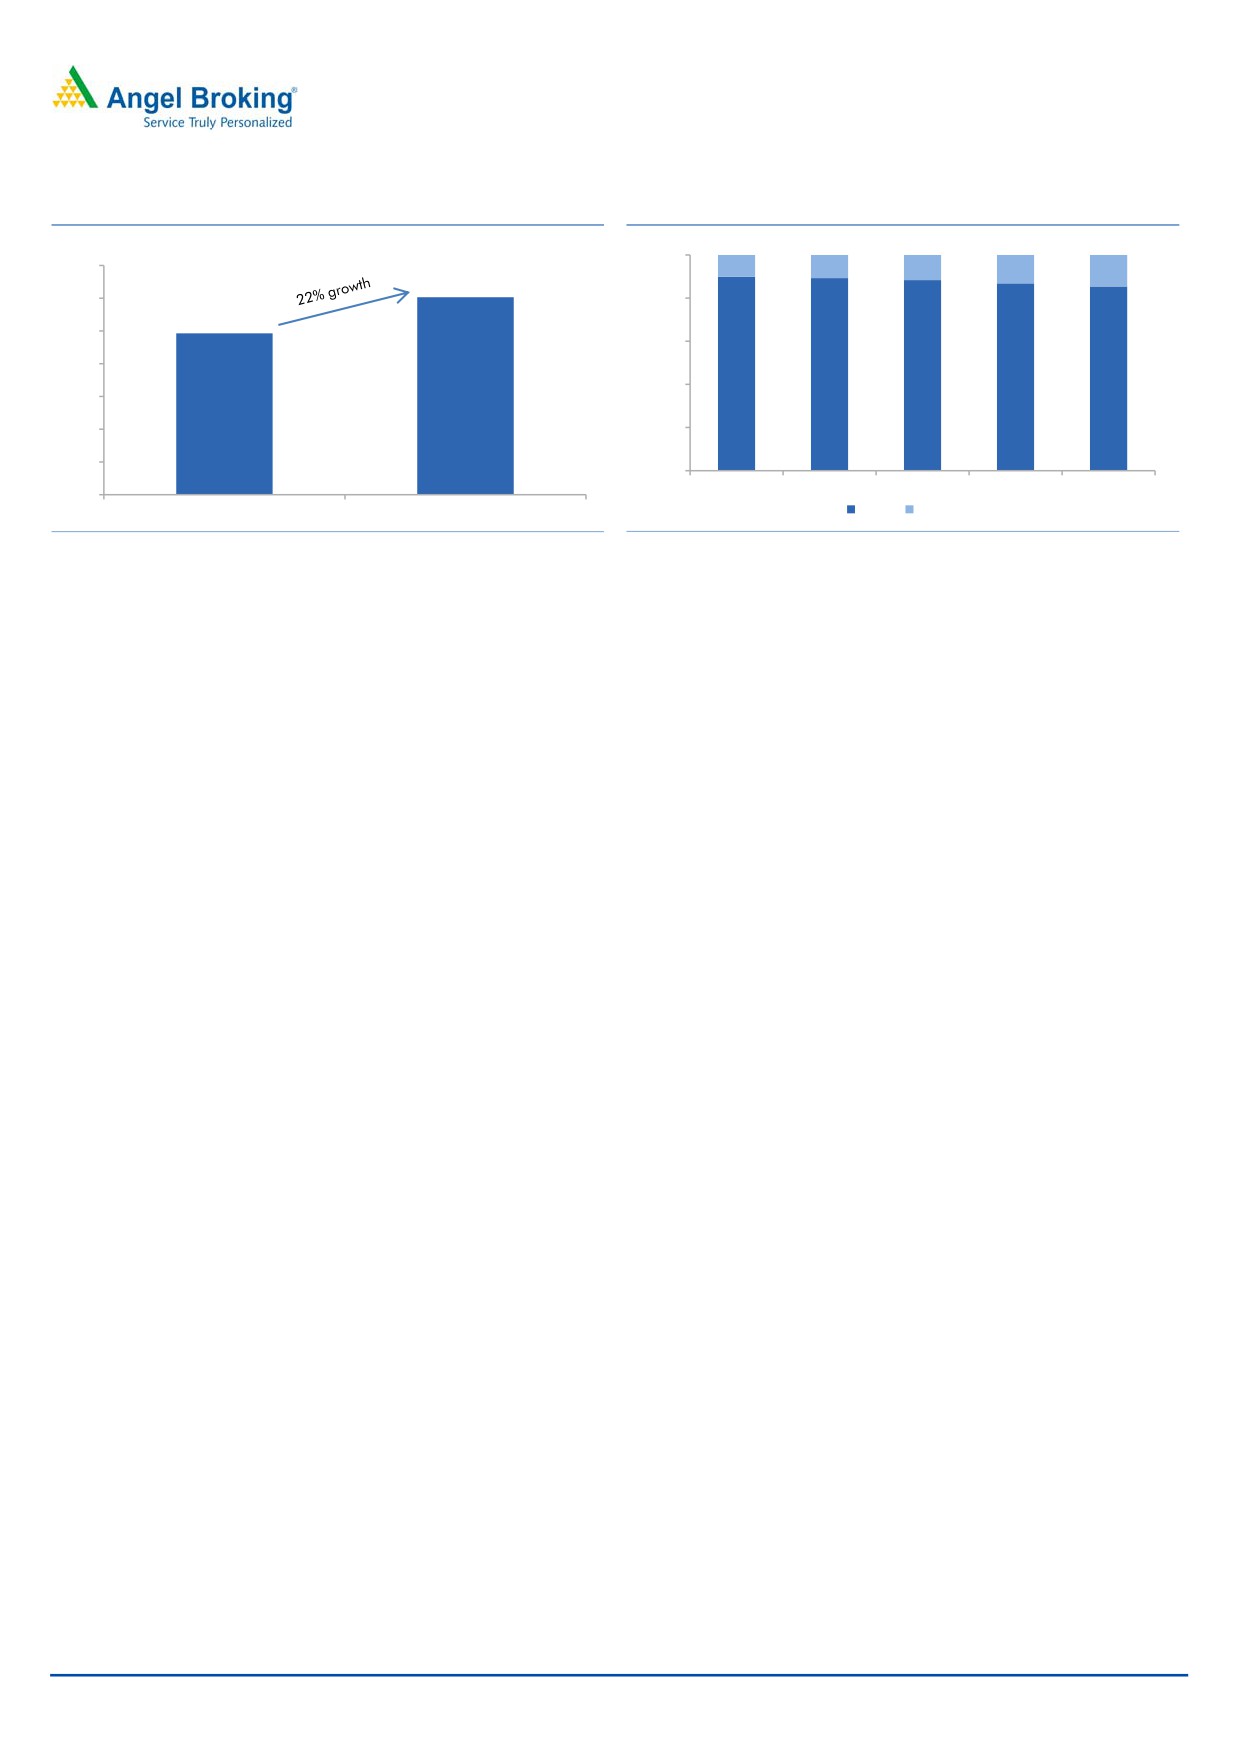
Exhibit 1: Evolution of business mix (%)
Exhibit 2: Domestic business mix
100
18
75
50
25
82
0
FY2012
FY2013
FY2014
FY2015
FY2016
Q2FY2017
Domestic
Exports
Acute
Chronic
Source: Company, Angel Research
Source: Company, Angel Research
Alkem has total 16 manufacturing facilities, 14 in India and 2 in USA - all
approved by regulatory authorities such as USFDA, UK MHRA, TGAAustralia,
WHO, etc.
Exhibit 3: Manufacturing facilities
Exhibit 4: Key milestones in corporate history
Geographical
1973 Incorporation of the company
Facility
Regulatory approval
Focus
1978 Established Taloja manufacturing facility
Baddi
USFDA, UK-MHRA, WHO-GMP
India + US + Global
1992 Established Mandva manufacturing facility
2003 Set up of Taloja R&D facility for ANDA development
Sikkim
WHO-GMP
India
2007 Filed its first ANDA in the US
Received its first ANDA approval
#Daman USFDA, UK-MHRA, Indian GMP
India + US + Global
2009
Acquisition of Pharmacor Pty Ltd
#Mandva Indian GMP, USFDA
India + US
2010 Acquisition of Ascend Laboratories
2011 Acquisition of Enzene
*Ankaleshwar Indian GMP, USFDA, TGA-Australia US
2012 Acquisition of an API Manufacturing facility in the USA.
2014 Acquisition of “Clindac-A” brand from Galderma S.A.
California
USFDA
US
Acquisition of formulation 1) manufacturing facility in
2015
the US 2) 51% stake in Indchemie Health Specialities
St. Louis
USFDA
US
and Cachet Pharma IPO and listing
Source: Company, Angel Research; Note: * Ankaleshwar facility was inspected by
Source: Company, Angel Research
USFDA authorities and received 3 observations on the facility. # Daman and Mandva
Facilities have received the Establishment Investigation Report from the USFDA.
January 3, 2017
2
Initiating coverage | Alkem Laboratories
Investment Rationale
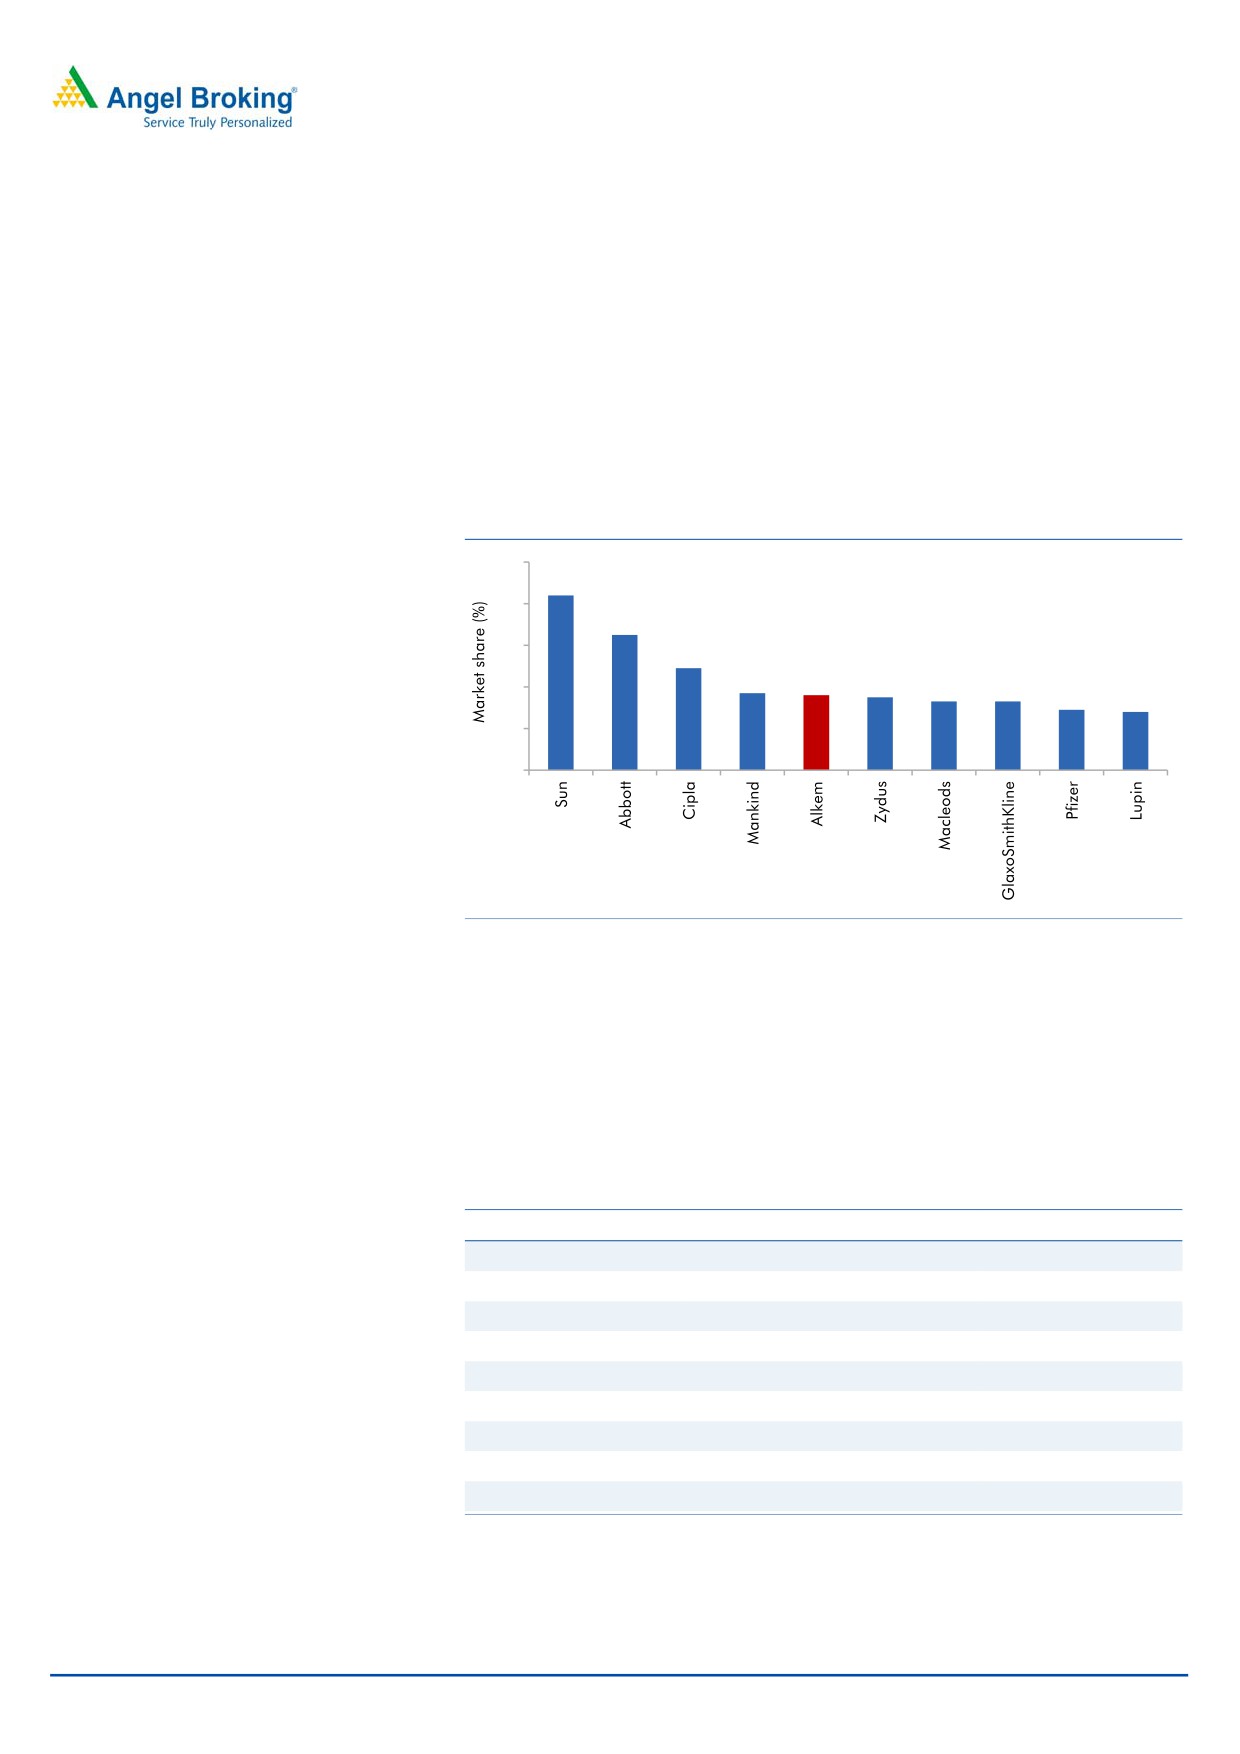
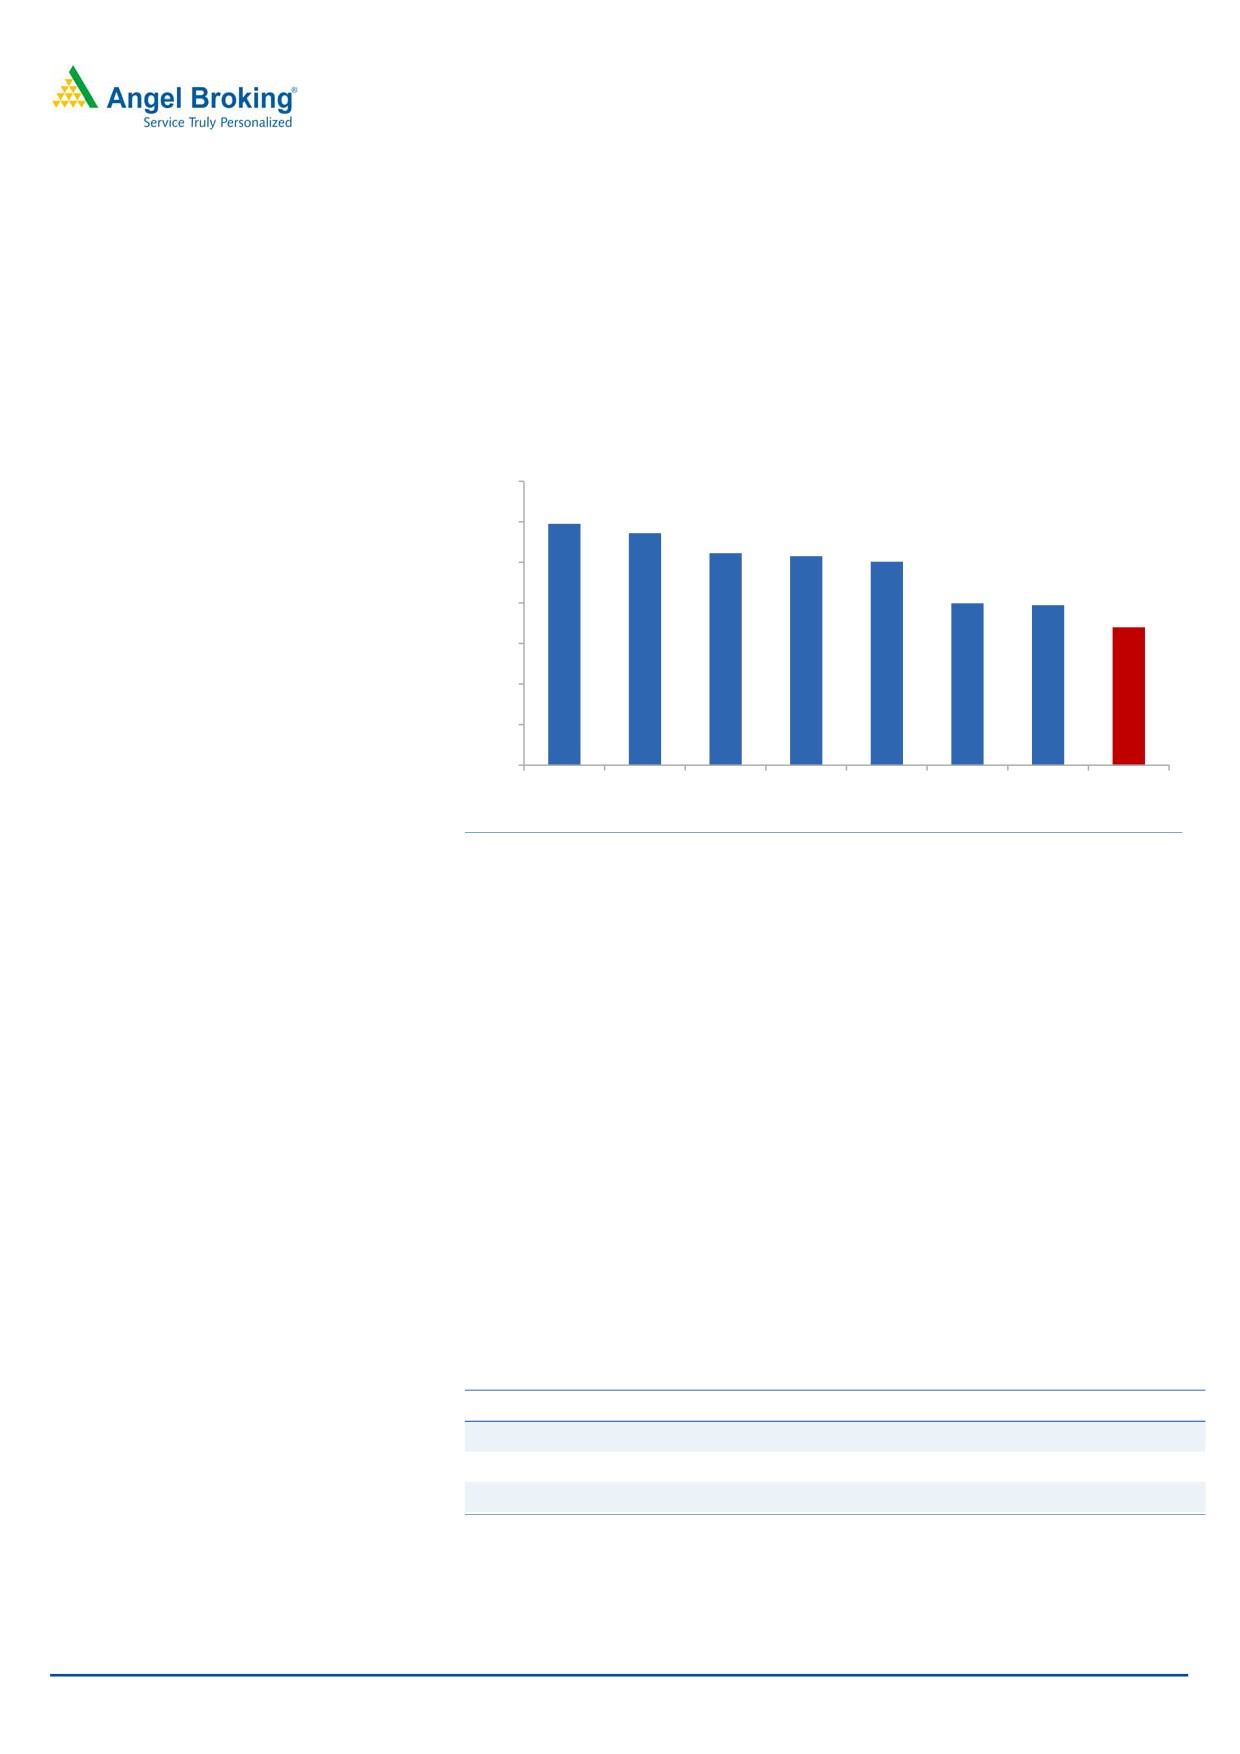
Strong player in domestic market: Alkem Laboratories is a 5th largest
pharmaceutical company in India in terms of domestic sales. The company in
FY16 recorded domestic revenue of `3,618cr and held market share of ~3.6%.
Alkem has a comprehensive portfolio of more than 800 brands, which covers all
major domestic therapeutic segments and in some of the segments, it is ranked in
top three market positions. It holds #1 position in Anti-infective segment and is
ranked #3 in Gastro-Intestinal and Pain/Analgesics segments. It also holds 7.9%
share of overall prescriptions in India.
Exhibit 5: Alkem is one of the top 5 domestic pharma players
10
8.4
8
6.5
6
4.9
3.7
3.6
3.5
4
3.3
3.3
2.9
2.8
2
0
Source: Company, Angel Research
The company has some mega brands such as Clavam, Taxim, Pan, Gemcal,
Ondem, Xone, Enzoflam, Taximax, etc., which are from various therapeutic
segments. 5 of its brands feature in top 50 brands in the Indian pharmaceutical
industry; while a total 14 brands feature in list of top 300 brands. The three brand
franchisees, namely Clavam, Pan and Taxim add ~`800cr in its domestic revenue
(~22% of annual domestic revenue), which shows strength of its mega brands.
Exhibit 6: Major brands and their sales in FY15
Brand name
Market share (%)
Sales in ` cr
Clavam
15.5
215
Taxim-O
19.7
151
Taxim
76.6
151
Pan
28.9
145
Pan-D
26.0
129
A to Z NS
4.4
73
Gemcal
12.7
69
Sumo
38.4
66
Xone
10.4
62
Source: Company, Angel Research
January 3, 2017
3
Initiating coverage | Alkem Laboratories
Significantly outperforming the domestic pharma market: Alkem, in last seven
years, has outperformed the domestic pharma industry due to 1) strong brand
strength 2) leadership position in key therapeutics segments 3) good relationships
with doctors and 4) effective execution of its sales strategy.
The company currently employs ~6000 Medical Representatives (MR) in India. Its
average net revenue per MR was `49lakh in FY15 but significantly improved to
`60lakh in FY16, which is now at par with the industry (~`55Lakh-`60Lakh per
MR). Over the last few years, the company has increased its field force aggressively
to improve its chronic business revenue where its sees strong business
opportunities.
Alkem has a strong sales network, which is supporting its strong performance in
the domestic markets. Besides 6,000 MRs, it also has 40 sales depots, 49 clearing
and forwarding agents, 19 consignees and eight central warehouses covering over
7,000 stockists. The company also tracks its stock in real time throughout
Pan-India, which also helps to ensure consistent supply of the drugs in the country.
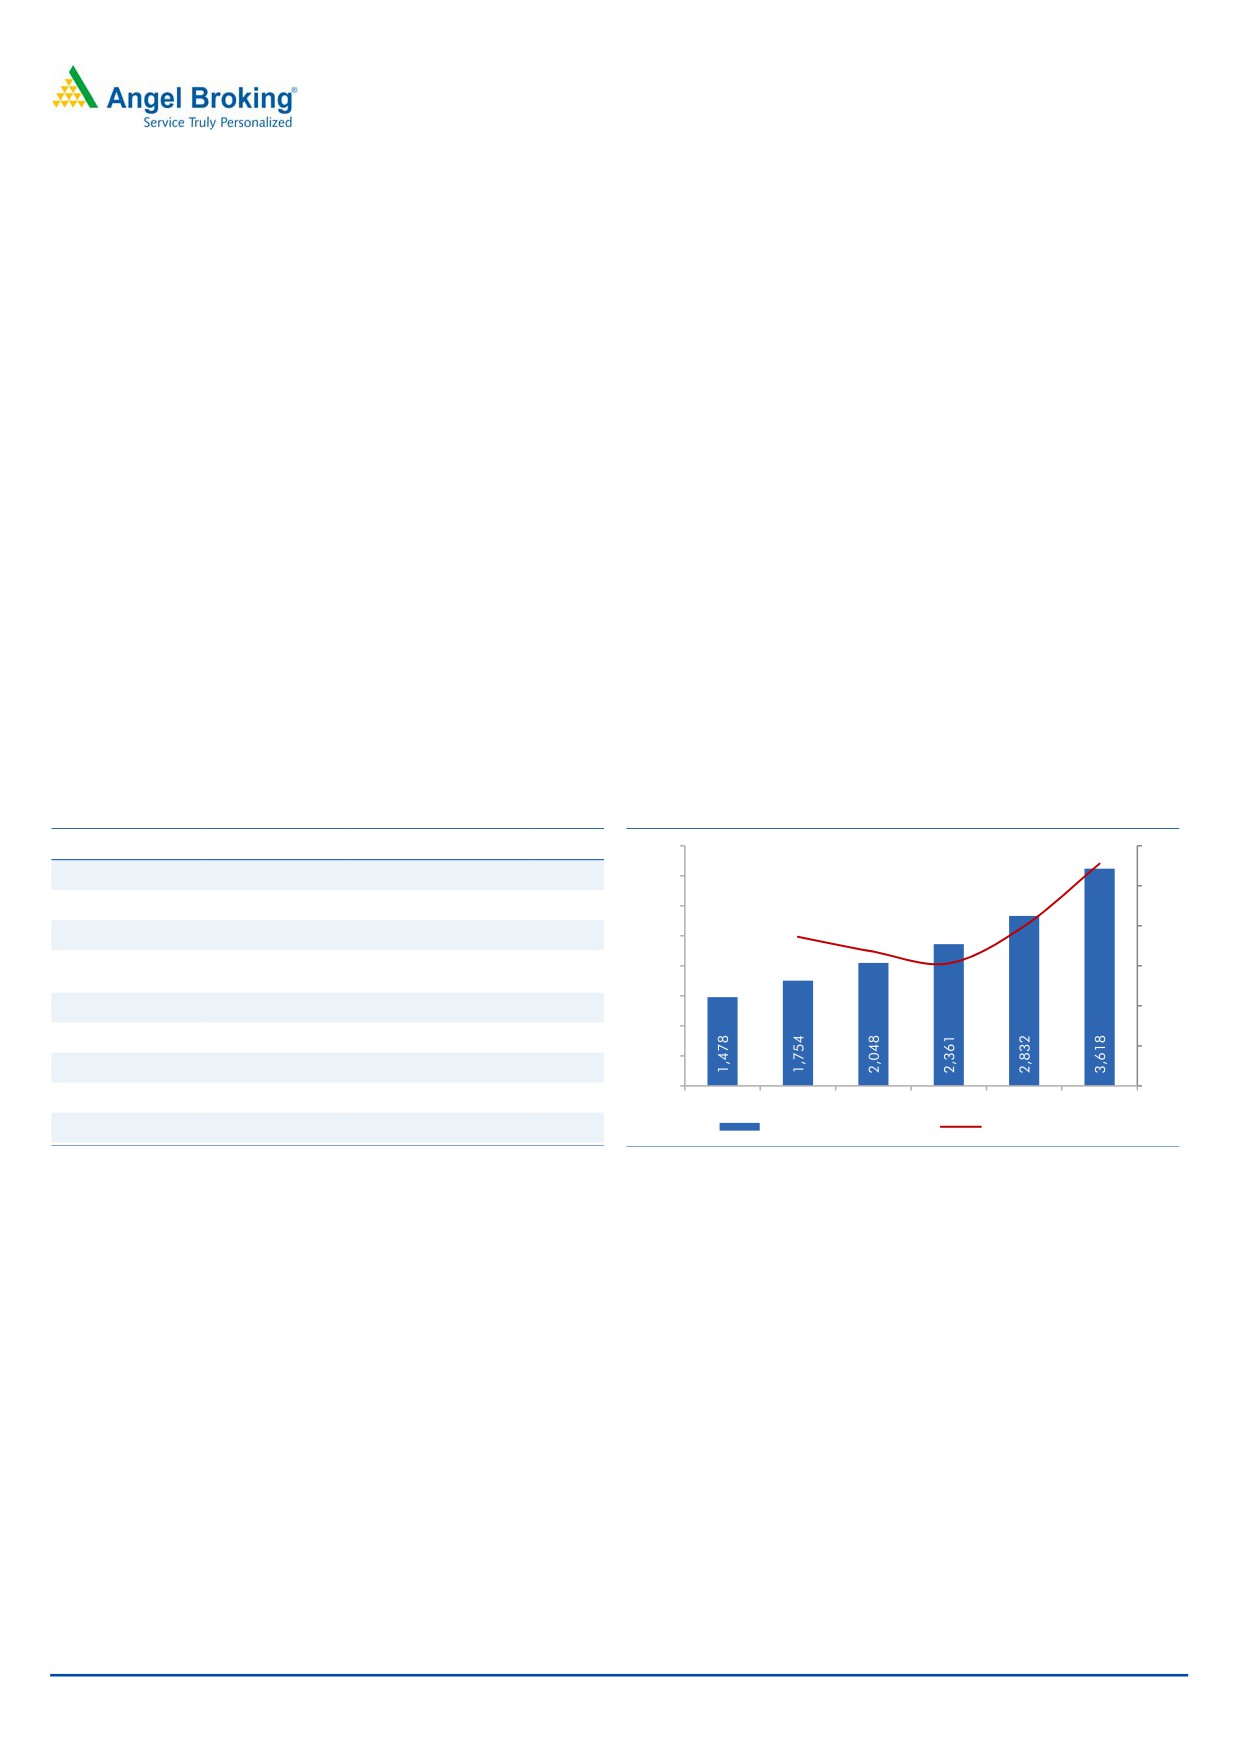
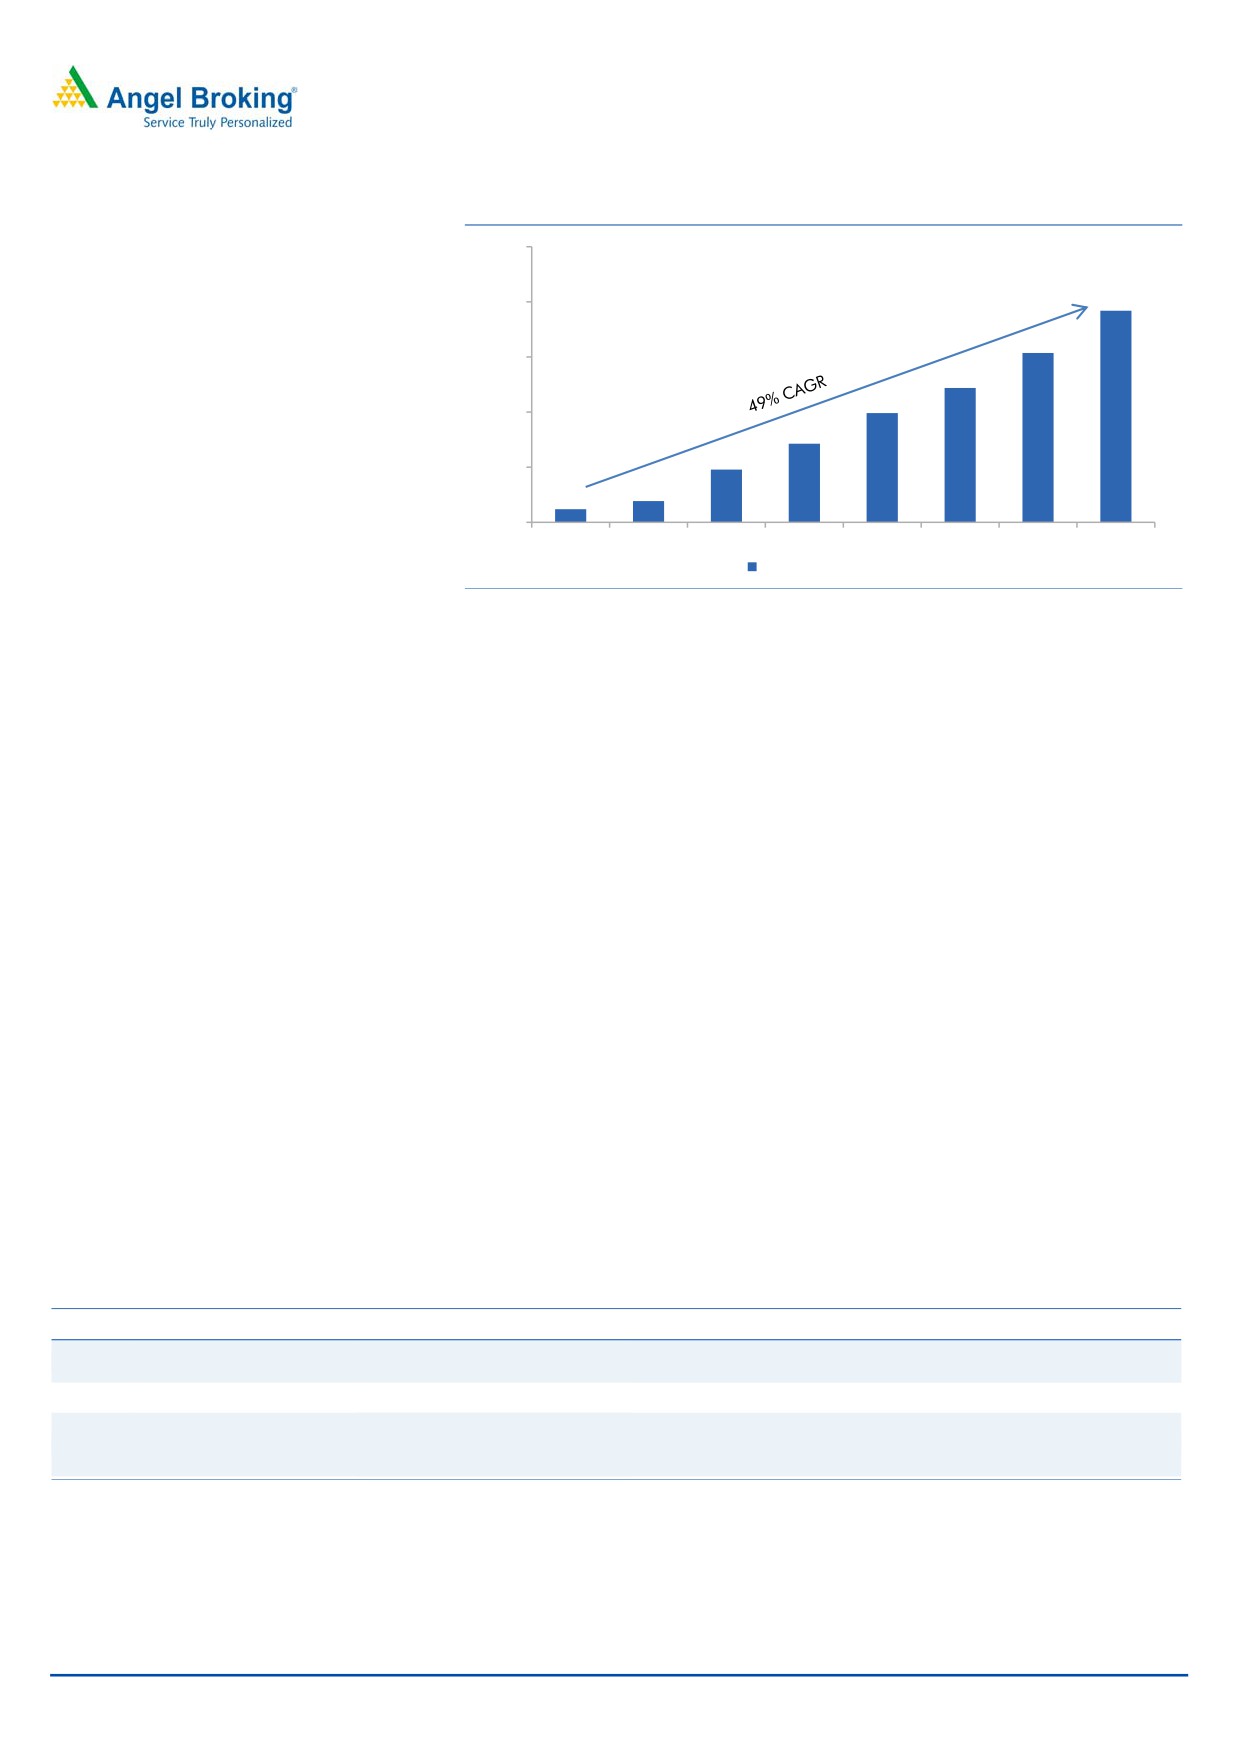
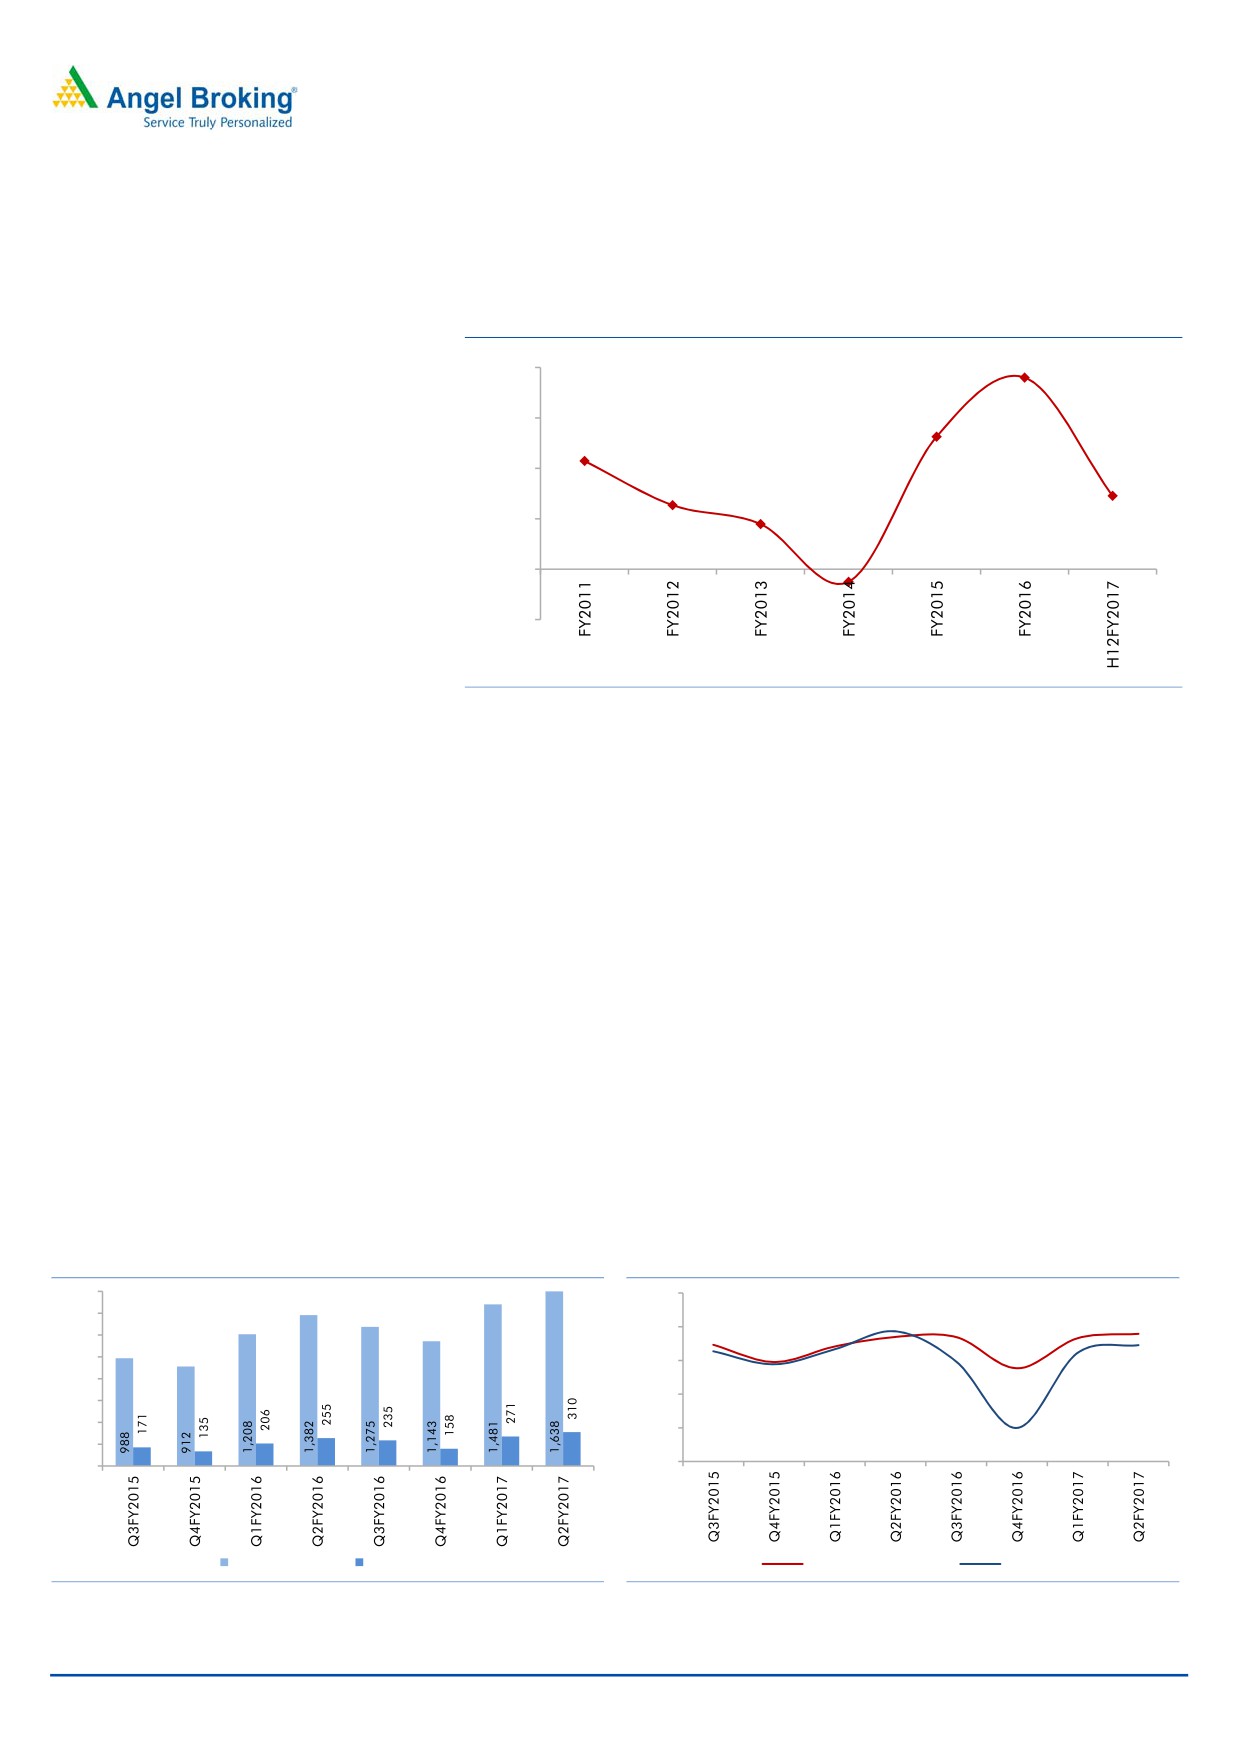
Aided by this infrastructure, company has been outperforming the industry growth
by ~400-500bps over FY12-FY16. During this period, company reported a CAGR
of 20% in domestic revenue compared to industry growth of ~13%.
Exhibit 7: Market share in key segments FY16
Exhibit 8: CAGR of 20% from FY11-FY16
Segment
Industry size (` cr)
Market share (%)
Rank
4,000
Domestic business
27.8
30
Anti-infective
11,338
11.60
1
3,500
25
GI
9,679
5.70
3
3,000
20.0
18.6
16.8
20
Pain /analgesics
6,971
5.10
3
2,500
15.3
Vitamin/minerals
2,000
15
6,921
3.70
5
/nutrients
1,500
Gynecology
4,759
2.60
9
10
1,000
Respiratory
7,156
1.50
19
5
500
Neuro/CNS
5,366
1.90
13
0
0
Derma
5,952
1.50
15
FY11
FY12
FY13
FY14
FY15
FY16
Cardiac
10,304
0.60
31
Domestic sales (` cr)
Growth rate (%)
Source: Company, Angel Research
Source: Company, Angel Research
Chronic therapies to lead the industry growth: Currently the domestic formulations
industry is valued at ~`868billion, which has been growing at a compounded
annual growth rate of ~13% since 2012. The industry is expected to continue
growing at the same rate to reach ~`1,400billion in 2020, largely due to the
rising healthcare spending, increasing medical facilities, increasing penetration of
medical insurance, change in lifestyle, etc. This is going to drive the overall market
size of the pharmaceutical industry in India. The domestic formulation can be
further divided in two sub-segments i.e. Acute and Chronic.
1) Acute - The diseases which last for short duration with quicker onset such as
bacterial infections, injuries, flu, burns, etc.
2) Chronic - The diseases which last for long duration such as heart disease,
diabetes, stroke, cancer, HIV/AIDs, etc.
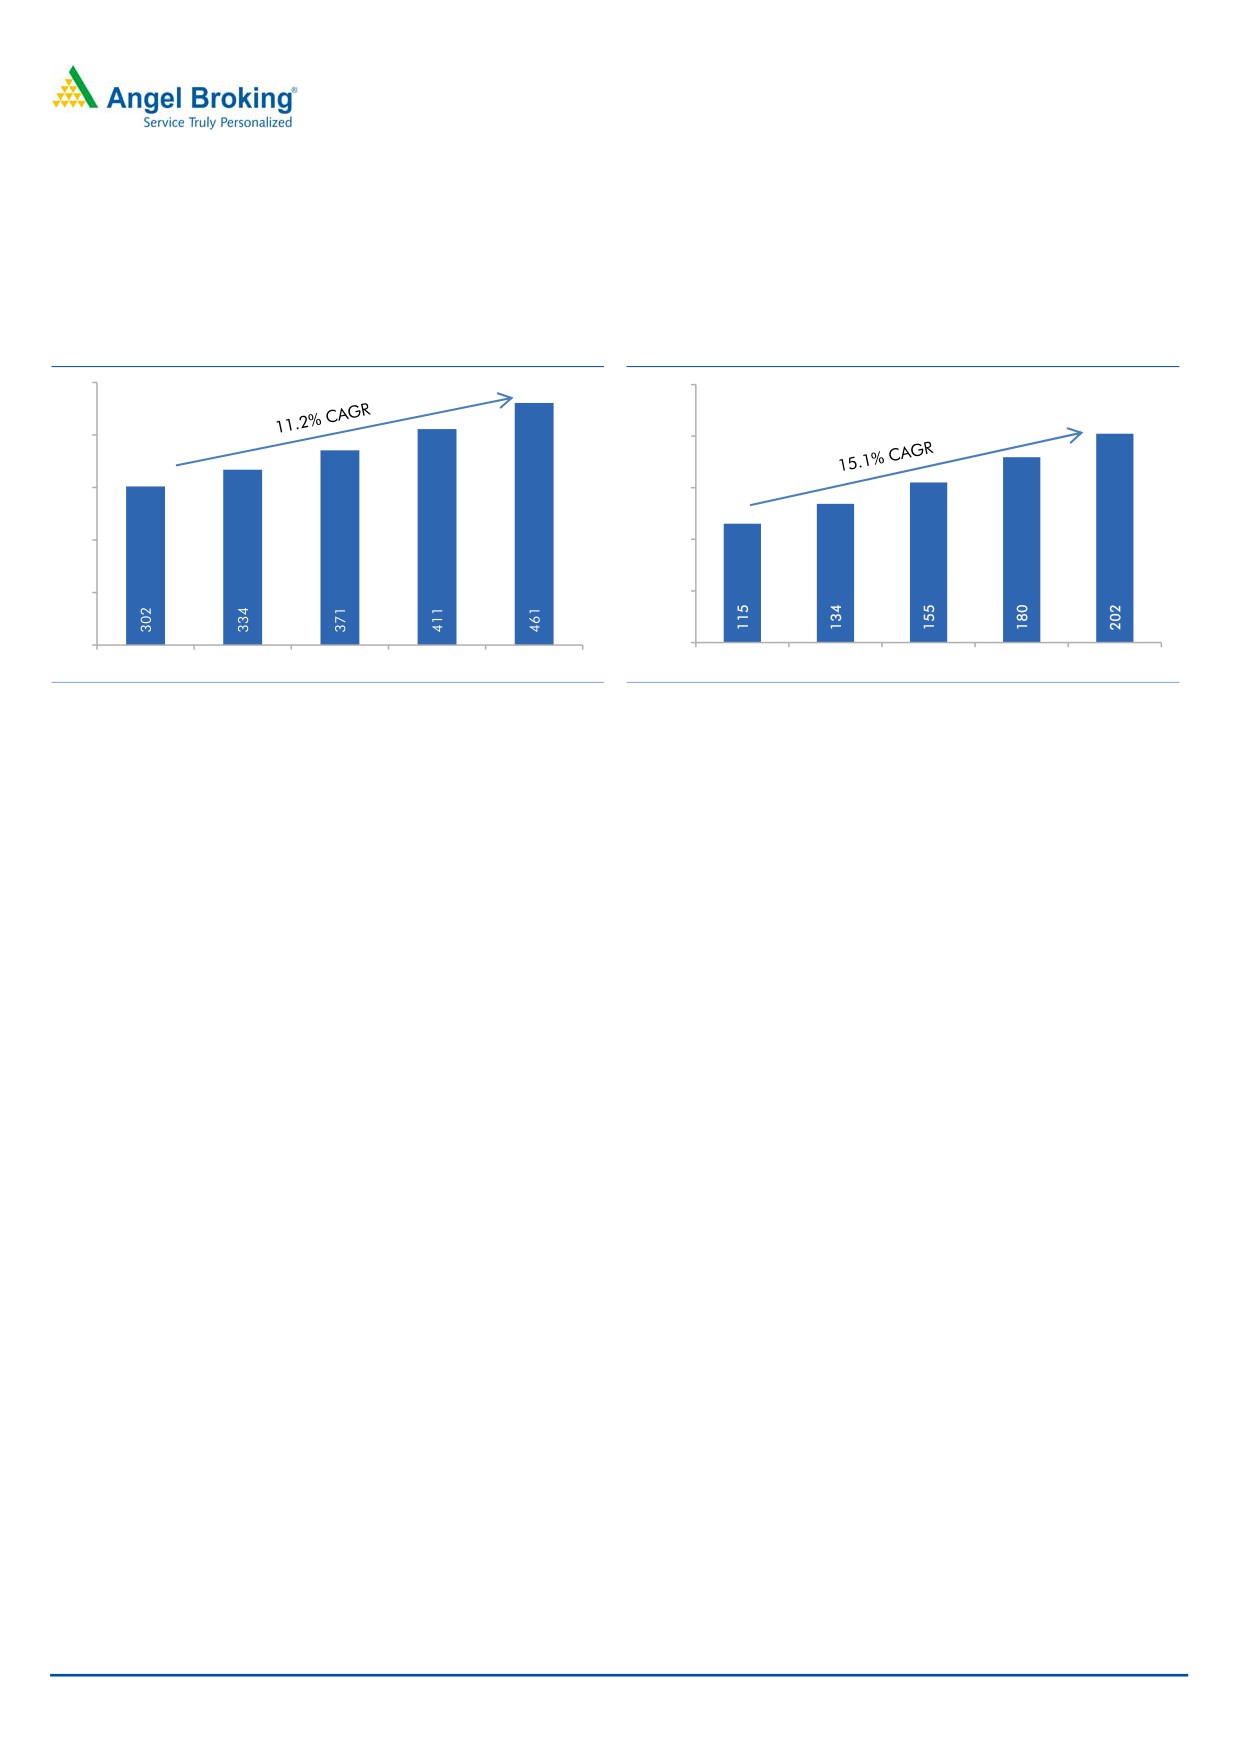
The acute segment has the highest share in the domestic formulations market
(~70%) and is growing at a rate of ~11%. The chronic segment (30% of the total
January 3, 2017
4
Initiating coverage | Alkem Laboratories
industry) is growing rapidly at 15% as the overall disease profile of the country is
moving towards the long duration diseases due to rapid change in the lifestyle of
people. Going forward, chronic segment is expected to exhibit high growth rate, whereas
acute segment is expected to hold the high market share and continue to grow.
Exhibit 9: Acute segment size (` bn) and growth (%)
Exhibit 10: Chronic segment size (`bn) and growth (%)
500
250.00
400
200.00
300
150.00
200
100.00
100
50.00
0
0.00
FY11
FY12
FY13
FY14
FY15
FY11
FY12
FY13
FY14
FY15
Source: Company, Angel Research
Source: Company, Angel Research
Growth drivers of domestic formulations are:
1) Acute - Greater awareness in patients, higher penetration of branded drugs,
increasing preference of patients to self medicate by using OTC brands,
volume growth as acute conditions are treated by mostly general practitioners,
etc.
2) Chronic - Overall increase in chronic conditions, growing investments in
specialty hospitals in tier II/tier III cities, coverage of chronic conditions by
insurers, increasing affordability of medicines and surgeries, launch of niche
and patented products, etc.
Alkem to benefit from investments in the chronic segment: Alkem is a market
leader in the acute segment from which it derives 88% of its domestic revenue. We
believe that the company by leveraging on its mega brands and relationships with
doctors is likely to continue growing its acute business revenues. We forecast
revenue CAGR of 15.7% from FY16-FY19E in the acute business segment.
While maintaining its leadership position in acute business, the company has
made sizable investments to grow its share in chronic business and has allocated
~25% of its field force (1,500 MRs) to cater to this segment. In our opinion
company has a long way to go in the chronic segment which contributes 12% of
domestic sales. The company realizing this is now focusing on growth of this
segment. Most of the current field force (MRs) has been hired from the leading
pharmaceutical players over the last three years. The productivity of these MRs is
expected to increase going ahead, which will increase the market share of the
company in the chronic segment.
January 3, 2017
5
Initiating coverage | Alkem Laboratories
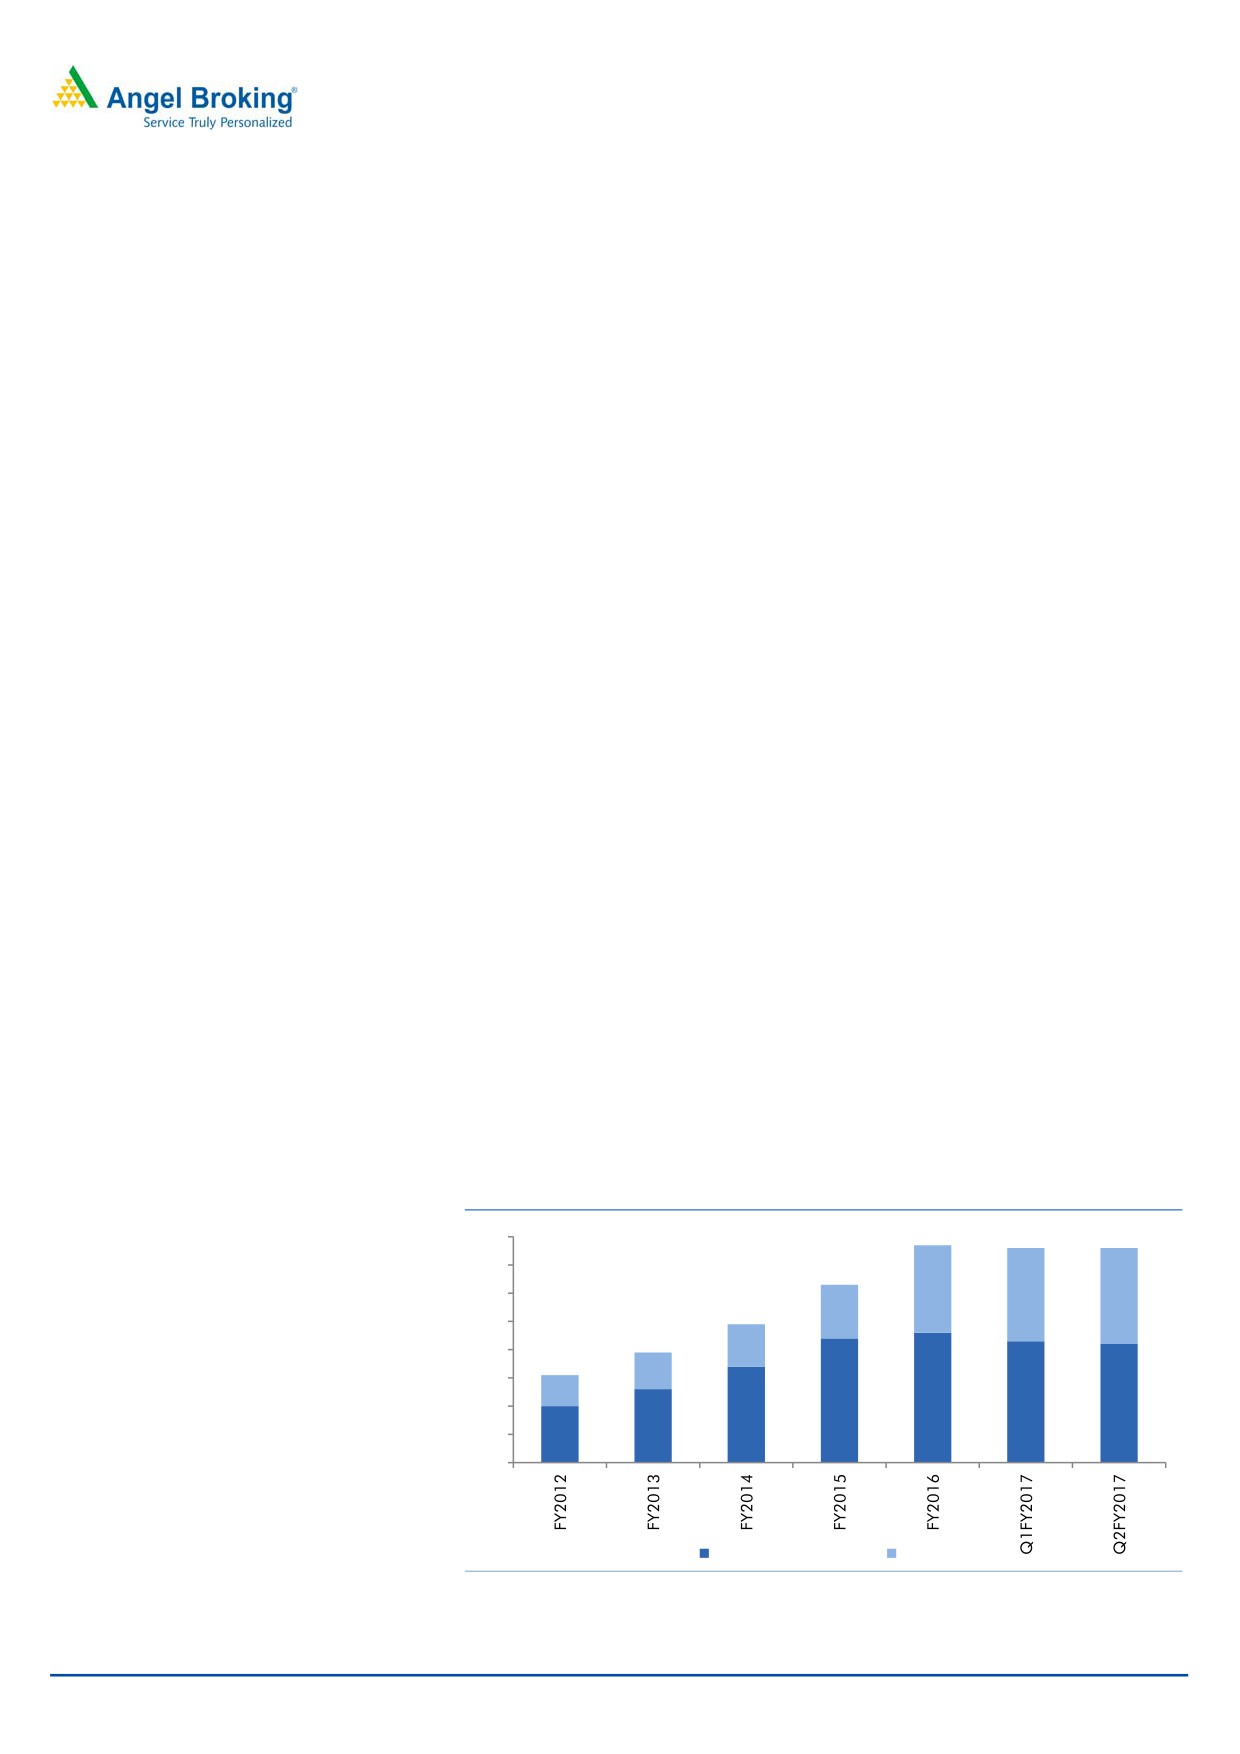
Exhibit 11: Improving MR productivity
Exhibit 12: Domestic sales mix to change in near term
(` lakh)
100%
70.0
10%
11%
12%
13%
15%
60
60.0
80%
49
50.0
60%
40.0
90%
89%
88%
87%
40%
85%
30.0
20.0
20%
10.0
0%
0.0
FY2015
FY2016
FY2017E
FY2018E
FY2019E
FY2015
FY2016
Acute Chronic
Source: Company, Angel Research
Source: Company, Angel Research
Though there is competition in chronic segment from the MNC giants, we see that
Alkem, despite being a late entrant, has been able to garner some market share.
Its growth rate of ~20% in chronic segment is likely to help it gain more market
share in future.
NLEM impact offset by higher volumes: National List of Essential Medicines (NLEM)
includes list of essential drugs whose prices are to be controlled as per Drug
Pricing Control Order (DPCO). As per DPCO, the prices of each of the
formulations are determined based on the average of all drugs having an Indian
market share of more than 1% by value. In 1994, prices of 74 drugs were
controlled, which rose to 348 in 2013 and further to 376 in 2015. We believe that
NLEM uses WHO Essential Medicines List as a model and scope of including the
drugs is taken accordingly. In 2015, there were 414 drugs in the WHO EML list
and 376 drugs in NLEM list. We believe that NLEM in the next revision may include
more number of drugs.
Some of the Alkem’s drugs (Taxim O, Ondem, Cetriz, etc.) appear in the list of
NLEM. Overall, 30% of its portfolio is exposed to NLEM; however, the higher
volumes have largely offset the impact of NLEM on its business. In Q2FY17, the
impact was ~3%; while that in Q1FY2017 along with FDC ban, was ~4-5%.
US- The key focus area despite late entry: Alkem is a late entrant in the US
market compared to top Indian pharma companies. Almost all big Indian pharma
companies entered the US market in early 2000s, and have shown a sustainable
growth rate in the mid term there. Alkem is also trying to achieve similar track
record in the US markets, despite lagging behind the bigger peers. It entered the
US market in FY10 and since then, it has grown its US business to `991cr in
FY2016. This works out to be 70% CAGR on the base of FY2012 revenue of
`118cr. The company markets its products through its marketing subsidiary,
Ascend Laboratories LLC.
January 3, 2017
6
Initiating coverage | Alkem Laboratories
Exhibit 13: Strong growth in US revenues
2,500
2,000
1,500
1,000
500
0
FY12
FY13
FY14
FY15
FY16
FY17E FY18E FY19E
US revenue (` cr)
Source: Company, Angel Research
This has been possible as the company utilized the opportunity presented by
acquisition of Ascend, which already had a portfolio of generic products and
established sales channels. It has further acquired two more businesses, which
improved its manufacturing and research abilities.
The Pharmanetwork LLC: This is a holding company of Ascend Laboratories
and was acquired in July 2010. This acquisition has given Alkem a launch pad
to commercialize its products in the United States. Ascend was established in
2003 and had its own generic portfolio and also had relationship with various
sales channels like wholesalers, distributors, food and grocery stores,
pharmaceutical retailers, etc. in the United States.
NORAC Inc: Acquired in December 2012, Norac is engaged in manufacturing
of specialty APIs and providing contract research and manufacturing services
(CRAMs).
Long Pharmaceuticals LLC: Acquired in June-2015 and is engaged in
formulations of semi-solids, liquids and nasals. This acquisition helps Alkem in
diversifying its manufacturing capabilities and also provides it with capacity to
produce formulations in semi-solids, liquid and nasals. The company is
scaling up the manufacturing capacity and R&D capabilities of this facility in
view to file niche ANDAs from there.
Exhibit 14: Alkem growing through acquisitions
Year
Company
Business description
Benefit to Alkem Laboratories
Acquisition helped to set-up a front end to commercialize its
Jul-10
The Pharmanetwork LLC
Portfolio of generic products
products in USA
Dec-12 NORAC Inc
APIs manufacturing and CRAMs Enhancing manufacturing and R&D capabilities
Semi-solids, liquid and nasal
Jun-15 Long Pharmaceuticals LLC
formulation manufacturing
Enhancing manufacturing capabilities
capabilities.
Source: Company, Angel Research
January 3, 2017
7
Initiating coverage | Alkem Laboratories
Well executed inorganic growth: The inorganic growth strategy has been adopted
by many Indian generic companies and Alkem is also travelling on the same path
to grow its US business. With three acquisitions in the US, Alkem now has
capabilities such as CRAMs, API manufacturing, formulations located in USA,
which will give the company scale and capability to launch new products. The
Ascend has given Alkem sales and marketing infrastructure for launching new
products through its sales channels. We believe that the company has well
executed the inorganic strategy so far.
From our interaction with the company, we understand that going ahead it may
look for inorganic growth opportunities, mostly in selected therapeutic segments
such as Oncology. In the pharma space, we have seen generic pharma companies
showing keen interest in oncology assets either by acquiring USFDA approved
oncology manufacturing facilities or increasing R&D efforts to increase pipeline of
oncology ANDAs. In our opinion, Alkem’s plan of possible foray in oncology is
positive in long term and it may further put them on a strong profitability path. An
acquisition at the right valuation in oncology space would be positive for the
company.
ANDA pipeline to gain momentum: In the USA, Alkem has filed total 76 ANDAs,
of which 34 have received final approval. As of March-2016, 30 of these 76
ANDAs are Para IV filings with limited competition, indicating a possible strong
revenue generating opportunity in mid-term. The company generates ~$6million
to $7million revenue from each ANDA.
Alkem expects increase in approval momentum with 2/3rd of its pipeline to get
approved in the next three years. Going ahead, the company expects to monetize
this ANDA pipeline by launching high single digit products (~8-9) in the US.
Assuming a launch of ~7 ANDAs each year going ahead and average revenue of
~$6million per ANDA, we believe that its existing pipeline is expected to generate
more than `850cr of incremental revenue taking its US revenue to ~`1,900cr in
FY2019E from `991cr in FY2016. The company has guided that US revenue
would double in the next three years ($300million by FY2019E), which would lead
to increase in US revenue pie from 6% in FY2012 to ~25% in FY2019E.
Exhibit 15: Alkem's ANDA pipeline
77
76
76
80
70
63
60
31
33
34
49
19
50
39
40
15
31
13
30
11
44
46
43
20
42
34
26
10
20
0
Pending approval
Approved
Source: Company, Angel Research
January 3, 2017
8
Initiating coverage | Alkem Laboratories
Resolve of USFDA issues at Daman, positive for the stock: Alkem’s Daman facility
received 13 observations in Sept-16 USFDA inspection. Daman facility contributes
<30% of the US sales, which works out to be ~5-6% of the total revenue. It also
has 50% of the pending ANDAs filed from this facility hence it is a critical for its
future US business plans.
Daman facility received Establishment Investigation Report (EIR) in December 2016
indicating that the USFDA has cleared the Daman facility. We see this as a positive
development for the company as a major hangover on its US business plans has
gone.
USFDA issues at Ankaleshwar facility not material for US business: Alkem’s
Ankaleshwar facility was audited by USFDA in December-2016 and has issued 3
observations. This is an API facility and there are no ANDAs filed from here. The
contribution of the drug which uses API from this facility is <1% hence there is
almost no impact of this facility on its US revenues, as per company.
Exhibit 16: Alkem - USFDA inspections
Facility
Scope
Inspection year Comment
Baddi
Formulation
2015
Successful completion
California - API Facility
API
2015
Successful completion
St. Louis
Formulation
2015
Successful completion
Mandva
API
2016
Establishment Investigation Reportreceived in March 2016
Daman
Formulation
2016
Establishment Investigation Reportreceived in December 2016
Ankaleshwar
API
2016
Form 483 - 3 observations
Source: Company, Angel Research
Other international business, currently not the focus area: Alkem derives
~7% revenue from four countries i.e. Australia, Chile, Kazakhstan and Philippines.
The company has said that it wants to have greater focus on the US market, which
is more attractive right now. It also does not intend to enter in more countries just
to be present in multiple geographies.
Exhibit 17: Low focus on other international business
500
12.0
10.2
9.2
10.0
400
7.1
7.7
8.0
6.4
300
6.0
200
4.0
100
2.0
144
255
287
244
383
0
0.0
FY2012
FY2013
FY2014
FY2015
FY2016
Intl business ex-US (` cr)
Contribution in total revenues (%)
Source: Company, Angel Research
January 3, 2017
9
Initiating coverage | Alkem Laboratories
Strong headroom for margin expansion: Alkem has been able to improve its
margin over the last few years, due to operating leverage and improving sales of
its brands. Most Indian pharma companies, who are in branded formulations in
India and exports market, have better EBITDA margin than Alkem. These
companies have benefitted due to their early entry in the US markets as well as
monetization of their ANDA pipeline. We believe that Alkem is also on the similar
path.
Exhibit 18: Headroom for margin expansion (Peer group FY16 margins)
35.0
29.8
28.6
30.0
26.1
25.8
25.1
25.0
20.0
19.7
20.0
17.0
15.0
10.0
5.0
0.0
Sun
Lupin
Cadila
Natco Dr Reddys Cipla Glenmark Alkem
Pharma
Health
Pharma
Lab
Source: Company, Angel Research
As Alkem launches more products in the US market, its profitability is likely to go
up. Currently, the company has significantly lower profitability of US business due
to higher R&D expenditure (~20% of US sales). Once it starts monetizing its ANDA
pipeline, profitability is likely go up as operating leverage will come in play. The
R&D expenses are not likely go up in the same proportion which will help to
improve its margins.
In the domestic market, company has already made significant investments to
create infrastructure for growth of its chronic segment. This investment is in terms
of expansion of its sales force which is likely to show strong productivity going
ahead. As chronic segment starts to show strong results, the same will be reflected
in its margin.
Tax rate to go up gradually: Alkem has been able to claim special tax benefits
at some of its manufacturing facilities. Overall, it has seen lower tax rate ranging
from 10% to 19% since FY2011.
Exhibit 19: Tax benefits to
Facility / Unit
Expiry of 100% Tax benefit
Baddi Betalactum
FY17 (30% tax deduction on profit till FY22)
Sikkim Kumrek
FY18
Sikkim Samardung Cephalsporin
FY23
Source: Company, Angel Research
The tax rate however is likely to go up gradually as 100% tax benefits on profit are
gradually ending at two of its facilities in next two years. In order to support
January 3, 2017
10
Initiating coverage | Alkem Laboratories
growing domestic business, Alkem has commenced construction of two new units
at Sikkim, which are also expected to derive tax benefits and so the company’s tax
rate is unlikely to go up drastically.
Exhibit 20: Low tax rate
20.0%
19.0%
15.0%
13.1%
10.7%
10.0%
7.3%
6.4%
5.0%
4.5%
0.0%
-1.2%
-5.0%
Source: Company, Angel Research
Alkem has guided of lower tax rate of 10-11% in FY2017E and the same may rise
going ahead, as it sees partial expiry of its tax benefits in its plants. Considering
this, we have taken tax rate of 17% in FY18E and FY19E.
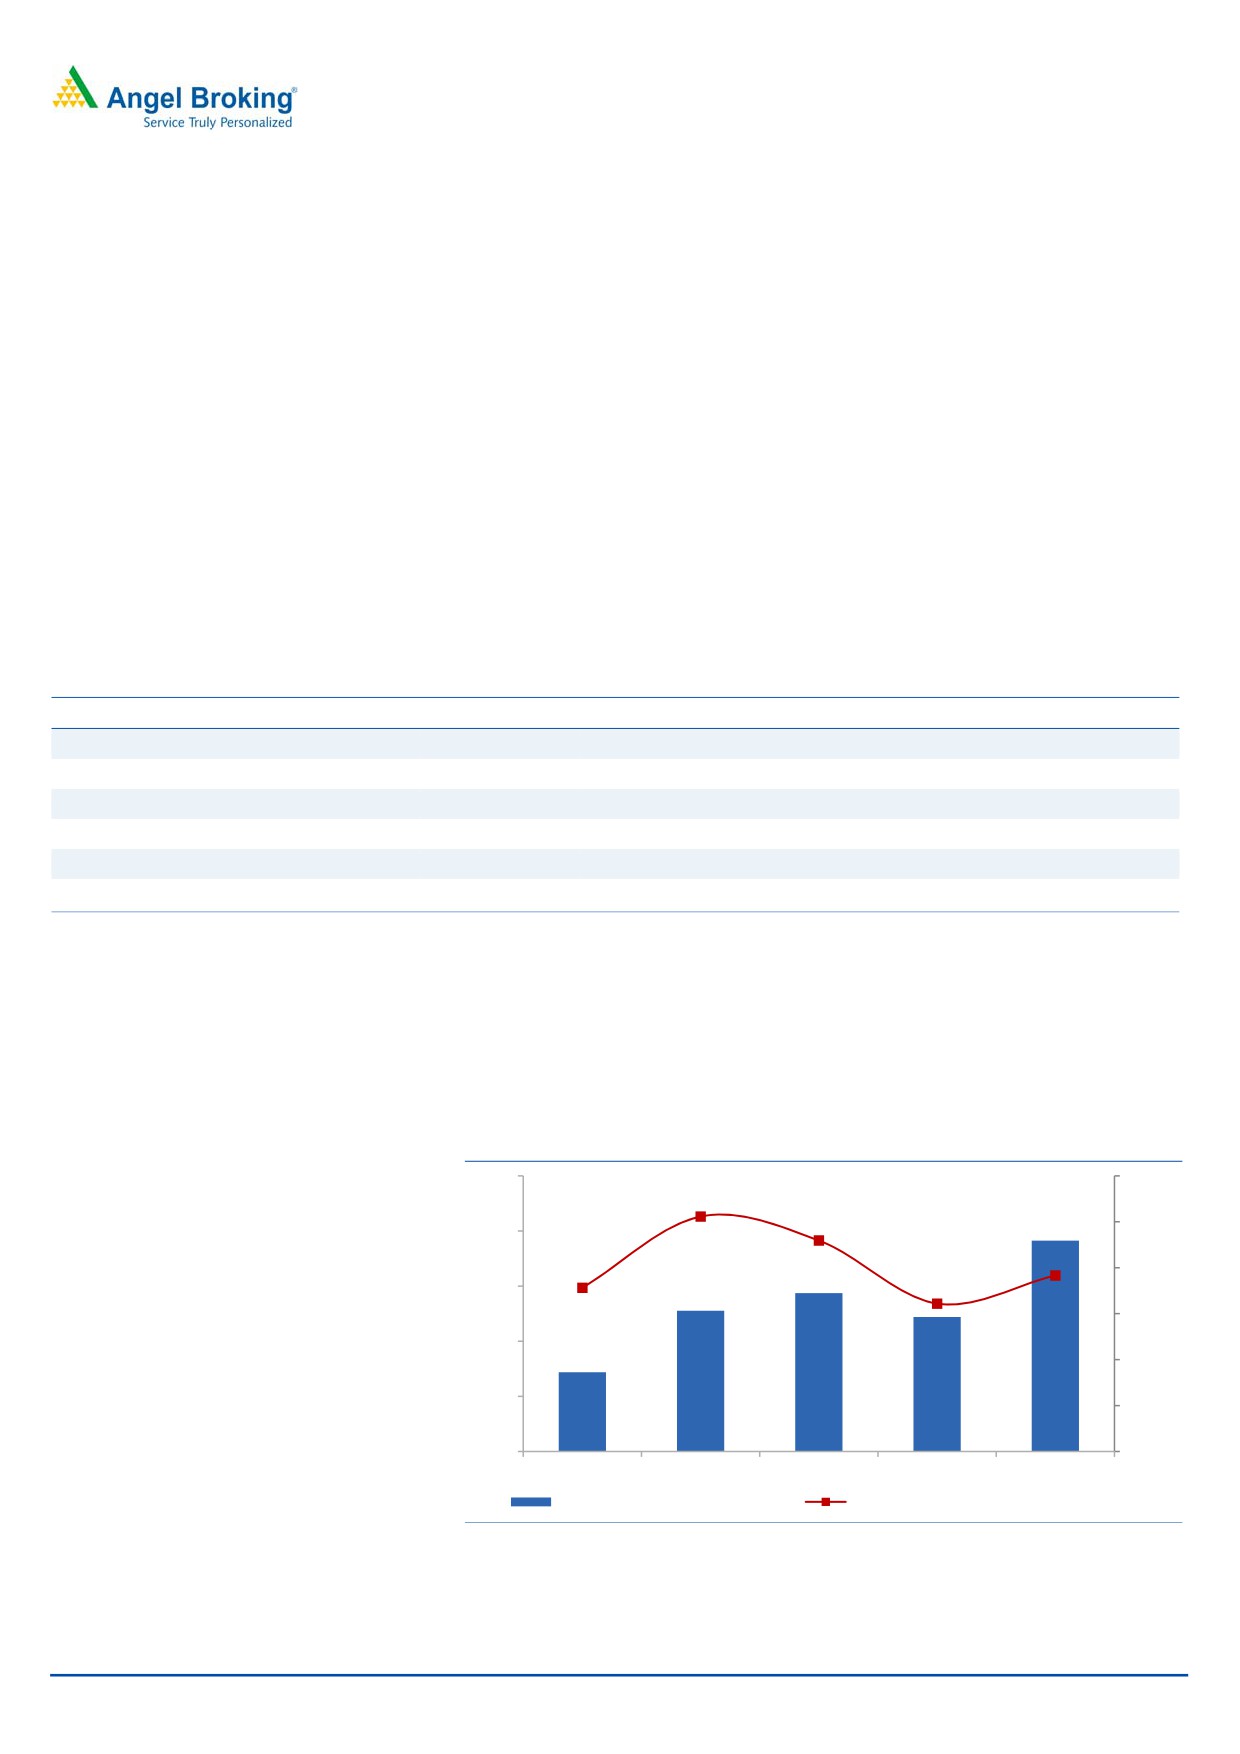
Recent financial performance: In Q2FY2017, the company reported total
revenue of `1638.4cr, showing a growth of 18.6% yoy. India sales grew by 18.4%
yoy due to strong performance in acute segment. The strong performance was
mainly due to the higher prevalence of Chikungunya and Dengue in India, which
helped overall industry, and Alkem specifically due to its leadership in the anti-
infective segment. In the chronic segment too, it did well by reporting higher rates
than industry in some therapeutic segments. Owing to its strong performance,
mainly in acute segment, the company reported market share of 3.82% in the
domestic market vs. 3.6% in FY2015. Exports grew by 19.7% yoy, mainly due to
strong growth in the US market, which grew by healthy 23.9% yoy.
EBITDA margin was at
18.95% vs.
18.31% in Q1FY2017 and
18.5% in
Q2FY2016, showed decent expansion. Net profit for the quarter was at `282.8cr,
showing yoy growth of 17.3%.
Exhibit 21: Quarterly revenue and EBITDA
Exhibit 22: Strong margin profile
1600
25.00
1400
20.00
1200
1000
15.00
800
10.00
600
400
5.00
200
0
0.00
Net sales (`cr)
EBITDA (`cr)
EBITDA margins (%)
Pat margins (%)
Source: Company, Angel Research
Source: Company, Angel Research
January 3, 2017
11
Initiating coverage | Alkem Laboratories
Outlook and Valuation
The stock at the CMP of `1,620 is available at P/E of 15.5x of FY19E EPS of `105,
which is at ~15% discount to average P/E (18.4x) of the peer group. In our view
this discount is unwarranted considering 1) Strong earnings momentum (CAGR of
22.3% in PAT from FY16-FY19E vs. CAGR of 18.3% from FY11-FY16),
2)
Improving RoE (average 21.5% RoE from FY17E-FY19E) and 3) Increasing ANDA
pipeline and near term launches in the US. We rate Alkem ‘Buy’ with a price target
of `1,989 (19.0x of FY19E earnings).
Risks to Our Estimates:
Alkem has received one USFDA observation at its Ankaleshwar API facility and
escalation of this in warning letter would be negative for the company.
Lower productivity of recently expanded sales force, mainly in chronic segment
can impact its plans to gain market share in chronic segment and would be
negative for the company.
Further decline/revision in the drugs included in NLEM may lead to have some
impact on Alkem’s domestic revenue.
Company has indicated of its inorganic growth plans in USA; however an
acquisition at high premium or that of a low margin business will impact its
future return ratios.
January 3, 2017
12
Initiating coverage | Alkem Laboratories
Income statement
Y/E March (` cr)
FY14
FY15
FY16
FY17E
FY18E
FY19E
Total operating income
3,126
3,743
4,992
6,043
6,893
8,114
% chg
25.3
19.7
33.3
21.1
14.1
17.7
Total Expenditure
2,716
3,322
4,143
4,913
5,566
6,544
Cost of Materials
1,386
1,691
1,961
2,363
2,688
3,156
Personnel
532
646
917
1,039
1,155
1,359
Others Expenses
799
985
1,265
1,511
1,723
2,028
EBITDA
410
422
848
1,130
1,327
1,570
% chg
13.1
2.9
101.1
33.2
17.4
18.3
(% of Net Sales)
13.1
11.3
17.0
18.7
19.3
19.4
Depreciation& Amort.
52
71
101
110
130
155
EBIT
358
351
748
1,020
1,197
1,415
% chg
10.9
(1.9)
113.1
36.4
17.3
18.2
(% of Net Sales)
11.4
9.4
15.0
16.9
17.4
17.4
Interest & other Charges
93
81
67
47
47
47
Other Income
165
181
165
120
130
140
(% of PBT)
38.4
40.2
19.5
11.0
10.2
9.3
Share in profit of Ass.
-
-
-
-
-
-
Recurring PBT
430
451
845
1,093
1,280
1,508
% chg
7.1
4.8
87.5
29.4
17.1
17.8
Prior Period & Extra. Exp.
-
-
-
-
-
-
PBT (reported)
430
451
845
1,093
1,280
1,508
Tax
(5)
59
161
120
218
256
(% of PBT)
(1.2)
13.1
19.0
11.0
17.0
17.0
PAT (reported)
435
392
684
973
1,062
1,251
Add: Share of earnings of ass.
-
-
-
-
-
-
Less: Minority interest (MI)
-
-
11
-
-
-
PAT after MI (reported)
435
392
673
973
1,062
1,251
ADJ. PAT
435
392
673
973
1,062
1,251
% chg
13.5
(10.0)
74.8
42.1
9.2
17.8
(% of Net Sales)
13.9
10.5
13.5
16.1
15.4
15.4
Basic EPS (`)
364.0
32.8
56.3
81.4
88.8
104.7
Fully Diluted EPS (`)
364.0
32.8
56.3
81.4
88.8
104.7
% chg
13.5
(10.0)
74.8
42.1
9.2
17.8
January 3, 2017
13
Initiating coverage | Alkem Laboratories
Balance sheet
Y/E March (` cr)
FY14
FY15
FY16
FY17E FY18E FY19E
SOURCES OF FUNDS
Equity Share Capital
12
24
24
24
24
24
Reserves& Surplus
2,567
2,975
3,479
4,257
5,054
5,930
Shareholders’ Funds
2,579
2,999
3,503
4,281
5,078
5,954
Minority Interest
-
86
97
97
97
97
Total Loans
1,184
1,381
739
750
750
750
Deferred Tax Liability
78
126
153
153
153
153
Total Liabilities
3,841
4,591
4,490
5,280
6,077
6,953
APPLICATION OF FUNDS
Gross Block
1,170
1,745
1,889
2,389
2,739
3,089
Less: Acc. Depreciation
-
371
447
557
687
842
Net Block
1,170
1,374
1,442
1,832
2,052
2,247
Capital Work-in-Progress
-
111
172
250
300
300
Investments
588
481
422
422
422
422
Current Assets
2,553
3,325
3,394
3,941
4,640
5,562
Inventories
620
784
909
1,109
1,265
1,489
Sundry Debtors
367
527
565
662
755
889
Cash
206
791
796
670
910
1,172
Loans & Advances
159
175
240
290
331
389
Other Assets
1,201
1,048
884
1,209
1,379
1,623
Current liabilities
509
733
998
1,222
1,395
1,636
Net Current Assets
2,044
2,592
2,396
2,718
3,245
3,926
Deferred Tax Asset
39
34
58
58
58
58
Mis. Exp. not written off
-
-
-
-
-
-
Total Assets
3,841
4,591
4,490
5,280
6,077
6,953
January 3, 2017
14
Initiating coverage | Alkem Laboratories
Cash flow statement
Y/E March (` cr)
FY14
FY15
FY16
FY17E
FY18E
FY19E
Profit before tax
430
451
845
1,093
1,280
1,508
Depreciation
52
71
101
110
130
155
Change in Working Capital
(36)
(12)
14
(448)
(287)
(419)
Interest / Dividend (Net)
(56)
(53)
(59)
47
47
47
Direct taxes paid
(111)
(106)
(198)
(120)
(218)
(256)
Others
11
(26)
24
-
-
-
Cash Flow from Operations
290
325
726
681
952
1,035
(Inc.)/ Dec. in Fixed Assets
353
(235)
189
(578)
(400)
(350)
(Inc.)/ Dec. in Investments
-
-
-
-
-
-
Cash Flow from Investing
353
(235)
189
(578)
(400)
(350)
Issue of Equity
-
-
-
-
-
-
Inc./(Dec.) in loans
(473)
87
(671)
11
-
-
Dividend Paid (Incl. Tax)
(32)
(57)
(185)
(195)
(266)
(375)
Interest / Dividend (Net)
11
569
598
(47)
(47)
(47)
Cash Flow from Financing
(494)
599
(258)
(230)
(313)
(423)
Inc./(Dec.) in Cash
149
690
657
(126)
239
262
Opening Cash balances
57
101
140
796
670
910
Closing Cash balances
206
791
796
670
910
1,172
January 3, 2017
15
Initiating coverage | Alkem Laboratories
Key Ratios
Y/E March
FY14
FY15
FY16
FY17E
FY18E
FY19E
Valuation Ratio (x)
P/E (on FDEPS)
4.5
49.5
28.8
19.9
18.2
15.5
P/CEPS
4.6
4.0
41.9
24.7
17.9
16.2
P/BV
0.8
6.5
5.5
4.5
3.8
3.3
Dividend yield (%)
2.7
1.6
0.3
1.0
1.0
1.4
EV/Sales
6.3
5.2
3.8
3.1
2.7
2.3
EV/EBITDA
48.2
46.2
22.3
16.8
14.2
11.8
EV / Total Assets
4.5
3.7
3.4
2.9
2.5
2.2
Per Share Data (`)
EPS (Basic)
364.0
32.8
56.3
81.4
88.8
104.7
EPS (fully diluted)
364.0
32.8
56.3
81.4
88.8
104.7
Cash EPS
354.0
407.7
38.7
65.7
90.6
99.7
DPS
43.2
26.6
4.7
15.4
16.3
22.2
Book Value
2,156.6
250.9
293.0
358.1
424.7
498.0
Dupont Analysis
EBIT margin
11.4
9.4
15.0
16.9
17.4
17.4
Tax retention ratio
1.0
0.9
0.8
0.9
0.8
0.8
Asset turnover (x)
1.1
1.2
1.7
1.5
1.5
1.6
ROIC (Post-tax)
12.2
9.8
20.0
23.0
22.1
23.0
Cost of Debt (Post Tax)
0.1
0.1
0.1
0.1
0.1
0.1
Leverage (x)
0.2
0.0
(0.1)
(0.1)
(0.1)
(0.1)
Operating ROE
14.0
10.2
17.3
21.2
19.6
19.7
Returns (%)
ROCE
9.5
8.0
17.6
20.3
20.5
21.1
Angel ROIC (Pre-tax)
12.1
11.3
24.7
25.9
26.6
27.7
ROE
16.9
13.1
19.2
22.7
20.9
21.0
Turnover ratios (x)
Asset Turnover (Gross Block)
2.7
2.1
2.6
2.5
2.5
2.6
Inventory / Sales (days)
72
76
67
67
67
67
Receivables (days)
43
51
41
40
40
40
Payables (days)
36
45
42
42
42
42
WC cycle (ex-cash) (days)
80
82
65
65
65
65
January 3, 2017
16
Initiating coverage | Alkem Laboratories
Research Team Tel: 022 - 39357800
DISCLAIMER
Angel Broking Private Limited (hereinafter referred to as “Angel”) is a registered Member of National Stock Exchange of India Limited,
Bombay Stock Exchange Limited and Metropolitan Stock Exchange Limited. It is also registered as a Depository Participant with CDSL
and Portfolio Manager with SEBI. It also has registration with AMFI as a Mutual Fund Distributor. Angel Broking Private Limited is a
registered entity with SEBI for Research Analyst in terms of SEBI (Research Analyst) Regulations, 2014 vide registration number
INH000000164. Angel or its associates has not been debarred/ suspended by SEBI or any other regulatory authority for accessing
/dealing in securities Market. Angel or its associates/analyst has not received any compensation / managed or co-managed public
offering of securities of the company covered by Analyst during the past twelve months.
This document is solely for the personal information of the recipient, and must not be singularly used as the basis of any investment
decision. Nothing in this document should be construed as investment or financial advice. Each recipient of this document should
make such investigations as they deem necessary to arrive at an independent evaluation of an investment in the securities of the
companies referred to in this document (including the merits and risks involved), and should consult their own advisors to determine
the merits and risks of such an investment.
Reports based on technical and derivative analysis center on studying charts of a stock's price movement, outstanding positions and
trading volume, as opposed to focusing on a company's fundamentals and, as such, may not match with a report on a company's
fundamentals. Investors are advised to refer the Fundamental and Technical Research Reports available on our website to evaluate the
contrary view, if any.
The information in this document has been printed on the basis of publicly available information, internal data and other reliable
sources believed to be true, but we do not represent that it is accurate or complete and it should not be relied on as such, as this
document is for general guidance only. Angel Broking Pvt. Limited or any of its affiliates/ group companies shall not be in any way
responsible for any loss or damage that may arise to any person from any inadvertent error in the information contained in this report.
Angel Broking Pvt. Limited has not independently verified all the information contained within this document. Accordingly, we cannot
testify, nor make any representation or warranty, express or implied, to the accuracy, contents or data contained within this document.
While Angel Broking Pvt. Limited endeavors to update on a reasonable basis the information discussed in this material, there may be
regulatory, compliance, or other reasons that prevent us from doing so.
This document is being supplied to you solely for your information, and its contents, information or data may not be reproduced,
redistributed or passed on, directly or indirectly.
Neither Angel Broking Pvt. Limited, nor its directors, employees or affiliates shall be liable for any loss or damage that may arise from
or in connection with the use of this information.
Disclosure of Interest Statement
Alkem Laboratories
1. Financial interest of research analyst or Angel or his Associate or his relative
No
2. Ownership of 1% or more of the stock by research analyst or Angel or associates or relatives
No
3. Served as an officer, director or employee of the company covered under Research
No
4. Broking relationship with company covered under Research
No
Ratings (Based on expected returns
Buy (> 15%)
Accumulate (5% to 15%)
Neutral (-5 to 5%)
over 12 months investment period):
Reduce (-5% to -15%)
Sell (< -15)
January 3, 2017
17