3QFY2016 Result Update | Pharmaceutical
February 2, 2016
Alembic Pharma
NEUTRAL
CMP
`618
Performance Highlights
Target Price
-
Y/E March (` cr)
3QFY2016 2QFY2016
% chg (qoq) 3QFY2015
% chg (yoy)
Investment Period
-
Net Sales
921
1008
(8.6)
507
81.8
Other Income
4
1
262.9
1
266.7
Stock Info
Operating Profit
384
375
2.3
102
276.3
Interest
1
1
42.5
1
42.5
Sector
Pharmaceutical
Net Profit
269
289
(6.7)
71
281.4
Market Cap (` cr)
11,645
Source: Company, Angel Research
Net Debt (` cr)
814
Alembic Pharmaceuticals (Alembic Pharma) posted better-than-expected results
Beta
0.8
for 3QFY2016. It posted an 81.8% yoy growth in sales for the quarter to `921cr
52 Week High / Low
792/382
V/s `507cr in 3QFY2015 (and V/s an expected `700cr). Sales growth was mainly
Avg. Daily Volume
33,825
driven by the international business, which posted a 248% yoy growth, while the
Face Value (`)
2
Indian branded formulation business posted a 15% yoy growth. Consequently, on
BSE Sensex
24,871
the operating front, the EBITDA margin came in at 41.7% V/s 20.1% in
3QFY2015 (and V/s an expected 27.5%). The same was aided by gross margin
Nifty
7,564
expansion, which came in at
77.6% V/s
65.6% in 3QFY2015. The R&D
Reuters Code
ALEM.BO
expenditure during the quarter was 7.6% of sales V/s 6.0% of sales in 3QFY2015.
Bloomberg Code
ALPM@IN
Thus, the PAT came in at `269cr V/s `71cr in 3QFY2015 (and V/s an expected
`160cr), a yoy growth of 281.4%. We maintain our Neutral rating on the stock
considering fuller valuations.
Shareholding Pattern (%)
Promoters
74.1
Results better than expectations: Alembic Pharma posted better-than-expected
MF / Banks / Indian Fls
8.1
results for 3QFY2016. It posted an 81.8% yoy growth in sales for the quarter to
`921cr V/s `507cr in 3QFY2015 (and V/s an expected `700cr). Sales growth was
FII / NRIs / OCBs
4.5
mainly driven by the international business, which posted a 248% yoy growth,
Indian Public / Others
13.3
while the Indian branded formulation business posted a 15% yoy growth.
Consequently, on the operating front, the EBITDA margin came in at 41.7% V/s
20.1% in 3QFY2015 (and V/s an expected 27.5%). The same was aided by gross
Abs. (%)
3m 1yr
3yr
margin expansion, which came in at 77.6% V/s 65.6% in 3QFY2015. The R&D
Sensex
(7.3)
(16.2)
24.4
expenditure during the quarter was 7.6% of sales V/s 6.0% of sales in 3QFY2015.
Alembic Pharma
(9.1)
28.9
708.0
Thus, the PAT came in at `269cr V/s `71cr in 3QFY2015 (and V/s an expected
`160cr), a yoy growth of 281.4%.
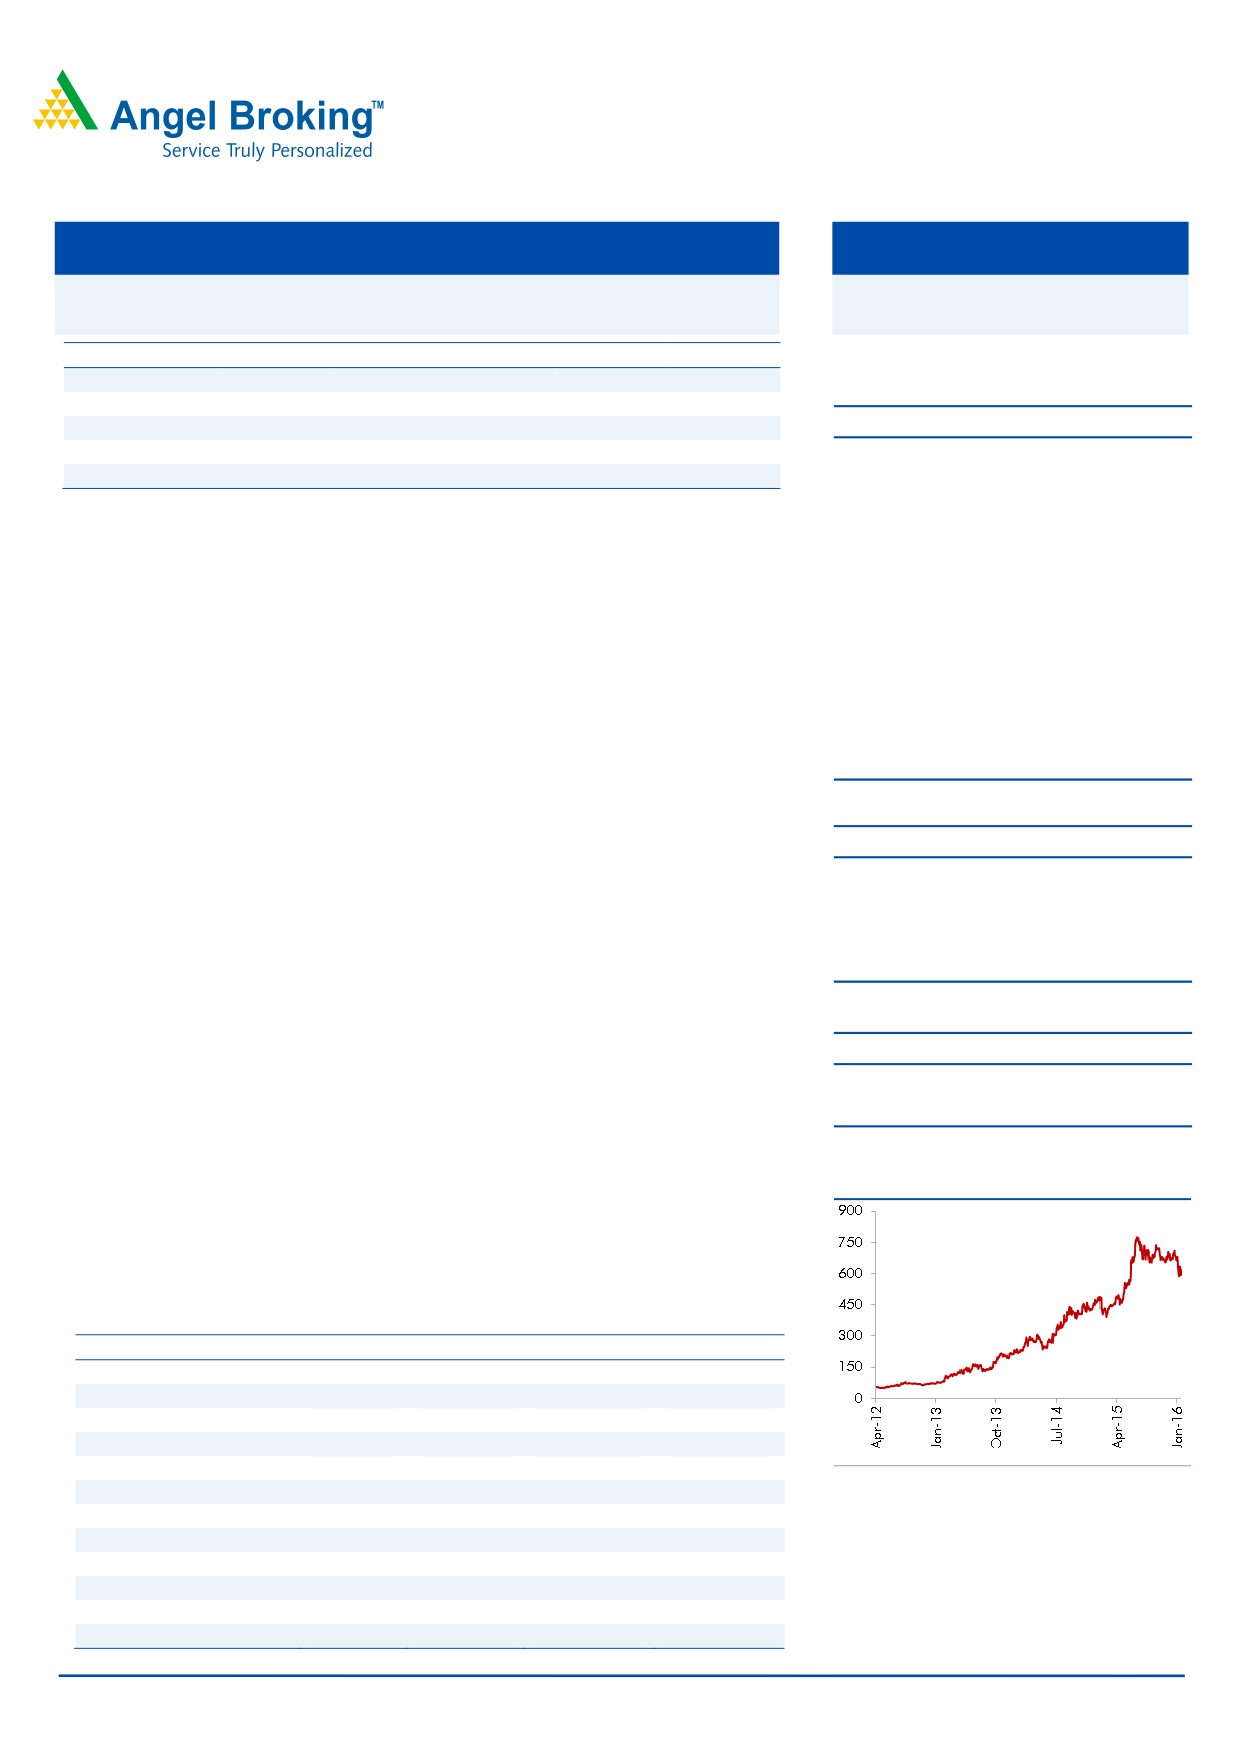
3-year price chart
Outlook and valuation: Alembic Pharma’s growth and profitability profile has
improved post the restructuring carried out by the Management. Over
FY2015-17E, we expect the company to post a CAGR of 36.1% and 38.2% in
sales and net profit, respectively. We recommend a Neutral rating on the stock.
Key Financials (Consolidated)
Y/E March (` cr)
FY2014
FY2015
FY2016E
FY2017E
Net Sales
1,863
2,053
3,274
3,802
% chg
22.9
10.2
59.5
16.1
Net Profit
236
283
660
541
% chg
43.0
20.0
133.0
(18.0)
EPS (`)
12.5
15.0
35.0
28.7
Source: Company, Angel Research
EBITDA Margin (%)
19.2
19.5
26.9
19.4
P/E (x)
49.4
41.1
17.7
21.5
RoE (%)
40.0
36.3
55.6
31.2
RoCE (%)
39.9
30.2
49.3
31.3
P/BV (x)
17.2
13.2
7.8
5.9
Sarabjit Kour Nangra
EV/Sales (x)
6.3
5.7
3.5
3.0
+91- 22- 36357600 - 6806
EV/EBITDA (x)
32.7
29.4
13.0
15.3
Source: Company, Angel Research; Note: CMP as of January 29, 2016
Please refer to important disclosures at the end of this report
1
Alembic Pharma | 3QFY2016 Result Update
Exhibit 1: 3QFY2016 performance (Consolidated)
Y/E March (` cr)
3QFY2016
2QFY2016
% chg(qoq) 3QFY2015
% chg (yoy) 9MFY2016 9MFY2015
% chg (yoy)
Net sales
921
1,008
(8.6)
507
81.8
2,511
1,551
61.9
Other income
4
1
262.9
1
266.7
5
3
82.0
Total income
925
1,009
508
82.1
2,517
1,554
Gross profit
715
782
(8.5)
332
115.1
1866
1010
84.7
Gross margin
77.6
77.5
65.6
74.3
65.1
Operating profit
384
375
2.3
102
276.3
860
303
183.9
Operating margin (%)
41.7
37.2
20.1
34.3
19.5
Interest
1
1
42.5
1
42.5
2
1
138.0
Depreciation
22
13
63.1
12
81.9
48
33
44.9
PBT
365
362
0.7
90
303.7
815
271
200.9
Provision for taxation
95
74
29.3
19
392.1
187
58
223.1
PAT before Extra-ordinary item
269
289
(6.7)
71
281.4
628
213
195.5
Extra-Ordinary Expenses
0
0
0
0
0
PAT after Extra-ordinary item & MI
269
289
(6.7)
71
281.4
628
213
195.5
EPS (`)
14.3
15.3
3.7
33.3
11.3
Source: Company, Angel Research
Exhibit 2: 3QFY2016 - Actual vs Angel estimates
` cr
Actual
Estimates
Variation (%)
Net Sales
921
700
31.6
Other Income
4
1
266.7
Operating Profit
384
191
100.7
Interest
1
1
42.5
Tax
95
19
392.1
Net Profit
269
160
67.8
Source: Company, Angel Research
Sales much above our expectations: The company posted better-than-expected
results for 3QFY2016. It posted an 81.8% yoy growth in sales to `921cr V/s
`507cr in 3QFY2015 and V/s an expected `700cr.
Sales growth was mainly driven by the international business, which posted a
248% yoy growth, while the Indian branded formulation business posted a
15% yoy growth. However the Indian generic business posted a 40% yoy dip in
sales. Overall, formulations accounted for 86% of sales V/s 78% in 3QFY2015.
APIs on the other hand posted a yoy growth of 24%.
In the Indian market, for 9MFY2016, the acute segment constituted ~40% of
domestic sales while the chronic segment accounted for the remaining. The
international generic segment posted growth, mainly on back of gAbilify.
The current ANDA filings are at 74 including 29 pending approvals, of which,
~50% are Para IV and shared exclusivity filings.
February 2, 2016
2
Alembic Pharma | 3QFY2016 Result Update
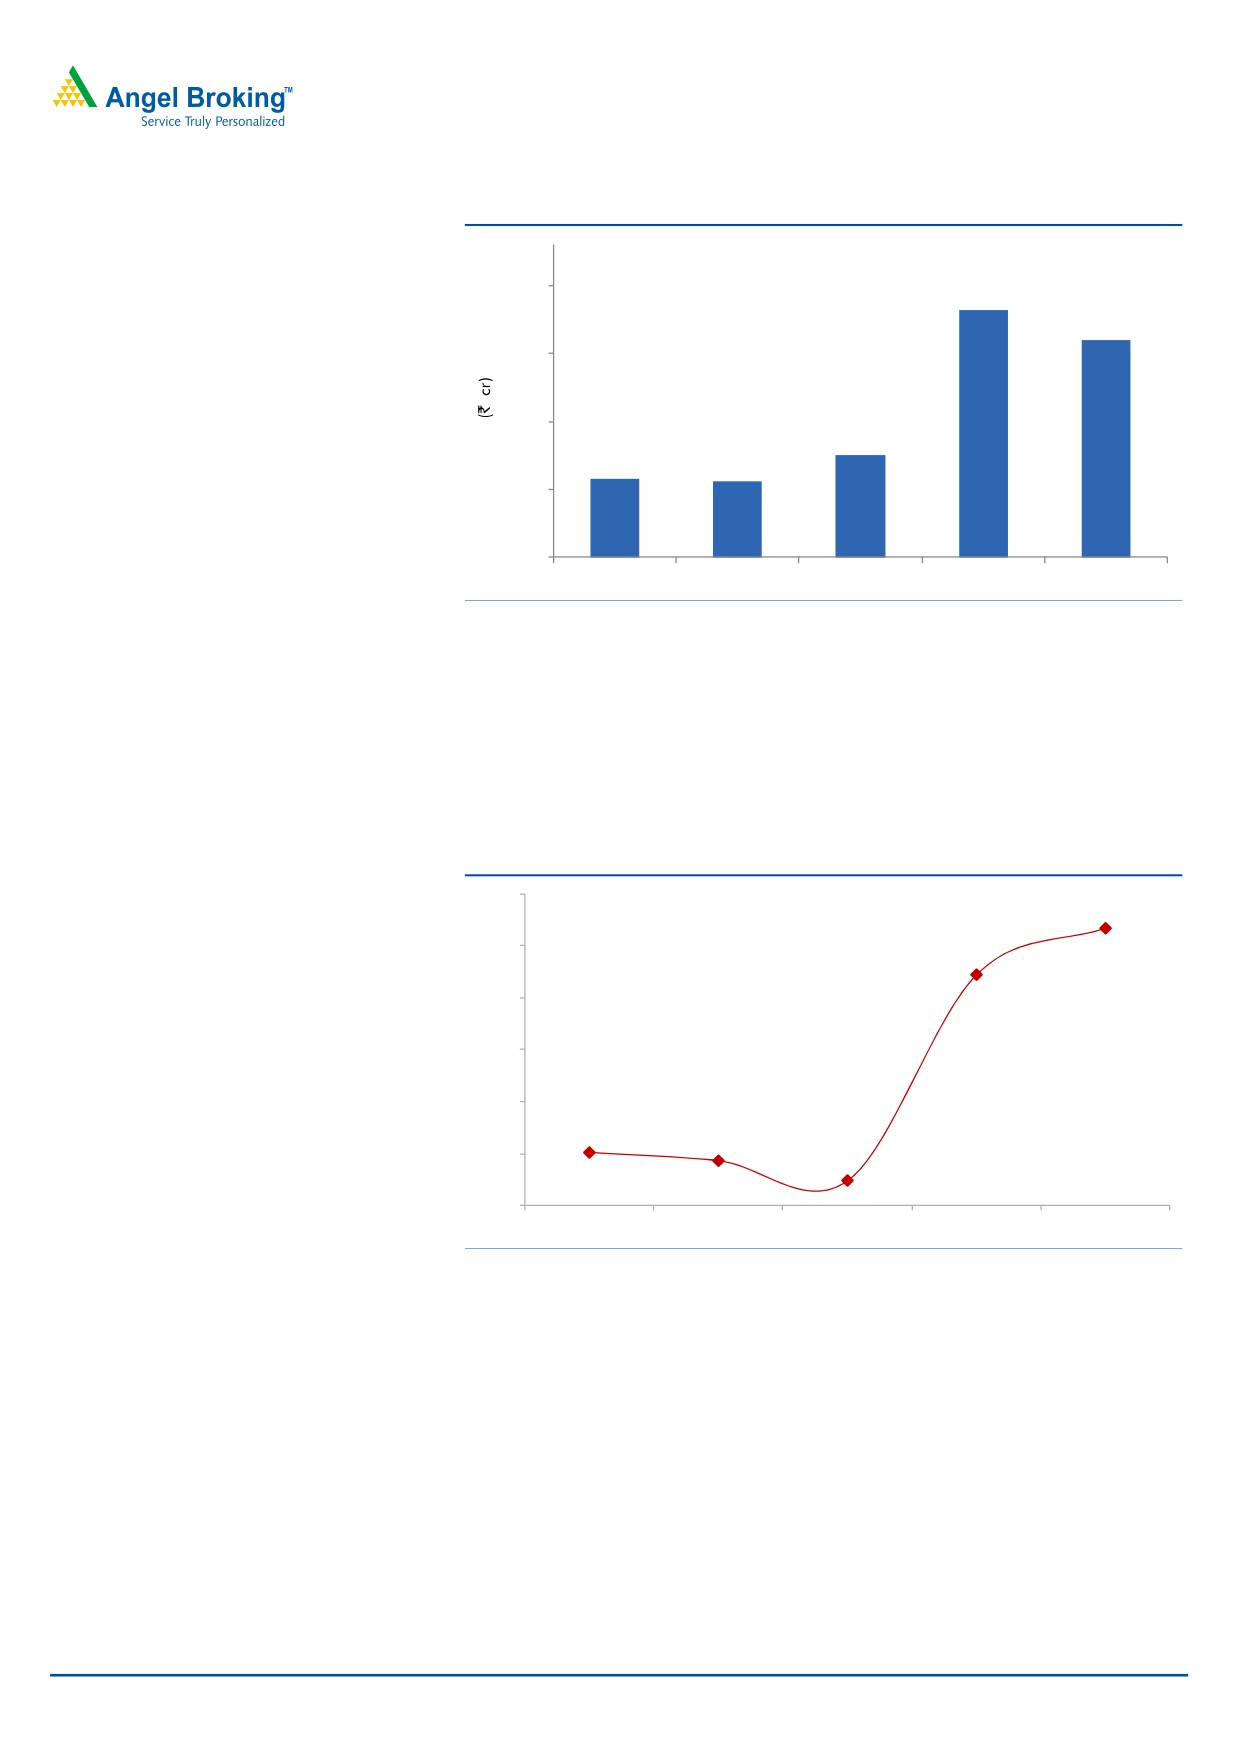
Exhibit 3: Sales trend
1,080
1,008
921
880
680
582
511
502
480
280
3QFY2015
4QFY2015
1QFY2016
2QFY2016
3QFY2016
Source: Company, Angel Research
OPM better than expectation: Consequently, on the operating front, the EBITDA
margin came in at 41.7% V/s 20.1% in 3QFY2015 (V/s 27.5% expected), aided by
gross margins of 77.6% V/s 65.6% in 3QFY2015. The R&D expenditure during the
quarter was 7.6% of sales V/s 6.0% of sales in 3QFY2015. Going ahead, the
Management expects R&D expenses to stabilize at 8% of sales due to increased
complexity of filings.
Exhibit 4: OPM Trend (%)
45.0
41.7
40.0
37.2
35.0
30.0
25.0
20.1
19.3
20.0
17.4
15.0
3QFY2015
4QFY2015
1QFY2016
2QFY2016
3QFY2016
Source: Company, Angel Research
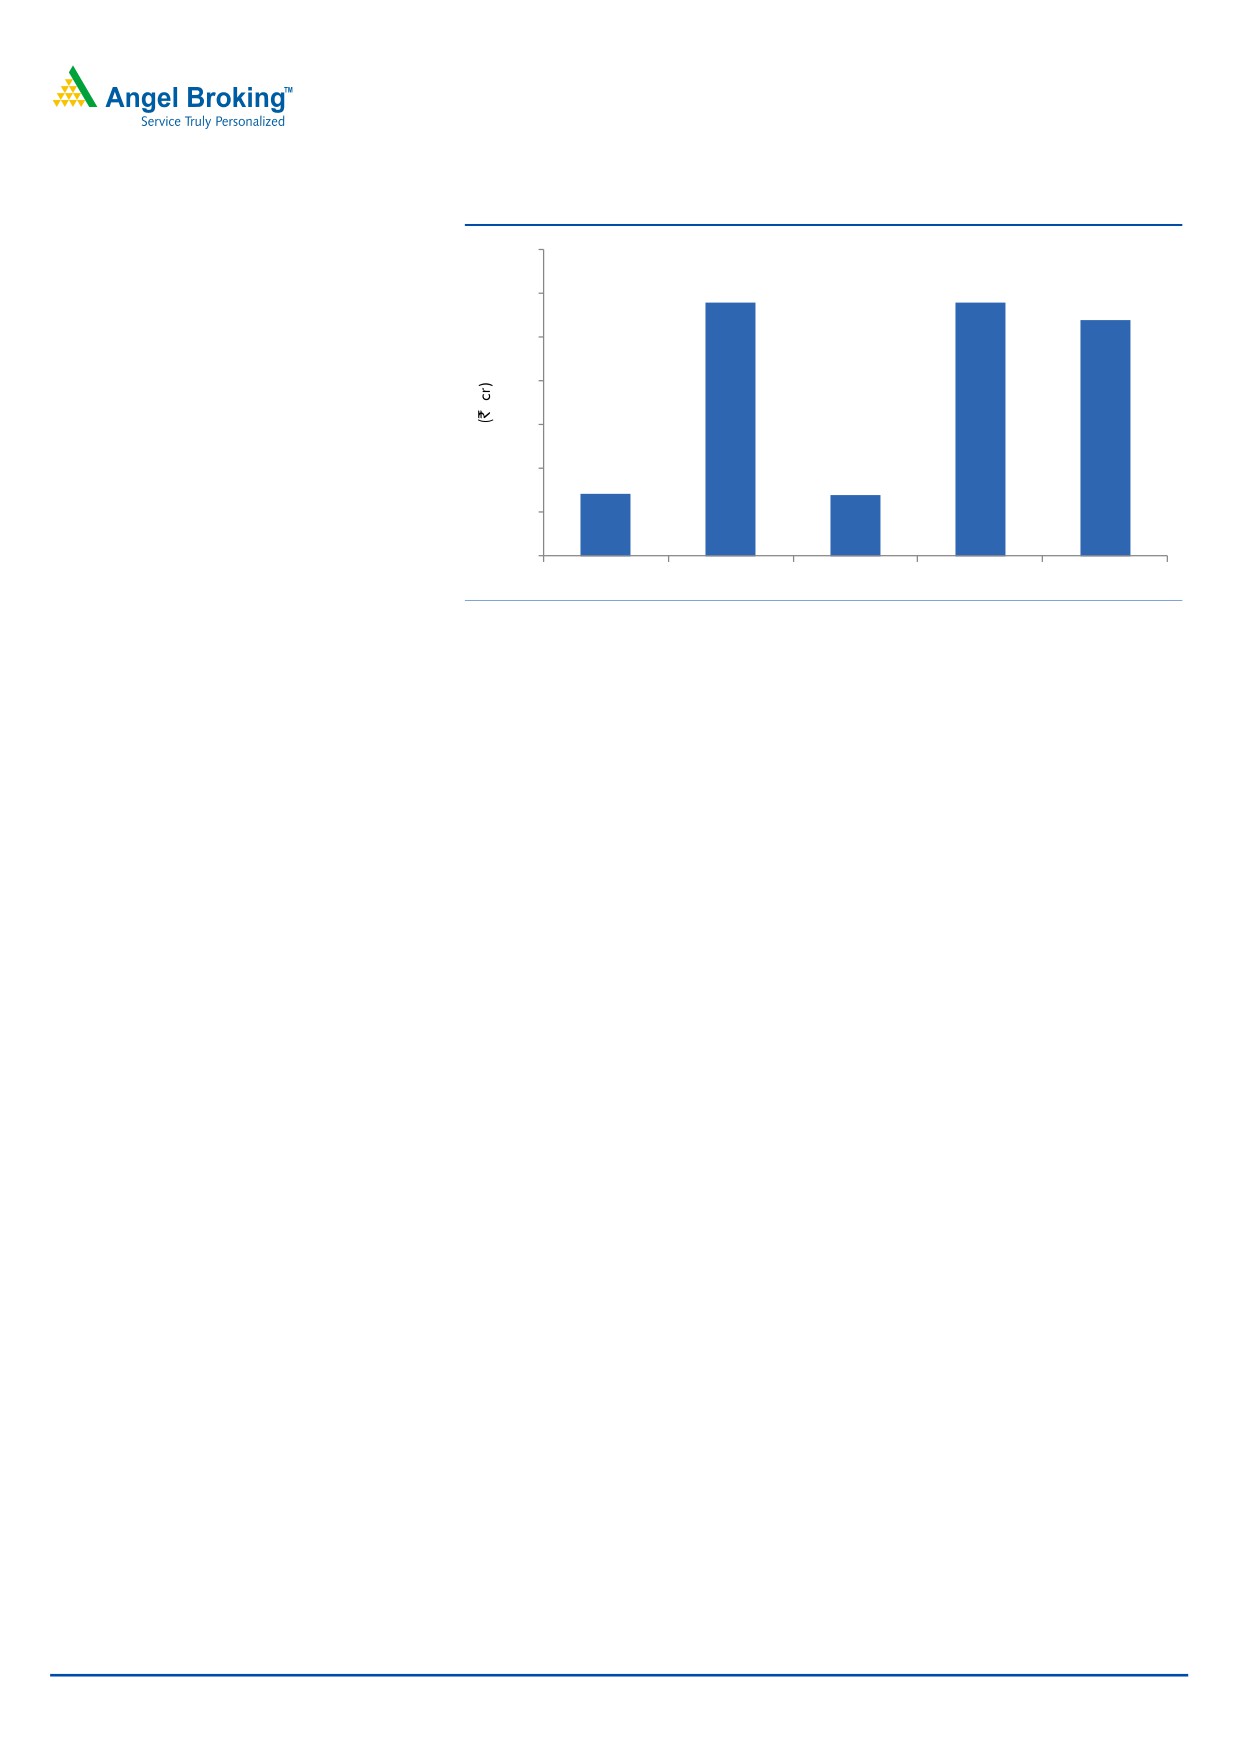
Net profit above expectation: Thus, the PAT came in at `270cr V/s `71cr in
3QFY2015 (and V/s an expected `160cr), a yoy growth of 281%.
February 2, 2016
3
Alembic Pharma | 3QFY2016 Result Update
Exhibit 5: Net profit trend
350
289
289
300
269
250
200
150
71
100
70
50
0
3QFY2015
4QFY2015
1QFY2016
2QFY2016
3QFY2016
Source: Company, Angel Research
Concall highlights
US sales for gAbilify during the quarter pertain to July-September sales as the
amount was received from the partner in 3QFY2016. As per the
Management, the partner has regained lost market share of gAbilify to some
extent during the quarter amid increased competition. Ex-gAbilify also, US
sales registered yoy growth.
USFDA audits were conducted in September and May
2015 for the
formulation and API plants, respectively. The other two API facilities are
expecting USFDA inspections in the near future.
The company has guided for ~8% R&D spend for FY2016. of the total R&D
expenses
80-85% are expected to be spent for generic formulations
(injectables & dermatology).
The company has given a capex guidance of `280-300cr for FY2016, of
which `200cr of capex has already been expended till 3QFY2016.
The company has maintained its guidance of 30-35% base business growth in
international sales.
Investment arguments
Focus on chronic segment to drive domestic formulation growth: Alembic Pharma
has been restructuring its business portfolio, which would aid in improving its
growth and operating performance. The company’s domestic formulation business
contributed 52% to its total sales in FY2015. The company has a strong field force
of ~3,600 medical representatives. Going forward, the company expects its
domestic formulation business to at least grow in line with the industry growth rate,
before it sees an improvement in the share of the high growth chronic segment.
For FY2015-17E, we expect the domestic formulation business to grow at a CAGR
of 13.0%.
Exports- US the key growth driver: On the exports front, the formulation business
contributed 31% to the total turnover, with majority of the contribution coming
from Europe and the US. In the US, the company has filed for ~70 ANDAs till date
February 2, 2016
4
Alembic Pharma | 3QFY2016 Result Update
and received 44 approvals. The company, going forward, expects to keep its
momentum high in terms of number of filings, by filing around 10-12 ANDAs per
annum. For FY2015-17E, we expect exports to register a CAGR of 95.5%.
Outlook and valuation: Alembic Pharma’s growth and profitability profile has
improved post the restructuring carried out by the Management. Over FY2015-17,
we expect the company to post a CAGR of 36.1% and 38.2% in sales and
net profit, respectively. We recommend a Neutral on the stock, owing to fuller
valuations.
Exhibit 6: Key assumptions
FY2016E
FY2017E
Domestic formulation sales growth (%)
10.0
16.0
Exports sales growth (%)
227.0
17.0
R&D as % of sales
8.0
8.0
Operating margins (%)
26.9
19.4
Capex (` cr)
200
200
Net Debt/Equity (x)
(0.0)
(0.2)
Source: Company, Angel Research
Exhibit 7: Recommendation summary
Reco.
CMP Tgt Price Upside
FY2017E
FY15-17E
FY2017E
(`)
(`)
(%) PE (x) EV/Sales (x) EV/EBITDA (x)
CAGR in EPS (%) RoCE (%) RoE (%)
Alembic Pharma
Neutral
618
-
-
21.5
3.0
15.3
38.2
31.3
31.2
Aurobindo Pharma Neutral
833
-
-
19.5
3.1
13.5
15.6
23.5
30.2
Cadila Healthcare
Buy
305
352
15.5
17.3
2.6
11.8
24.6
25.2
29.0
Cipla
Accumulate
586
636
8.6
20.3
2.8
14.5
21.4
17.1
16.8
Dr Reddy's
Buy
3,104
3,933
26.7
17.4
2.6
11.2
17.2
19.1
20.4
Dishman Pharma
Neutral
331
-
-
16.6
1.8
8.2
15.9
9.5
11.2
GSK Pharma*
Neutral
3,224
-
-
47.2
8.2
37.3
6.6
33.7
34.3
Indoco Remedies
Neutral
323
-
-
23.8
2.6
14.1
23.0
19.7
19.7
Ipca labs
Buy
669
900
34.6
23.9
2.4
12.9
17.9
11.8
14.0
Lupin
Neutral
1,710
-
-
25.0
4.3
15.9
13.1
29.6
24.7
Sanofi India*
Neutral
4,242
-
-
28.0
3.6
17.4
33.1
27.9
25.5
Sun Pharma
Accumulate
873
950
8.8
32.5
5.8
18.8
8.4
15.8
16.6
Source: Company, Angel Research; Note: *December year end
Company Background
Alembic Pharma is a leading pharmaceutical company in India. The company is
vertically integrated to develop pharmaceutical substances and intermediates. The
company is a market leader in the Macrolides segment of anti-infective drugs in
India. Its manufacturing facilities are located in Vadodara and in Baddi (Himachal
Pradesh; for the domestic and non-regulated export market). The Panelav facility
houses API and formulation manufacturing plants (both USFDA approved).
February 2, 2016
5
Alembic Pharma | 3QFY2016 Result Update
Profit & Loss Statement (Consolidated)
Y/E March (` cr)
FY2013
FY2014E
FY2015E
FY2016E
FY2017E
Gross sales
1,526
1,871
2,064
3,294
3,825
Less: Excise duty
10
8
11
20
23
Net sales
1,516
1,863
2,053
3,274
3,802
Other operating income
3.1
3.2
5.7
2.0
2.0
Total operating income
1,519
1,866
2,058
3,276
3,804
% chg
4.0
22.8
10.3
59.2
16.1
Total expenditure
1,267
1,506
1,653
2,393
3,066
Net raw materials
681
713
715
1,149
1,483
Other mfg costs
67
82
90
144
167
Personnel
194
247
307
380
472
Other
326
463
542
720
945
EBITDA
249
358
400
881
736
% chg
22.5
43.7
11.7
120.5
(16.5)
(% of Net Sales)
16.4
19.2
19.5
26.9
19.4
Depreciation& amortisation
35
40
44
47
53
Interest & other charges
15
10
2
16
12
Other income
4
0
0
-
-
(% of PBT)
2
0
0
-
-
Share in profit of Associates
-
-
-
-
-
Recurring PBT
206
308
360
819
671
% chg
28.0
49.4
16.8
127.7
(18.0)
Extraordinary expense/(Inc.)
-
-
-
-
-
PBT (reported)
206
308
360
819
671
Tax
41
75
76
159
130
(% of PBT)
19.9
24.4
21.2
19.4
19.4
PAT (reported)
165
236
283
660
541
Add: Share of earnings of asso.
-
-
-
-
-
Less: Minority interest (MI)
-
-
-
-
-
Prior period items
-
-
-
-
-
PAT after MI (reported)
165
236
283
660
541
ADJ. PAT
165
236
283
660
541
% chg
26.7
43.0
20.0
133.0
(18.0)
(% of Net Sales)
10.9
12.7
13.8
20.2
14.2
Basic EPS (`)
8.8
12.5
15.0
35.0
28.7
Fully Diluted EPS (`)
8.8
12.5
15.0
35.0
28.7
% chg
26.7
43.0
20.0
133.0
(18.0)
February 2, 2016
6
Alembic Pharma | 3QFY2016 Result Update
Balance Sheet (Consolidated)
Y/E March (` cr)
FY2013
FY2014
FY2015
FY2016E
FY2017E
SOURCES OF FUNDS
Equity share capital
37.7
37.7
37.7
37.7
37.7
Preference Capital
-
-
-
-
-
Reserves & surplus
465
638
847
1,452
1,939
Shareholders funds
503
676
885
1,490
1,976
Minority Interest
Other Long Term Liabilities
12.8
12.7
15.8
14.3
14.3
Long Term Provisions
6.1
6.7
6.4
7.4
7.4
Total loans
187
78
239
150
150
Deferred tax liability
14
23
31
31
31
Total liabilities
722
795
1,177
1,693
2,179
APPLICATION OF FUNDS
Gross block
572
665
907
1,107
1,307
Less: acc. depreciation
228
268
313
359
412
Net block
344
397
595
748
895
Capital work-in-progress
32
21
35
35
35
Goodwill
Long Term Loans and Adv.
36
42
118
118
118
Investments
3.3
3.4
2.3
3.3
3.3
Current assets
632
755
891
1,673
2,153
Cash
16
24
55
209
454
Loans & advances
116
147
120
426
494
Other
500
584
716
1,038
1,205
Current liabilities
325
422
464
884
1,027
Net current assets
307
333
426
789
1,127
Mis. Exp. not written off
-
-
-
-
-
Total assets
722
795
1,177
1,693
2,179
February 2, 2016
7
Alembic Pharma | 3QFY2016 Result Update
Cash Flow Statement (Consolidated)
Y/E March (` cr)
FY2013
FY2014
FY2015 FY2016E FY2017E
Profit before tax
206
308
360
819
671
Depreciation
35
40
44
47
53
(Inc)/Dec in Working Capital
(78)
(84)
66
(266)
103
Less: Other income
-
-
-
-
-
Direct taxes paid
41
75
76
159
130
Cash Flow from Operations
121
190
393
441
696
(Inc.)/Dec.in Fixed Assets
(84)
(81)
(257)
(200)
(200)
(Inc.)/Dec. in Investments
-
-
-
-
-
Other income
-
-
-
-
-
Cash Flow from Investing
(84)
(81)
(257)
(200)
(200)
Issue of Equity
-
-
-
-
-
Inc./(Dec.) in loans
(165)
(109)
164
(89)
0
Dividend Paid (Incl. Tax)
(55)
(55)
(55)
(55)
(55)
Others
(39)
(34)
184
160
51
Cash Flow from Financing
(259)
(197)
293
16
(4)
Inc./(Dec.) in Cash
(31)
8
31
154
245
Opening Cash balances
47
16
24
55
209
Closing Cash balances
16
24
55
209
454
February 2, 2016
8
Alembic Pharma | 3QFY2016 Result Update
Key Ratios
Y/E March
FY2013
FY2014
FY2015
FY2016E
FY2017E
Valuation Ratio (x)
P/E (on FDEPS)
70.6
49.4
41.1
17.7
21.5
P/CEPS
58.3
42.1
35.6
16.5
19.6
P/BV
23.2
17.2
13.2
7.8
5.9
Dividend yield (%)
0.4
0.4
0.4
0.4
0.4
EV/Sales
7.8
6.3
5.7
3.5
3.0
EV/EBITDA
47.4
32.7
29.4
13.0
15.3
EV / Total Assets
16.3
14.7
10.0
6.8
5.2
Per Share Data (`)
EPS (Basic)
8.8
12.5
15.0
35.0
28.7
EPS (fully diluted)
8.8
12.5
15.0
35.0
28.7
Cash EPS
10.6
14.7
17.4
37.5
31.5
DPS
2.5
2.5
2.5
2.5
2.5
Book Value
26.7
35.8
46.9
79.0
104.8
Dupont Analysis
EBIT margin
14.1
17.0
17.3
25.5
18.0
Tax retention ratio
80.1
75.6
78.8
80.6
80.6
Asset turnover (x)
2.1
2.5
2.2
2.5
2.4
ROIC (Post-tax)
23.9
32.5
29.6
51.6
34.3
Cost of Debt (Post Tax)
4.5
5.6
0.9
6.4
6.4
Leverage (x)
0.6
0.2
0.1
0.1
0.0
Operating ROE
34.8
38.2
33.8
55.4
34.3
Returns (%)
ROCE (Pre-tax)
29.6
39.9
30.2
49.3
31.3
Angel ROIC (Pre-tax)
31.9
44.5
38.7
65.8
43.5
ROE
36.8
40.0
36.3
55.6
31.2
Turnover ratios (x)
Asset Turnover (Gross Block)
2.9
3.0
2.6
3.3
3.2
Inventory / Sales (days)
63.1
56.5
61.5
55.6
71.5
Receivables (days)
51.9
49.5
56.3
51.3
62.6
Payables (days)
72.6
79.8
79.3
41.5
45.9
WC cycle (ex-cash) (days)
78.6
58.6
60.3
53.0
60.1
Solvency ratios (x)
Net debt to equity
0.3
0.1
0.2
(0.0)
(0.2)
Net debt to EBITDA
0.7
0.2
0.5
(0.1)
(0.4)
Interest Coverage (EBIT / Int.)
14.3
32.3
199.5
53.7
56.9
February 2, 2016
9
Alembic Pharma | 3QFY2016 Result Update
Research Team Tel: 022 - 39357800
DISCLAIMER
Angel Broking Private Limited (hereinafter referred to as “Angel”) is a registered Member of National Stock Exchange of India Limited,
Bombay Stock Exchange Limited and Metropolitan Stock Exchange of India Limited. It is also registered as a Depository Participant with
CDSL and Portfolio Manager with SEBI. It also has registration with AMFI as a Mutual Fund Distributor. Angel Broking Private Limited is
a registered entity with SEBI for Research Analyst in terms of SEBI (Research Analyst) Regulations, 2014 vide registration number
INH000000164. Angel or its associates has not been debarred/ suspended by SEBI or any other regulatory authority for accessing
/dealing in securities Market. Angel or its associates including its relatives/analyst do not hold any financial interest/beneficial
ownership of more than 1% in the company covered by Analyst. Angel or its associates/analyst has not received any compensation /
managed or co-managed public offering of securities of the company covered by Analyst during the past twelve months. Angel/analyst
has not served as an officer, director or employee of company covered by Analyst and has not been engaged in market making activity
of the company covered by Analyst.
This document is solely for the personal information of the recipient, and must not be singularly used as the basis of any investment
decision. Nothing in this document should be construed as investment or financial advice. Each recipient of this document should
make such investigations as they deem necessary to arrive at an independent evaluation of an investment in the securities of the
companies referred to in this document (including the merits and risks involved), and should consult their own advisors to determine
the merits and risks of such an investment.
Reports based on technical and derivative analysis center on studying charts of a stock's price movement, outstanding positions and
trading volume, as opposed to focusing on a company's fundamentals and, as such, may not match with a report on a company's
fundamentals.
The information in this document has been printed on the basis of publicly available information, internal data and other reliable
sources believed to be true, but we do not represent that it is accurate or complete and it should not be relied on as such, as this
document is for general guidance only. Angel Broking Pvt. Limited or any of its affiliates/ group companies shall not be in any way
responsible for any loss or damage that may arise to any person from any inadvertent error in the information contained in this report.
Angel Broking Pvt. Limited has not independently verified all the information contained within this document. Accordingly, we cannot
testify, nor make any representation or warranty, express or implied, to the accuracy, contents or data contained within this document.
While Angel Broking Pvt. Limited endeavors to update on a reasonable basis the information discussed in this material, there may be
regulatory, compliance, or other reasons that prevent us from doing so.
This document is being supplied to you solely for your information, and its contents, information or data may not be reproduced,
redistributed or passed on, directly or indirectly.
Neither Angel Broking Pvt. Limited, nor its directors, employees or affiliates shall be liable for any loss or damage that may arise from
or in connection with the use of this information.
Note: Please refer to the important ‘Stock Holding Disclosure' report on the Angel website (Research Section). Also, please refer to the
latest update on respective stocks for the disclosure status in respect of those stocks. Angel Broking Pvt. Limited and its affiliates may
have investment positions in the stocks recommended in this report.
Disclosure of Interest Statement
Alembic Pharma
1. Analyst ownership of the stock
No
2. Angel and its Group companies ownership of the stock
No
3. Angel and its Group companies' Directors ownership of the stock
No
4. Broking relationship with company covered
No
Note: We have not considered any Exposure below ` 1 lakh for Angel, its Group companies and Directors
Ratings (Based on expected returns
Buy (> 15%)
Accumulate (5% to 15%)
Neutral (-5 to 5%)
over 12 months investment period):
Reduce (-5% to -15%)
Sell (< -15)
February 2, 2016
10