3QFY2018 Result Update | IT
January 15, 2018
Tata Consultancy Services (TCS)
REDUCE
CMP
`2,773
Performance highlights
Target Price
`2,493
(` cr)
3QFY18
2QFY18
% chg (qoq) 3QFY17
% chg (yoy)
Investment Period
12 Months
Net revenue
30,904
30,541
1.2
29,735
3.9
Adj. EBITDA
7,065
8,164
(13.5)
8,088
(12.6)
Adj. EBITDA margin (%)
26.8
26.7
8.4bps
27.2
(87.3)bps
Adj. PAT
6,531
6,446
1.3
6,778
(3.6)
Source: Company, Angel Research
Stock Info
TCS posted a
1.0% sequential growth in USD revenues to US$4,787mn v/s
Sector
IT
US$4,801mn expected. In rupee terms, revenues came in at `30,904cr V/s `31,049cr, up
Market Cap (` cr)
530,813
Net Debt (` cr)
(45,288)
1.2% QoQ. In Constant Currency (CC) terms, the company posted a 1.3% QoQ growth
Beta
0.3
with volume growth coming in at 1.6% QoQ (highest growth in three years for the
52 Week High / Low
2,820/2,154
December quarter). On profitability front, EBIT margin showed an upside of ~12bps
Avg. Daily Volum e
42,762
QoQ to 25.2%. Consequently, PAT came in at 6,531cr v/s `6,509cr expected, up of 1.3%
Face Value (`)
1
BSE Sensex
32,507
QoQ. We maintain our Reduce rating on the stock, with a price target of `2,493.
Nifty
110,681
Quarterly highlights: TCS posted a 1.0% sequential growth in USD revenues to
Reuters Code
TCS.BO
Bloomberg Code
TCS@IN
US$4,787mn v/s US$4,801mn expected. In Constant Currency (CC) terms, the
company posted a 1.3% QoQ growth with volume growth coming in at 1.6% QoQ
Shareholding Pattern (%)
(highest growth in since three years for the December quarter). Geography wise, USA
Promoters
73.6
was key driver, with North America & Latin America registering a QoQ CC growth of
MF / Banks / Indian Fls
6.1
1.5% and 5.0% respectively. In Europe, it was Continental Europe registering a QoQ
FII / NRIs / OCBs
16.4
CC growth of 2.6%. In terms of Industries, Retail & CPG registered a QoQ CC growth
Indian Public / Others
4.0
of 6.4%, Energy & Utilities grew 8.5% and Life Sciences & Healthcare posted 2.5%. On
profitability front, EBIT margin showed an upside of ~12bps QoQ to 25.2%.
Abs .(%)
3m
1yr
3yr
Consequently, PAT came in at 6,531cr V/s `6,509cr expected, up 1.3% QoQ.
Sensex
6.0
27.0
25.4
TCS
7.3
18.3
10.4
Outlook and valuation: The Company has been cautiously optimistic regarding its
outlook for FY2018, with key verticals like BFSI and Hi-Tech expected to post a
recovery. During 3QFY2018, it signed a multiyear Digital contract, the highest value
digital contract for the company so far. We expect TCS to post revenue CAGR of 9.3%
and 7.6% in USD & INR terms respectively over FY2017-19E. Hence, we maintain our
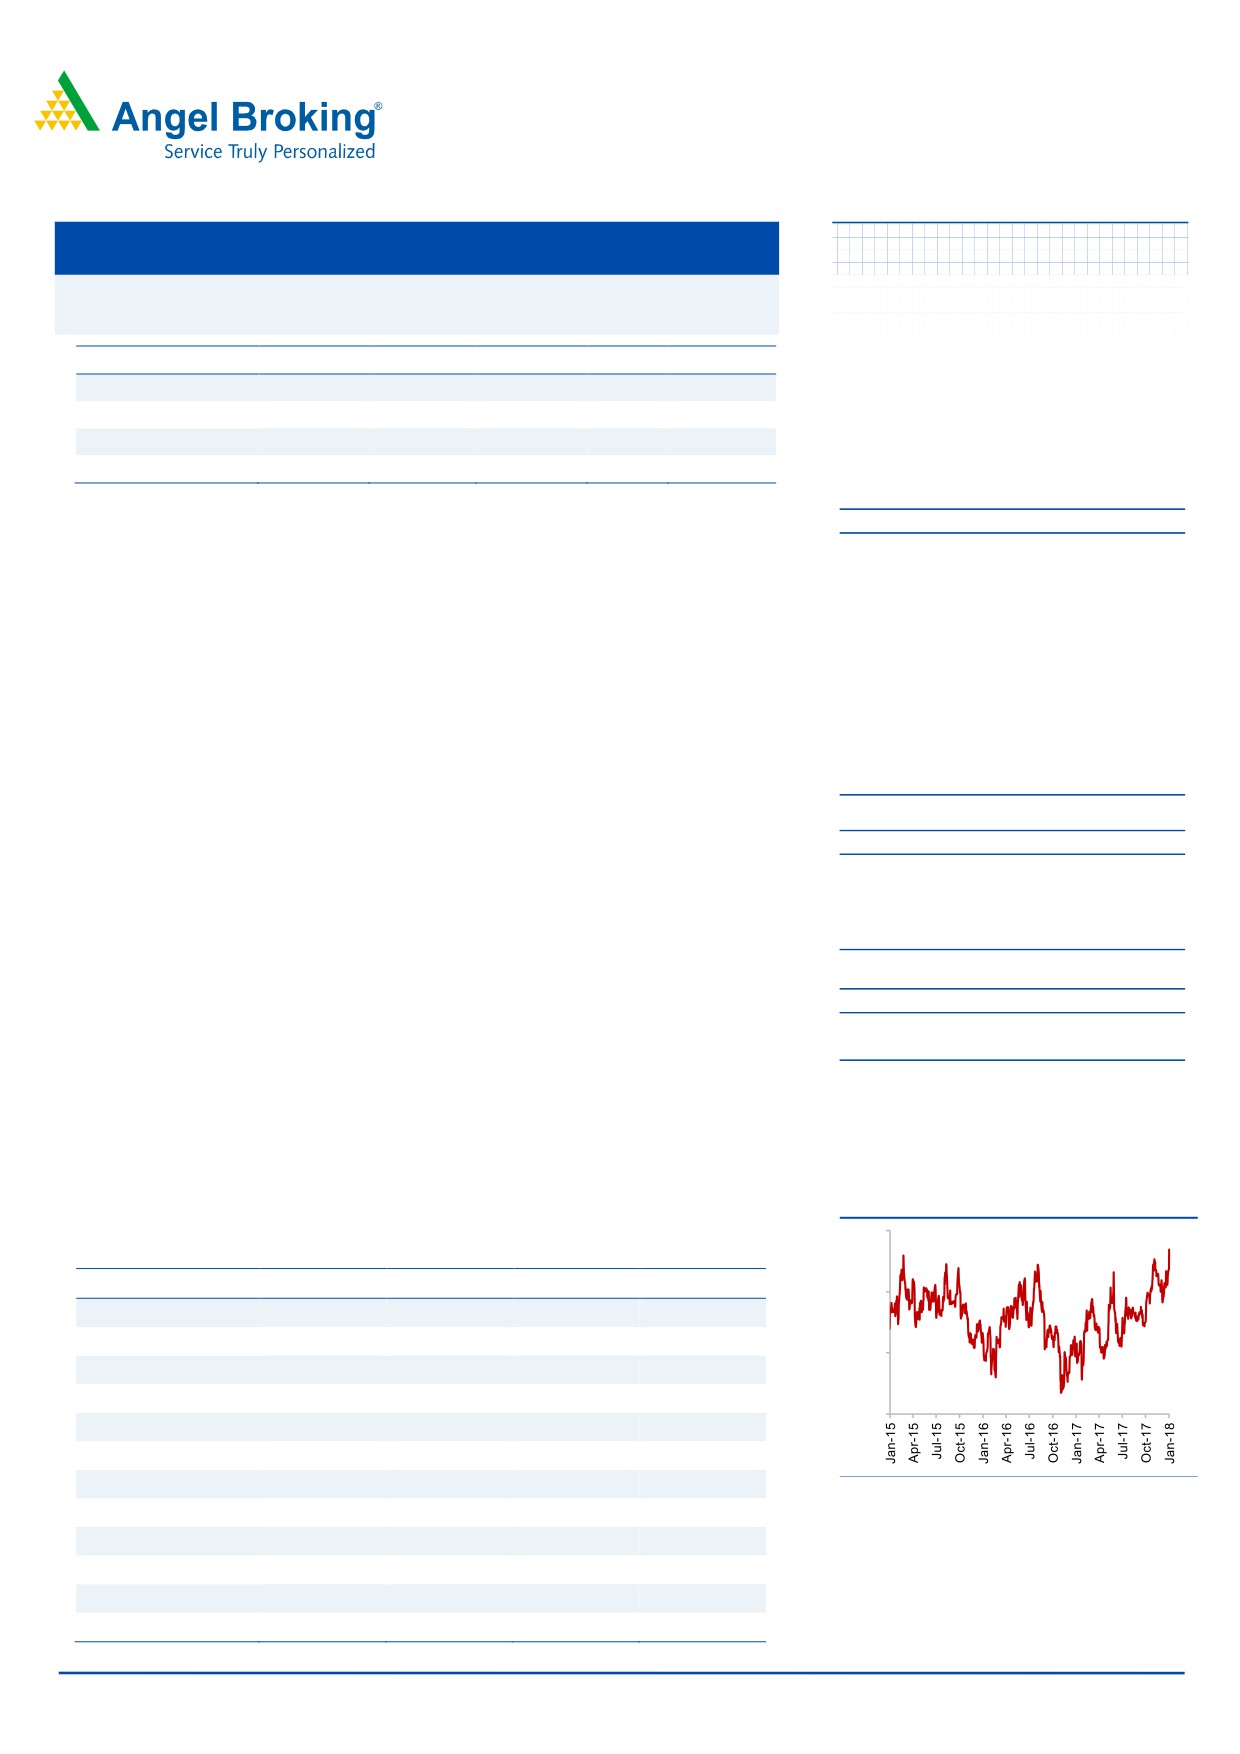
3-Year Daily Price Chart
Reduce recommendation.
2,900
Key financials (Consolidated, IFRS)
Y/E March (` cr)
FY2016
FY2017
FY2018E
FY2019E
2,600
Net sales
108,646
117,966
123,384
136,504
% chg
14.8
8.6
4.6
10.6
2,300
Net profit
24,215
26,289
26,346
28,700
% chg
11.6
8.6
0.2
8.9
2,000
EBITDA margin (%)
28.3
27.5
26.4
26.3
EPS (`)
123.7
134.3
134.6
146.6
P/E (x)
22.4
20.6
20.6
18.9
Source: Company, Angel Research
P/BV (x)
7.4
6.1
5.7
5.3
RoE (%)
33.1
29.8
27.8
28.3
RoCE (%)
31.6
28.8
27.0
27.6
Sarabjit kour Nangra
EV/Sales (x)
4.6
4.1
4.0
3.5
+91 22 3935 7800 Ext: 6806
EV/EBITDA (x)
16.3
15.0
15.0
13.4
sarabjit @angelbroking.com
Source: Company, Angel Research; Note: CMP as of January 12, 2018
Please refer to important disclosures at the end of this report
1
TCS | 3QFY2018 Result Update
Exhibit 1: 3QFY2018 performance (Consolidated, IFRS)
(` cr)
3QFY2018
2QFY2018
% chg (qoq)
3QFY2017
% chg (yoy) 9MFY2018 9MFY2017
% chg(yoy)
Net revenue
30,904
30,541
1.2
29,735
3.9
91,029
88,324
3.1
Cost of revenue
17,356
16,572
4.7
16,378
6.0
51,255
48,732
5.2
Gross profit
13,548
13,969
(3.0)
13,357
1.4
39,774
39,592
0.5
SG&A expense
5,261
5,805
(9.4)
5,124
2.7
15,910
15,413
3.2
EBITDA
8,287
8,164
1.5
8,233
0.7
23,864
24,179
(1.3)
Dep. and Amortization
506
504
0.4
500
1.2
1,509
1,482
1.8
EBIT
7,781
7,660
1.6
7,733
0.6
22,355
22,697
(1.5)
Other income
864
812
6.4
1,185
(27.1)
2,608
3,200
(18.5)
PBT
8,645
8,472
2.0
8,918
(3.1)
24,963
25,897
(3.6)
Income tax
2,100
2,012
4.4
2,104
(0.2)
6,008
6,162
(2.5)
PAT
6,545
6,460
1.3
6,814
(3.9)
18,955
19,735
(4.0)
Earnings in affiliates
-
-
-
-
-
-
-
Minority interest
14
14
36
-
33
54
Reported PAT
6,531
6,446
1.3
6,778
(3.6)
18,922
19,681
(3.9)
Adj. PAT
6,531
6,446
1.3
6,778
(3.6)
18,922
19,681
(3.9)
EPS
34.1
33.7
1.3
34.4
(0.8)
96.6
100.5
(3.9)
Gross margin (%)
43.8
45.7
(190)bps
44.9
(108)bps
43.7
44.8
(113)bps
EBITDA margin (%)
26.8
26.7
8bps
27.7
(87)bps
26.2
27.4
(116)bps
EBIT margin (%)
25.2
25.1
12bps
26.0
(81)bps
24.6
25.7
(114)bps
Source: Company, Angel Research
Exhibit 2: Actual v/s Angel estimates
(` cr)
Actual
Estimate
Var. (%)
Net revenue
30,904
31,049
(0.5)
EBIT margin (%)
25.2
24.9
30
Adj. PAT
6,531
6,509
0.3
Source: Company, Angel Research
Numbers lower than expectations
TCS posted a 1.0% sequential growth in USD revenues to US$4,787mn v/s US$4,801mn
expected. In rupee terms, revenues came in at `30,904cr V/s `31,049cr, up 1.2% qoq. In
Constant Currency (CC) terms, the company posted a 1.3% qoq growth with volume
growth coming in at 1.6% qoq growth (highest growth in three years for the December
quarter). Geography wise, USA was key driver, with North America & Latin America
registering a qoq CC growth of 1.5% and 5.0% respectively. In Europe, it was Continental
Europe registering a qoq CC growth of 2.6%. In terms of Industries, Retail & CPG
registered a qoq CC growth of 6.4%, Energy & Utilities grew 8.5% and Life Sciences &
Healthcare posted 2.5%.
In terms of verticals, on CC basis, the growth registered by the company in respective
segments was mixed with BFSI down marginally (1.5% qoq), Energy Utilities (8.5% qoq)
and Retail & CPG (6.4% qoq) up significantly, and remaining segments performing well
including Communication & Media (2.2% qoq), Manufacturing (2.1% qoq), Life Sciences
& Healthcare (2.5% qoq), and Travel & Hospitality (0.1% qoq).
In terms of geography, on CC basis, qoq growth was North America (1.5%), Latin
America (5.0%), UK (0.8%), Continental Europe (2.6%), India (0.5%), Asia Pacific (0.0%),
MEA (-0.2%).
January 15, 2018
2
TCS | 3QFY2018 Result Update
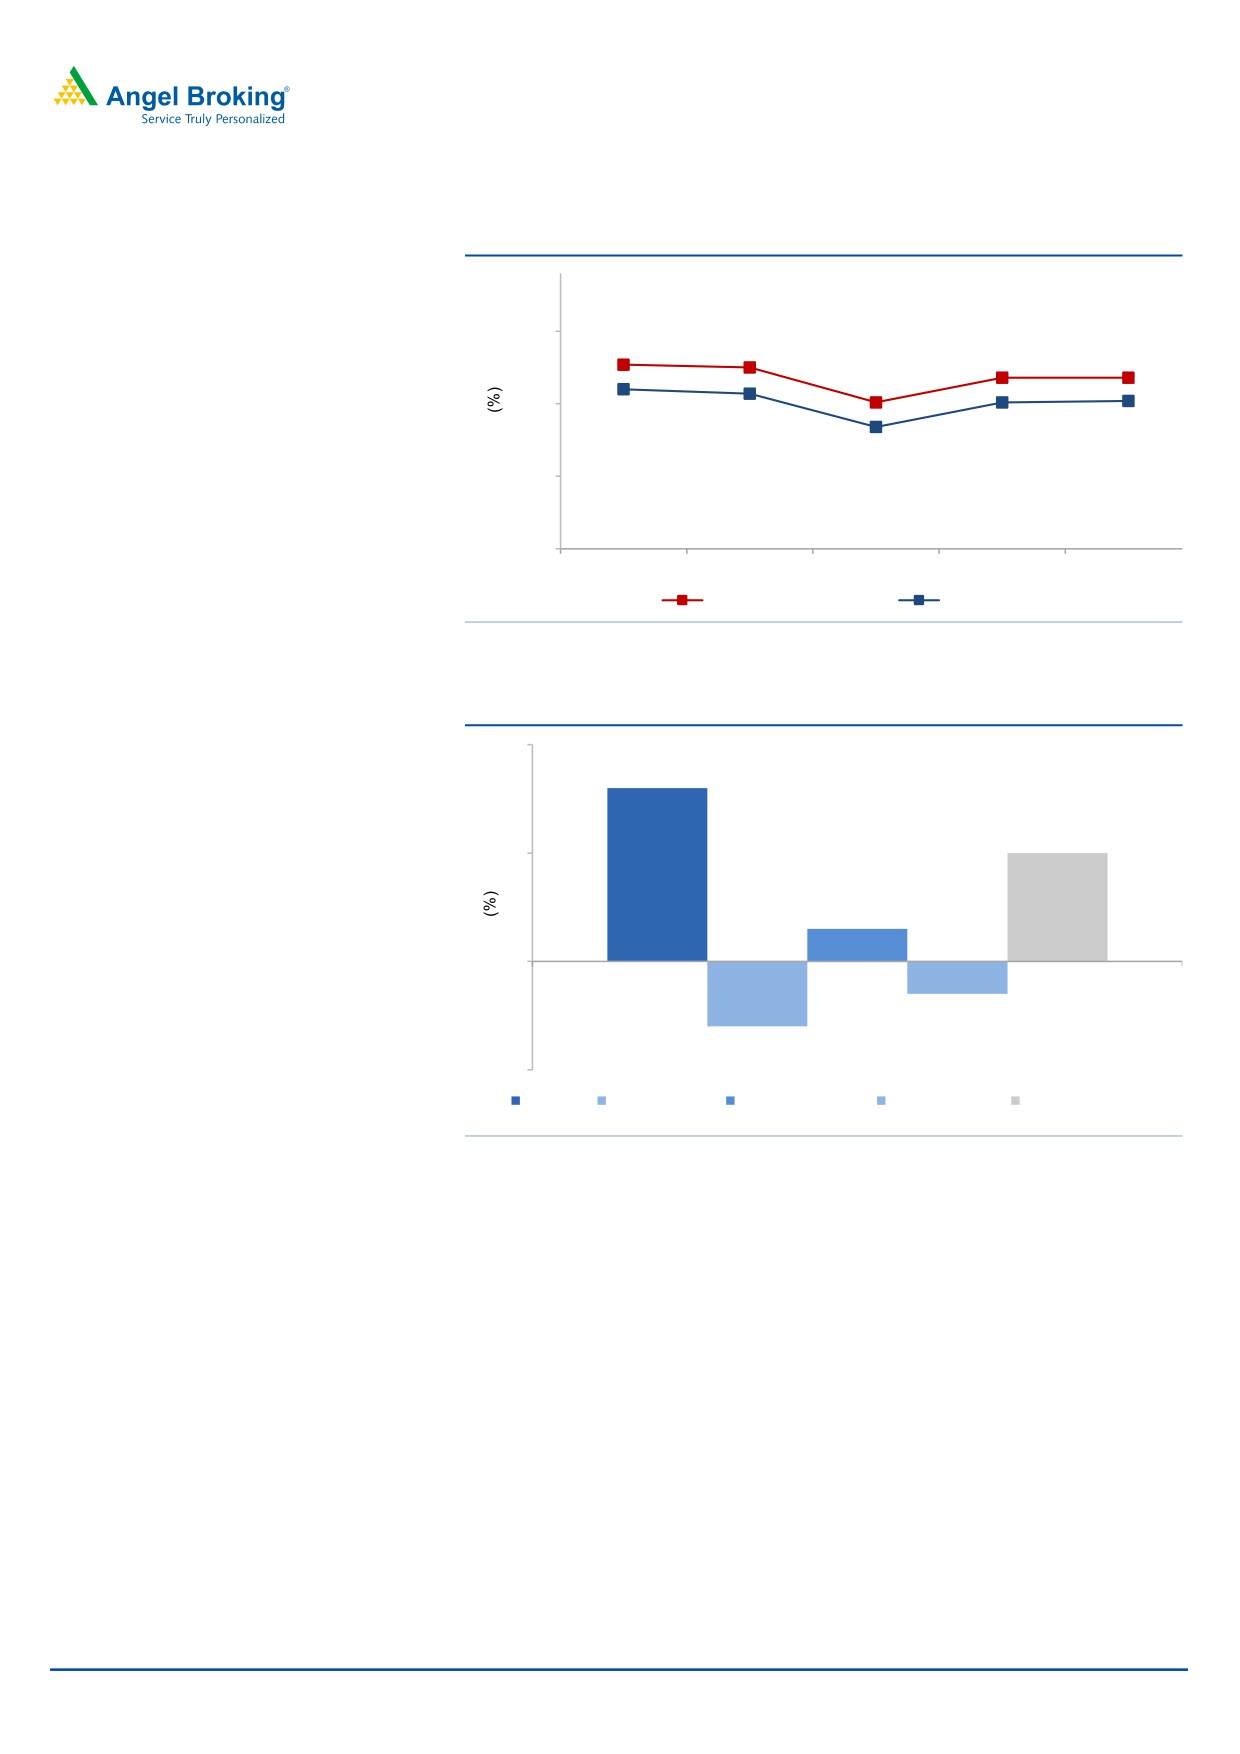
Exhibit 3: Trend in volume and revenue growth (QoQ)
30
27.7
27.5
26.8
26.8
25.1
25
26.0
25.7
25.1
25.2
23.4
20
15
3QFY17
4QFY17
1QFY18
2QFY18
3QFY18
EBITDA margin
EBIT margin
Source: Company, Angel Research
Exhibit 4: Revenue drivers for 3QFY2018
2
1.6
1.0
1
0.3
0
(0.3)
(0.6)
(1)
Volume Offshore shift
Currency impact
CC realization
Total revenue growth
Source: Company, Angel Research
BFSI in 3QFY2018 saw a decline of 1.5% qoq, led by softened demand trends. Retail,
which has been a troubled area in recent quarters, saw a decline in 2QFY2018 when it
bottomed out. In 3QFY2018, the vertical grew by 6.4% qoq CC staging a comeback.
Digital, now 22.1% of total revenues continued exhibiting strength having grown by
13.9% qoq CC. TCS won a US$50mn+ deal in digital this quarter.
January 15, 2018
3
TCS | 3QFY2018 Result Update
Exhibit 5: Revenue growth (Industry wise on CC basis)
% to revenue
% chg (CC qoq)
% chg (yoy)
BFSI
32.1
(1.5)
0.2
Manufacturing
7.6
2.1
9.5
Communication & Media
7.4
2.2
16.5
Life sciences and healthcare
7.3
2.5
13.5
Retail and CPG
12.5
6.4
3.0
Transportation & Hospitality
3.8
2.9
24.1
Energy and utilities
4.5
8.5
29.4
Technology & Services
8.0
0.1
9.6
Regional Markets & Others
16.8
0.5
2.2
Source: Company, Angel Research
Geography wise, qoq growth in INR sales in key geographies on CC basis was as follows:
USA (1.5%), Latin America (5.0%), UK (0.8%), India (0.5%), and MEA (-0.2%). However,
Continental Europe and Asia Pacific posted qoq growth of 2.6% and 0.0% on CC basis
respectively.
Exhibit 6: Revenue growth (Geography wise in INR terms)
% of revenue
% chg (CC qoq)
% chg (yoy)
U.S.
52.0
1.5
2.8
Latin America
2.2
5.0
5.4
U.K.
14.1
0.8
8.2
Continental Europe
13.5
2.6
22.3
India
6.3
0.5
4.1
Asia Pacific
9.5
0.0
6.2
MEA
2.4
(0.2)
3.7
Source: Company, Angel Research
Attrition rate expands
In 3QFY2018, TCS witnessed a gross addition of 12,534 employees and net addition of
1,667 employees, taking its total employee base to 3,90,880. During the quarter, the
attrition rate (last twelve-month [LTM] basis) for the company increased to 11.9% from
11.3% in 2QFY2018.
Exhibit 7: Hiring and attrition trend
Particulars
3QFY17 4QFY17
1QFY18
2QFY18
3QFY18
Gross addition
18,362
20,093
11,202
15,868
12,534
Net addition
6,978
8,726
(1,414)
3,404
1,667
Total employee base
3,78,497
3,87,223
3,85,809
3,89,213
3,90,880
Attrition (%) - LTM basis
12.2
11.5
12.4
11.3
11.9
Source: Company, Angel Research
January 15, 2018
4
TCS | 3QFY2018 Result Update
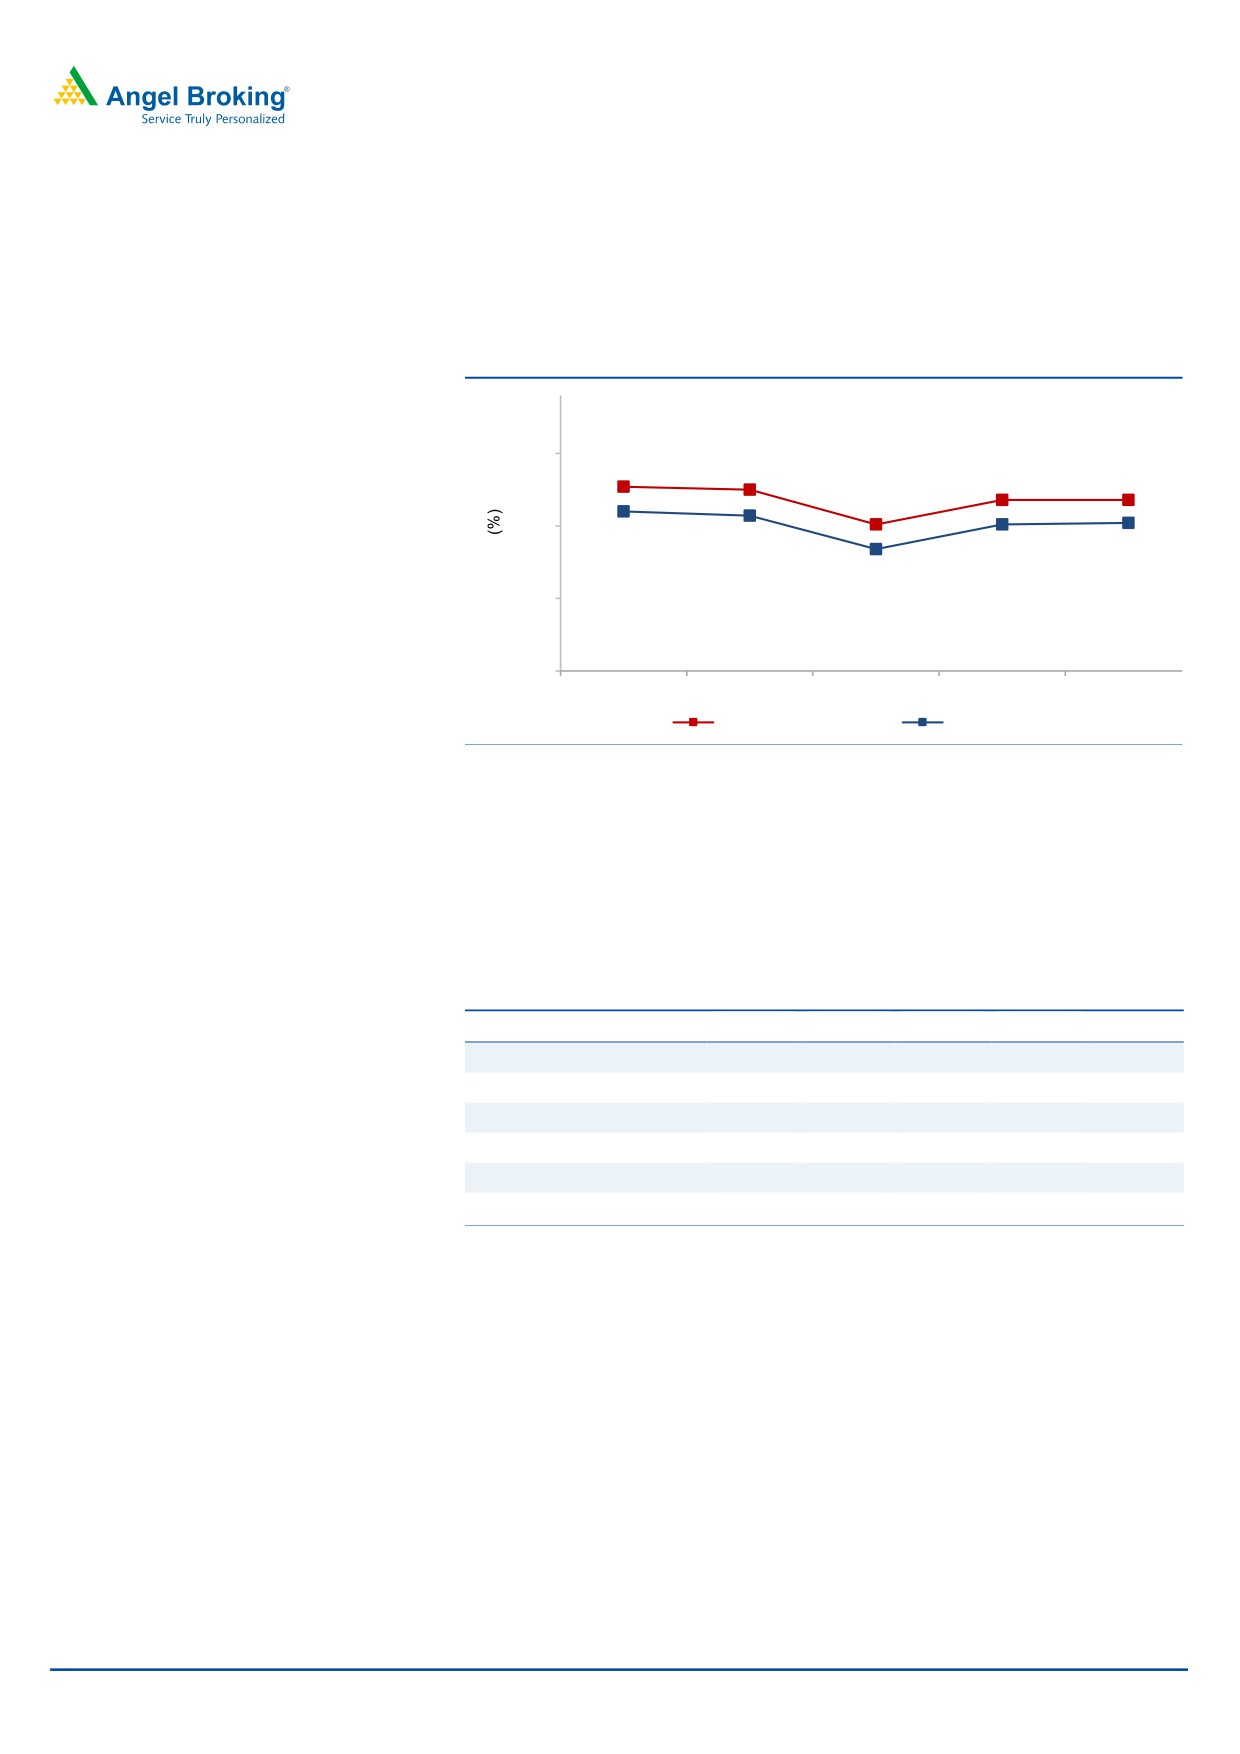
Margin expands
On the operating front, the company reported EBITDA and EBIT margins at 26.8%
and 25.2%, i.e. an expansion of 5ps and 6bps qoq respectively. The company has
maintained an EBIT margin Target of 26-28%.
Exhibit 8: Adj. Margin profile
30
27.7
27.5
26.8
26.8
25.1
25
26.0
25.7
25.1
25.2
23.4
20
15
3QFY17
4QFY17
1QFY18
2QFY18
3QFY18
EBITDA margin
EBIT margin
Source: Company, Angel Research
Client metrics
The client pyramid during the quarter witnessed a qualitative improvement with
client additions seen in the higher revenue brackets. The clients in US$20mn+
revenue band increased by 7 and in US$50mn+ revenue band increased by 3.
Exhibit 9: Client pyramid
3QFY17 4QFY17 1QFY18 2QFY18 3QFY18
US$1mn-5mn
426
438
441
463
456
US$5mn-10mn
154
149
142
142
148
US$10mn-20mn
114
120
132
132
134
US$20mn-50mn
106
106
105
105
109
US$50mn-100mn
46
49
49
54
57
US$100mn plus
34
35
36
37
37
Source: Company, Angel Research
January 15, 2018
5
TCS | 3QFY2018 Result Update
Investment Argument
Guidance - Stability visible: While management has not given any guidance for
FY2018, it expects its key verticals like BFSI, Communications and Hi-Tech to
stabilize as we move forward. Digital also continues to see good traction,
constituting 22.1% of total revenue, and having grown by 13.9% qoq CC and 39.6%
yoy. Overall, the volume growth has been robust according to us for the 1HFY2018,
in spite of the challenges. On EBIT front, the company expects to manage its
margins in 26-28% range over medium term. For FY2018, we have estimated the
EBIT margins of 24.5% V/s 24.6% in 9MFY2018. On sales front, we expect the
company to post a US$ revenue CAGR of 9.3% over FY2017-19E.
Management Rejig: With Mr. Natarajan Chandrasekaran being the Chairman of
Tata Sons since February 21, 2017, CFO Mr. Rajesh Gopinathan has taken charge as
the CEO of the company. He started his professional career with TCS in 2001 and
was appointed as the CFO in February 2013. TCS also announced N G Subramanian
as the COO of the company. Thus, the new targets under the new CEO will have a
bearing on the performance of the company.
Outlook and valuation
Over FY2017-19E, we expect TCS to post revenue CAGR of 9.3% and 7.6% in
USD and INR terms, respectively. The company highlighted that it stands
comfortable in sustaining the EBIT margin in the range of 26-28%. On the EBIT and
PAT fronts, we expect the company to post 5.0% and 4.5% CAGR over FY2017-19E
respectively. The stock is trading at 18.9x FY2019E EPS of `146.6. We maintain our
Reduce recommendation.
Exhibit 10: Key assumptions
FY2018E
FY2019E
Revenue growth (USD)
8.0
11.0
USD-INR rate (realized)
65.0
65.0
Revenue growth (`)
4.6
10.6
EBITDA margin (%)
26.4
26.3
Tax rate (%)
23.5
23.5
EPS growth (%)
0.2
8.9
Source: Company, Angel Research
January 15, 2018
6
TCS | 3QFY2018 Result Update
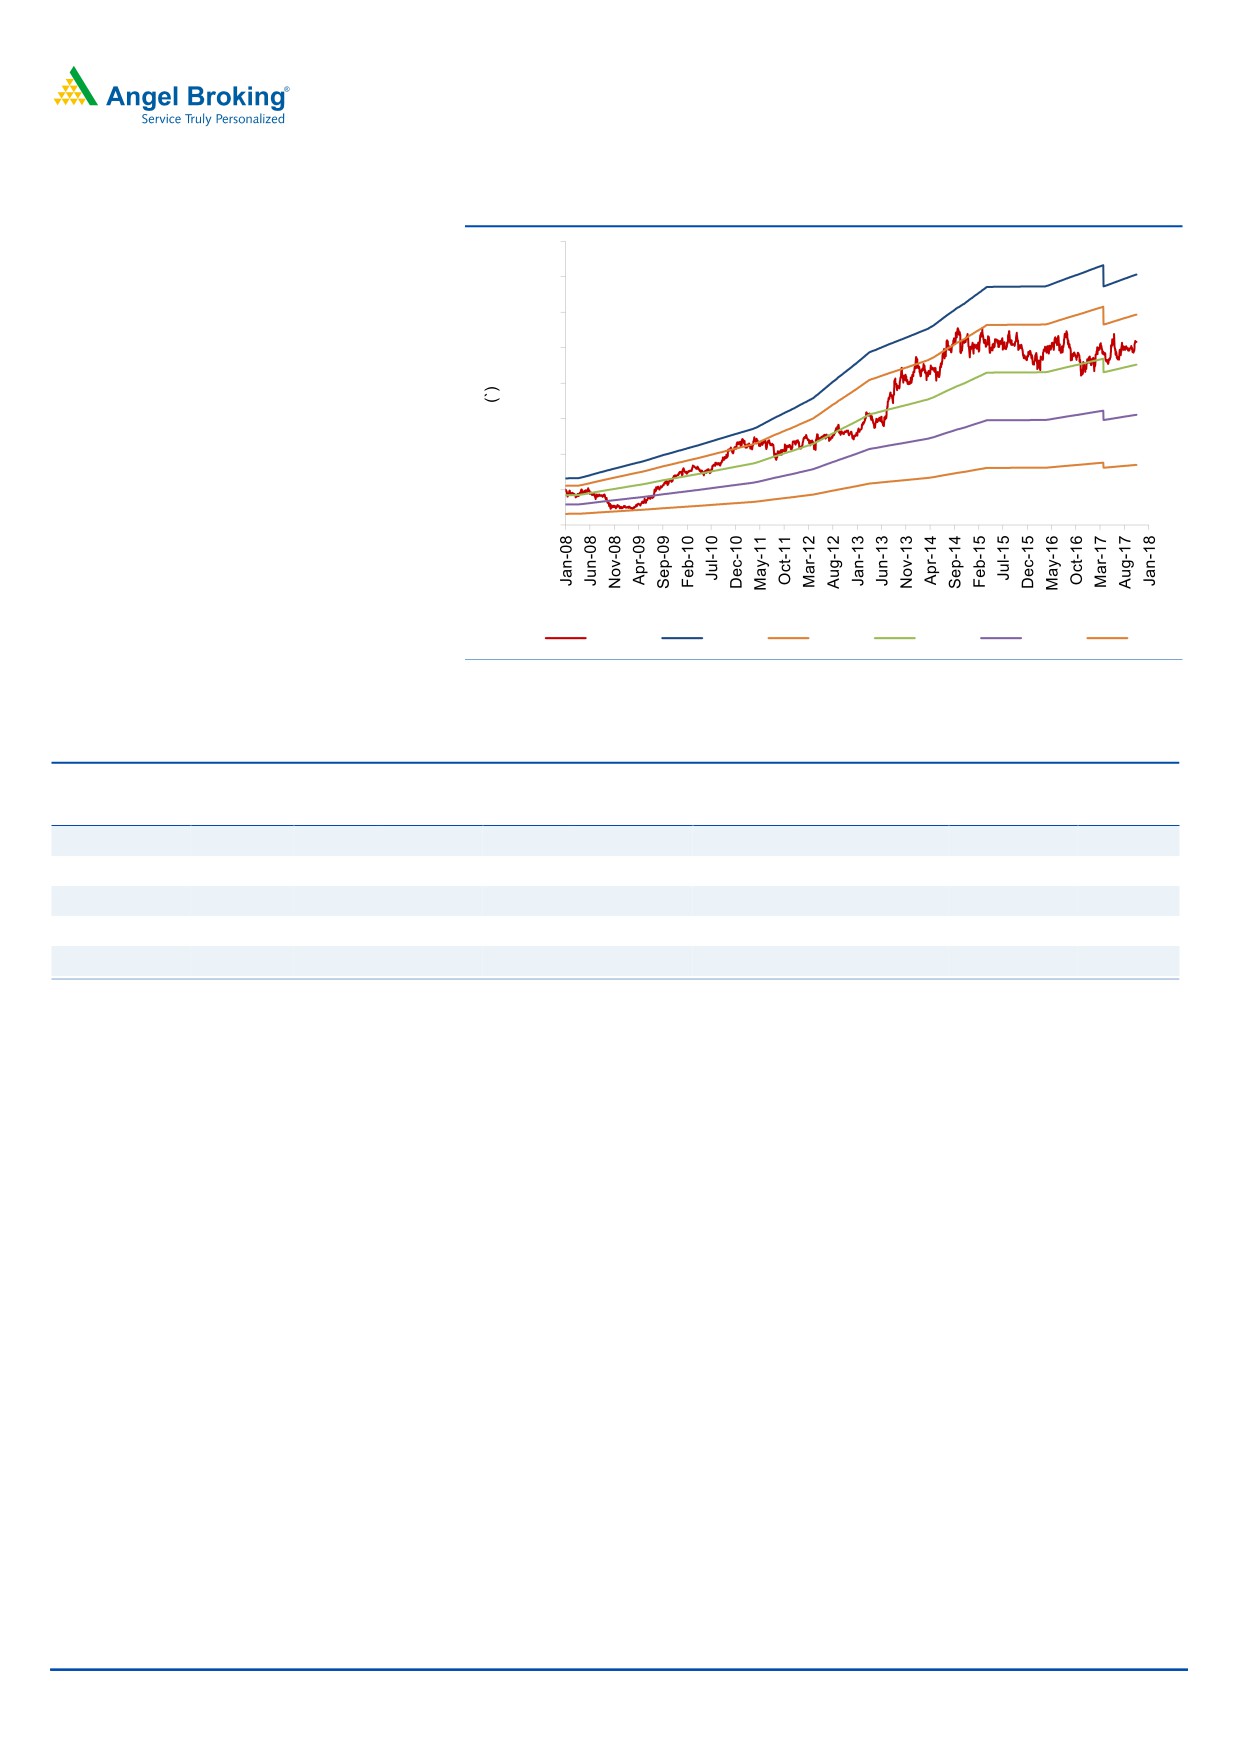
Exhibit 11: One-year forward PE chart
4,000
3,500
3,000
2,500
2,000
1,500
1,000
500
0
Price
25x
21x
16x
11x
6x
Source: Company, Angel Research
Exhibit 12: Recommendation summary
Company
Reco
CMP Tgt. price Upside
FY2019E FY2019E
FY2017-19E
FY2019E FY2019E
(`)
(`)
(%) EBITDA (%)
P/E (x)
EPS CAGR (%) EV/Sales (x)
RoE (%)
HCL Tech
Accumulate
926
1,014
9.6
20.9
13.7
6.2
1.8
20.6
Infosys
Neutral
1,078
-
-
26.0
16.4
5.3
2.1
19.6
TCS
Reduce
2,773
2,493
(10.1)
26.3
18.9
4.5
3.5
28.3
Tech Mahindra Neutral
550
-
-
15.0
14.6
8.6
1.3
16.3
Wipro
Reduce
319
280
(12.2)
20.3
16.3
4.4
1.5
13.4
Source: Company, Angel Research
January 15, 2018
7
TCS | 3QFY2018 Result Update
Company background
TCS is Asia's largest IT services provider and is amongst the top 10 technology firms
in the world. The company has a global footprint with an employee base of over
3lakh professionals, offering services to more than 1,000 clients across various
industry segments. The company has one of the widest portfolios of service
offerings, spanning across the entire IT service value chain - from traditional
application development and maintenance to consulting and package
implementation to products and platforms.
January 15, 2018
8
TCS | 3QFY2018 Result Update
Profit & Loss statement (Consolidated, IFRS)
Y/E March (` cr)
FY2015
FY2016
FY2017
FY2018E FY2019E
Net sales
94,648
108,646
117,966
123,384
136,504
Cost of revenue
50,599
58,952
64,764
68,478
75,760
Gross profit
44,049
49,695
53,202
54,906
60,744
% of net sales
46.5
45.7
45.1
44.5
44.5
SGA expenses
17,353
18,956
20,755
22,332
24,844
% of net sales
18.3
17.4
17.6
18.1
18.2
EBITDA
26,696
30,738
32,447
32,573
35,901
% of net sales
28.2
28.3
27.5
26.4
26.3
Dep. and amortization
1272
1948
2123
2221
2457
% of net sales
1.3
1.8
1.8
1.8
1.8
EBIT
25,424
28,790
30,324
30,352
33,444
% of net sales
26.9
26.5
25.7
24.6
24.5
Other income, net
3140
3050
4189
4189
4189
Profit before tax
28,564
31,840
34,513
34,541
37,633
Provision for tax
6,083
7,503
8,156
8,117
8,844
% of PBT
21.3
23.6
23.6
23.5
23.5
PAT
22,481
24,338
26,357
26,424
28,789
Minority interest
205
123
68
78
89
Extra-ordinary (Exp.)/ Inc.
-2627.9
Reported PAT
19,648
24,215
26,289
26,346
28,700
Adj. PAT
21,696
24,215
26,289
26,346
28,700
Diluted EPS (`)
110.9
123.7
134.3
134.6
146.6
January 15, 2018
9
TCS | 3QFY2018 Result Update
Balance sheet (Consolidated, IFRS)
Y/E March (` cr)
FY2015 FY2016
FY2017 FY2018E FY2019E
Assets
Cash and cash equivalents
1,862
1,862
3,597.0
3,477.2
3,356.1
Other current financial assets
16,383
4,833
-
-
-
Accounts receivable
20,440
24,073
22,684
31,762
31,812
Unbilled revenues
3,827
3,992
5,351
5,348
5,349
Other current assets
6,414
5,975
7,258
7,258
7,258
Property and equipment
11,572
11,790
11,741
12,741
13,741
Intangible assets and goodwill
3,931
3,946
3,768
3,768
3,768
Investments
9,619
22,822
41,980
39,267
47,133
Other non current assets
906
11,919
8,974
8,974
8,974
Total assets
74,954
91,212
105,353
112,595
121,391
Liabilities
Current liabilities
14,428
15,407
14,294
14,806
16,381
Short term borrowings
243
162
218
218
218
Redeemable preference shares
-
(0)
-
1
2
Long term debt
114
83
71
71
71
Other non current liabilities
1,778
2,017
2,089
2,431
2,689
Minority interest
914
354
366
444
533
Shareholders funds
57,477
73,190
88,315
94,625
101,498
Total liabilities
74,954
91,212
105,353
112,595
121,391
January 15, 2018
10
TCS | 3QFY2018 Result Update
Cash flow statement (Consolidated, IFRS)
Y/E March (` cr)
FY2015 FY2016 FY2017 FY2018E FY2019E
Pre-tax profit from oper.
22,481
24,338
26,357
26,424
28,789
Depreciation
1,272
1,948
2,123
2,221
2,457
Exp. (deferred)/written off
160
174
-
-
-
Pre tax cash from oper
23,913
26,460
28,480
28,645
31,246
Other inc./prior period ad
1,272
1,948
2,123
2,221
2,457
Net cash from operations
25,185
28,408
30,604
30,866
33,703
Tax
6,083
7,503
8,156
8,117
8,844
Cash profits
19,102
20,905
22,448
22,749
24,859
(Inc)/dec in acc. recv.
(2,210)
(3,633)
1,389
(9,078)
(50)
(Inc)/dec in unbilled rev.
179
(165)
(1,359)
3
(1)
(Inc)/dec in oth. current asst.
(6,414)
439
(1,283)
-
-
Inc/(dec) in current liab.
(1,207)
(218)
49
(1,000)
(1,000)
Net trade working capital
(9,652)
(3,577)
(1,204)
(10,074)
(1,051)
Cash flow from opert. actv.
9,450
17,328
21,243
12,674
23,808
(Inc)/dec in fixed assets
(1,207)
(218)
49
(1,000)
(1,000)
(Inc)/dec in investments
(4,446)
(1,653)
(14,325)
2,713
(7,866)
(Inc)/dec in intangible asst.
(226)
16
(178)
-
-
(Inc)/dec in non-cur.asst.
(906)
(11,013)
2,945
-
-
Cash flow from invt. actv.
(6,786)
(12,869)
(11,509)
1,713
(8,866)
Inc/(dec) in debt
61
(113)
44
-
-
Inc/(dec) in minority int.
223
(559)
12
78
89
Dividends
(19,923)
(18,415)
(19,993)
(20,036)
(21,826)
Others
16,976
14,629
10,202
5,571
6,794
Cash flow from finan. actv.
(2,664)
(4,459)
(9,735)
(14,387)
(14,943)
Cash generated/(utilized)
393
-
1,735
(120)
(121)
Cash at start of the year
1,469
1,862
1,862
3,597
3,477
Cash at end of the year
1,862
1,862
3,597
3,477
3,356
January 15, 2018
11
TCS | 3QFY2018 Result Update
Key ratios
Y/E March
FY2015 FY2016 FY2017 FY2018E FY2019E
Valuation ratio(x)
P/E (on FDEPS)
25.0
22.4
20.6
20.6
18.9
P/CEPS
26.0
20.8
19.1
19.0
17.4
P/BVPS
9.4
7.4
6.1
5.7
5.3
Dividend yield (%)
1.6
1.4
1.6
1.6
1.7
EV/Sales
5.3
4.6
4.1
4.0
3.5
EV/EBITDA
18.8
16.3
15.0
15.0
13.4
EV/Total assets
6.7
5.5
4.6
4.3
4.0
Per share data (`)
EPS
110.9
123.7
134.3
134.6
146.6
Cash EPS
106.8
133.6
145.1
145.8
159.1
Dividend
43.5
40.2
43.6
43.7
47.6
Book value
294
374
451
483
519
DuPont analysis
Tax retention ratio (PAT/PBT)
0.8
0.8
0.8
0.8
0.8
Cost of debt (PBT/EBIT)
1.1
1.1
1.1
1.1
1.1
EBIT margin (EBIT/Sales)
0.3
0.3
0.3
0.2
0.2
Asset turnover ratio (Sales/Assets)
1.3
1.2
1.1
1.1
1.1
Leverage ratio (Assets/Equity)
1.3
1.2
1.2
1.2
1.2
Operating ROE
39.1
33.3
29.8
27.9
28.4
Return ratios (%)
RoCE (pre-tax)
33.9
31.6
28.8
27.0
27.6
Angel RoIC
54.0
46.7
50.7
43.5
47.2
RoE
34.2
33.1
29.8
27.8
28.3
Turnover ratios(x)
Asset turnover (fixed assets)
8.2
9.2
10.0
9.7
9.9
Receivables days
79
81
70
94
85
January 15, 2018
12
TCS | 3QFY2018 Result Update
Research Team Tel: 022 - 39357800
DISCLAIMER
Angel Broking Private Limited (hereinafter referred to as “Angel”) is a registered Member of National Stock Exchange of India Limited,
Bombay Stock Exchange Limited and Metropolitan Stock Exchange Limited. It is also registered as a Depository Participant with CDSL
and Portfolio Manager with SEBI. It also has registration with AMFI as a Mutual Fund Distributor. Angel Broking Private Limited is a
registered entity with SEBI for Research Analyst in terms of SEBI (Research Analyst) Regulations, 2014 vide registration number
INH000000164. Angel or its associates has not been debarred/ suspended by SEBI or any other regulatory authority for accessing
/dealing in securities Market. Angel or its associates/analyst has not received any compensation / managed or co-managed public
offering of securities of the company covered by Analyst during the past twelve months.
This document is solely for the personal information of the recipient, and must not be singularly used as the basis of any investment
decision. Nothing in this document should be construed as investment or financial advice. Each recipient of this document should make
such investigations as they deem necessary to arrive at an independent evaluation of an investment in the securities of the companies
referred to in this document (including the merits and risks involved), and should consult their own advisors to determine the merits
and risks of such an investment.
Reports based on technical and derivative analysis center on studying charts of a stock's price movement, outstanding positions and
trading volume, as opposed to focusing on a company's fundamentals and, as such, may not match with a report on a company's
fundamentals. Investors are advised to refer the Fundamental and Technical Research Reports available on our website to evaluate the
contrary view, if any.
The information in this document has been printed on the basis of publicly available information, internal data and other reliable
sources believed to be true, but we do not represent that it is accurate or complete and it should not be relied on as such, as this
document is for general guidance only. Angel Broking Pvt. Limited or any of its affiliates/ group companies shall not be in any way
responsible for any loss or damage that may arise to any person from any inadvertent error in the information contained in this report.
Angel Broking Pvt. Limited has not independently verified all the information contained within this document. Accordingly, we cannot
testify, nor make any representation or warranty, express or implied, to the accuracy, contents or data contained within this document.
While Angel Broking Pvt. Limited endeavors to update on a reasonable basis the information discussed in this material, there may be
regulatory, compliance, or other reasons that prevent us from doing so.
This document is being supplied to you solely for your information, and its contents, information or data may not be reproduced,
redistributed or passed on, directly or indirectly.
Neither Angel Broking Pvt. Limited, nor its directors, employees or affiliates shall be liable for any loss or damage that may arise from
or in connection with the use of this information.
Disclosure of Interest Statement
TCS
1. Financial interest of research analyst or Angel or his Associate or his relative
No
2. Ownership of 1% or more of the stock by research analyst or Angel or associates or relatives
No
3. Served as an officer, director or employee of the company covered under Research
No
4. Broking relationship with company covered under Research
No
Ratings (Based on expected returns
Buy (> 15%)
Accumulate (5% to 15%)
Neutral (-5 to 5%)
over 12 months investment period):
Reduce (-5% to -15%)
Sell (< -15)
January 15, 2018
13