2QFY2018 Result Update | Pharmaceutical
November 24, 2017
Indoco Remedies
SELL
CMP
`280
Performance Highlights
Target Price
`136
Y/E March (` cr)
2QFY18
1QFY18
% chg (qoq) 2QFY17 % chg (yoy)
Investment Period
-
Net sales
280
204
37.1
276
1.3
Other operating income
7
6
25.8
6
26.1
Stock Info
Gross profit
180
133
35.1
179
0.3
Sector
Pharmaceutical
Operating profit
36
(3)
-
37
(3.1)
Market Cap (` cr)
2 ,579
Net profit/(loos)
20
(22)
-
22
(10.7)
Net Debt (` cr)
188
Source: Company, Angel Research
Beta
0 .2
52 Week High / Low
287/179
For 2QFY2018 Indoco Remedies sales came in at
`280cr, in line with
Avg. Daily Volum e
19,371
expectations, posting a yoy growth of 1.3%. The growth was impacted by lower
Face Value (`)
2
exports, mainly on the back of US (` post a 69.5% yoy dip in sales). Indian
BSE Sensex
33,562
Formulation sales posted 11.5% yoy growth. On operating front, the EBITDA
Nifty
10,342
margins came in at 12.9% (11.8% expected) v/s. 13.5% in 2QFY2017, following
Reuters Code
INRM.BO
lower than expected other expenses during the quarter. Thus, the PAT came in
Bloom berg Code
INDR@IN
at ` 20cr (`13cr expected) v/s. `22cr in 2QFY2017. We maintain our sell rating on
the stock, with a price target of `136.
Shareholding Pattern (%)
Prom oters
58.9
Results better than expected: Sales came in at `280cr v/s. `276cr in 2QFY2017, a
MF / Banks / Indian Fls
12.9
yoy growth of 1.3%. The growth was impacted by lower exports, mainly on the
FII / NRIs / OCBs
11.4
Indian Public / Others
16.8
back of US (` post a dip of 69.5% yoy dip in sales). Indian Formulation sales
posted a 11.5% yoy growth. The formulation sales (`262.5cr accounting for 92.2%
of total sales in 2QFY2018) posted a flat growth of 0.4% yoy. The domestic
Abs . (% )
3m
1 yr
3 yr
formulation sales (`188cr) registered a growth of 11.5% yoy. The International
Sensex
6 .3
29.3
17.8
Indoco
(18.7)
(39.9)
(15.8)
formulation sales (`74cr) posted a yoy dip of 19.8%. The API sales (`14.7cr)
posted a yoy grow of 8.3%. On operating front, the EBITDA margins came in at
12.9% (11.8% expected) v/s. 13.5% in 2QFY2017, following lower than expected
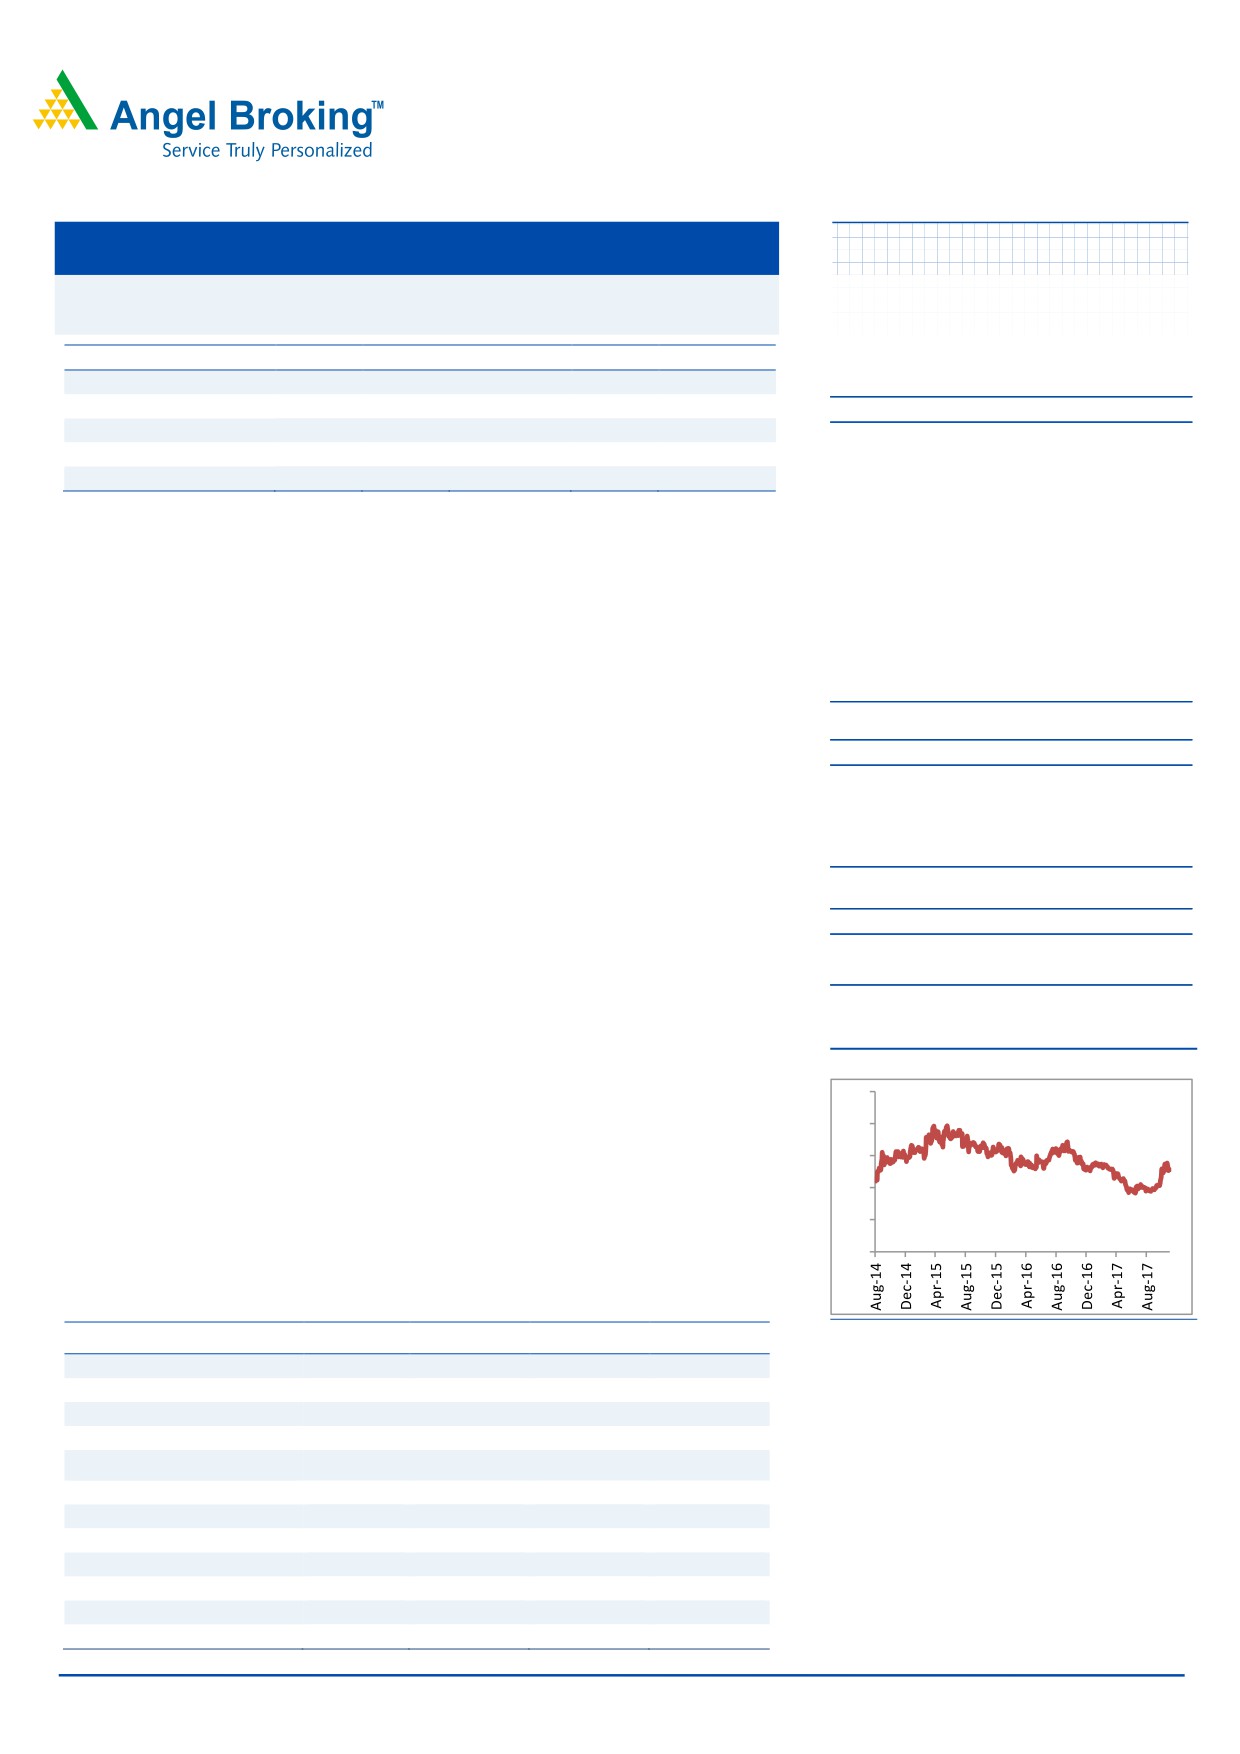
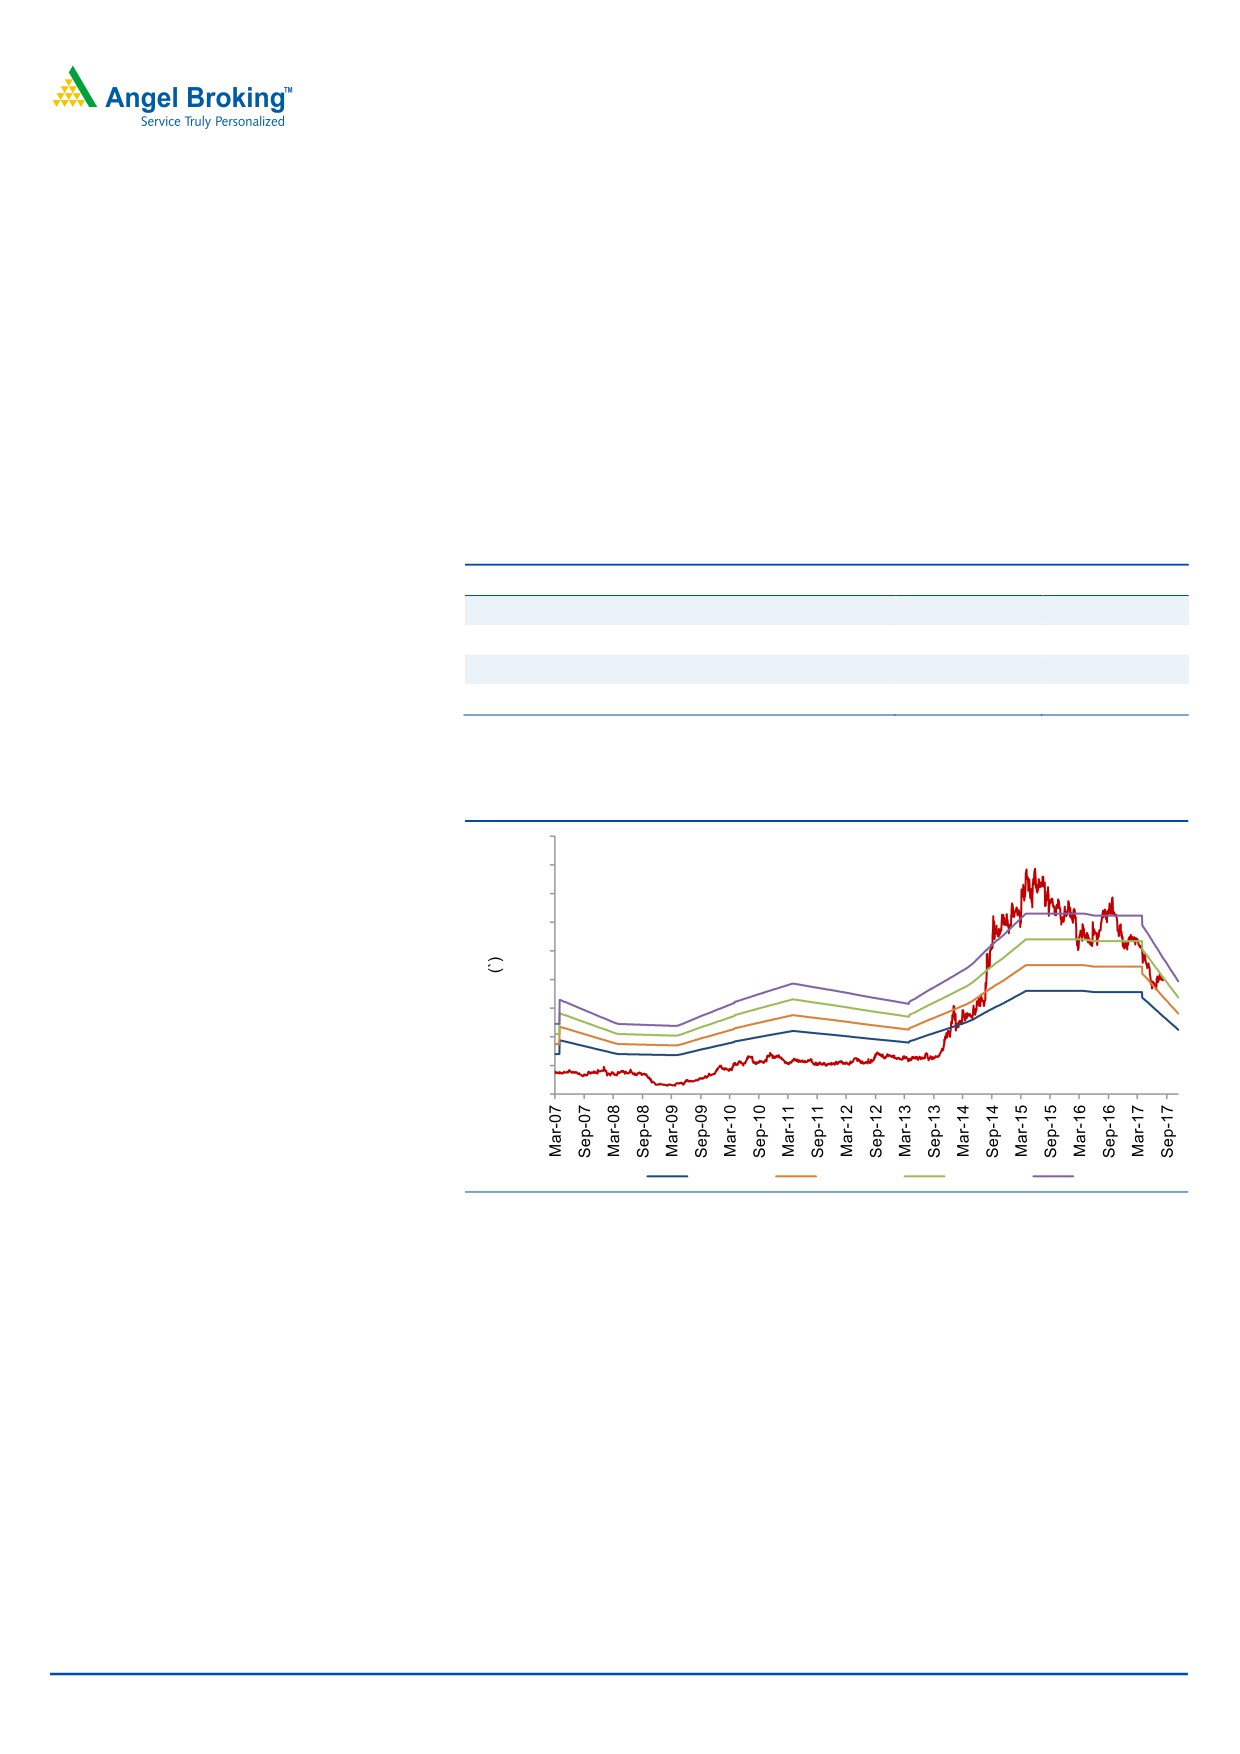
3-Year Daily Price Chart
other expenses during the quarter. Gross margins came in at 64.2% v/s. 64.9% in
2QFY2017, while R&D expenses were 4.9% of sales in 2QFY2018 v/s. 4.4% of sales
500
in 2QFY2017. Thus, the PAT came in at ` 20cr (` 13cr expected) v/s. `22cr in
400
2QFY2017.
300
200
Outlook and valuation: We expect net sales to post a CAGR of 10.3% to `1,297cr
100
and EPS to post a CAGR of 16.2% to `11.4 over FY2017-19E. We maintain our SELL
0
rating on back of the valuations and the corresponding lower profitability.
Key financials (Consolidated)
Y/E March (` cr)
FY2016
FY2017
FY2018E
FY2019E
Source: Company, Angel Research
Net sales
977
1067
1114
1297
% chg
14.6
9.2
4.4
16.5
Net profit
83.0
77.5
51.3
104.6
% chg
0.2
(6.7)
(33.7)
103.7
EPS (`)
9.0
8.4
5.6
11.4
EBITDA margin (%)
14.9
12.1
9.9
13.9
P/E (x)
29.7
31.8
47.9
23.5
RoE (%)
15.1
12.6
7.7
14.5
RoCE (%)
11.9
7.9
3.8
10.1
Sarabjit Kour Nangra
P/BV (x)
4.2
3.8
3.6
3.2
+91 22 39357600 - Ext: 6806
EV/Sales (x)
2.6
2.5
2.4
2.1
EV/EBITDA (x)
17.7
20.5
24.7
14.9
Source: Company, Angel Research; Note: CMP as of November 22, 2017
Please refer to important disclosures at the end of this report
1
Indoco Remedies |2QFY2018 Result Update
Exhibit 1: 2QFY2018 (Consolidated) performance
Y/E March (` cr)
2QFY2018
1QFY2018
% chg (qoq) 2QFY2017
% chg (yoy) 1HFY2018 1HFY2017
% chg (yoy)
Net sales
280
204
37.1
276
1.3
484
529
(8.4)
Other income
7.1
5.7
25.8
5.6
26.1
13
12
8.7
Total income
287
210
36.8
282
1.8
497
541
(8.1)
Gross profit
180
133
35.1
179
0.3
313
635
(50.7)
Gross margins (%)
64.2
65.2
64.9
64.6
64.8
Operating profit
36.2
(3.5)
-
37.3
(3.1)
32.7
74.5
(56.1)
OPM (%)
12.9
(1.7)
13.5
6.7
14.1
Interest
7
6
2
343.9
13
5
153.6
Dep & amortisation
17
17
2.0
17
3.2
34
33
1.8
PBT
19
(21)
-
25
-
(2)
48
Provision for taxation
(0.7)
0.9
2.6
0
6
Reported Net profit
20
(22)
-
22
(10.7)
(2)
42
Less : Exceptional items
0
0
-
0
0
0
PAT after exceptional items
20
(22)
-
22
(10.7)
(2)
42
EPS (`)
2.1
-
2.4
-
4.5
Source: Company, Angel Research
Exhibit 2: 2QFY2018 - Actual vs. Angel estimates
(` cr)
Actual
Estimate
Variation (%)
Net sales
280
280
0.0
Other operating income
7
6
27.0
Operating profit
36
33
9.7
Tax
(1)
3
-
Net profit
20
13
49.7
Source: Company, Angel Research
Revenues just in-line with expectations: Sales came in at `280cr (`280cr
expected) v/s. `276cr in 2QFY2017, a yoy growth of 1.3%. The growth was
impacted by lower exports mainly on the back of US (`post a dip of 69.5%
yoy dip in sales). Indian Formulation sales posted a 11.5% yoy growth.
The formulation sales (`262.5cr; 92.2% of total sales in 2QFY2018) posted a
growth of 0.4% yoy. The domestic formulation sales (`188.2cr) registered a
growth of 11.5% yoy. The International formulation sales (`74cr) posted a yoy
dip of 19.8%. The API sales (`14.7cr) posted a yoy growth of 8.3%.
In US, during the quarter, the revenues de-grew by 69.5% at `8.0cr as
against `26.2cr for the same period last year. In terms of filings, the
company (through partners or by itself), filed 35 ANDAs, which are pending
approvals with 10 ANDAs approved till date, with 2 tentative approvals.
On the progress of remediation measures, the Company has sent its final
response to USFDA with all the supporting documentation and updates of
completed actions. Detailed investigations were performed to identify root
cause of the observations and to have an effective Corrective and
Preventive action (CAPA) plan.
Consequent to the responses, Indoco continues to work with the US based
consultant to assess all GMP systems at site and ensure upgradations as per
latest GMP trends. The Company informed that it is on track in sending all its
responses and will seek an audience with USFDA. The Company will soon
November 24, 2017
2
Indoco Remedies |2QFY2018 Result Update
commence production of some of the existing ophthalmic products from
Goa plant II for US market.
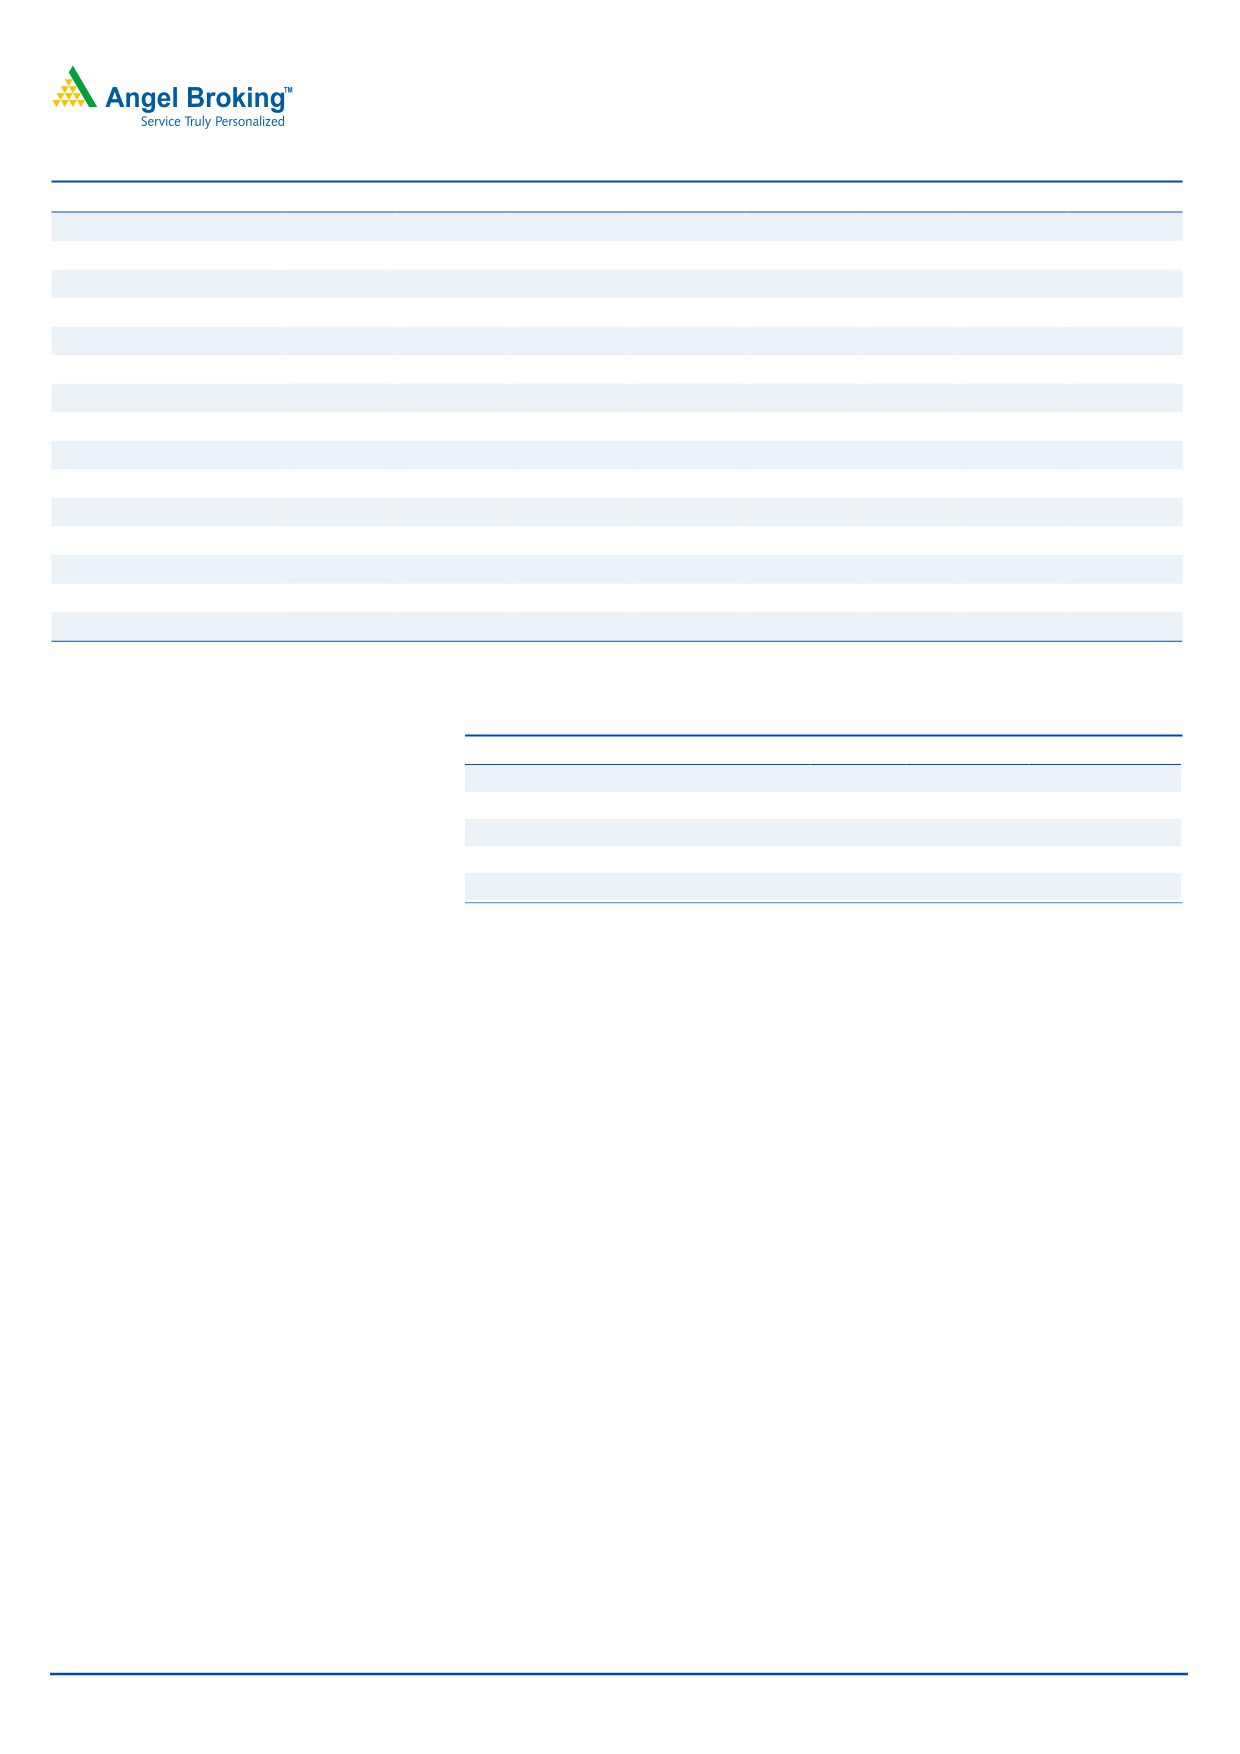
Exhibit 3: Domestic Formulation sales trend
210
188
190
169
170
150
144
130
130
110
100
90
70
50
2QFY2017
3QFY2017
4QFY2017
1QFY2018
2QFY2018
Source: Company, Angel research
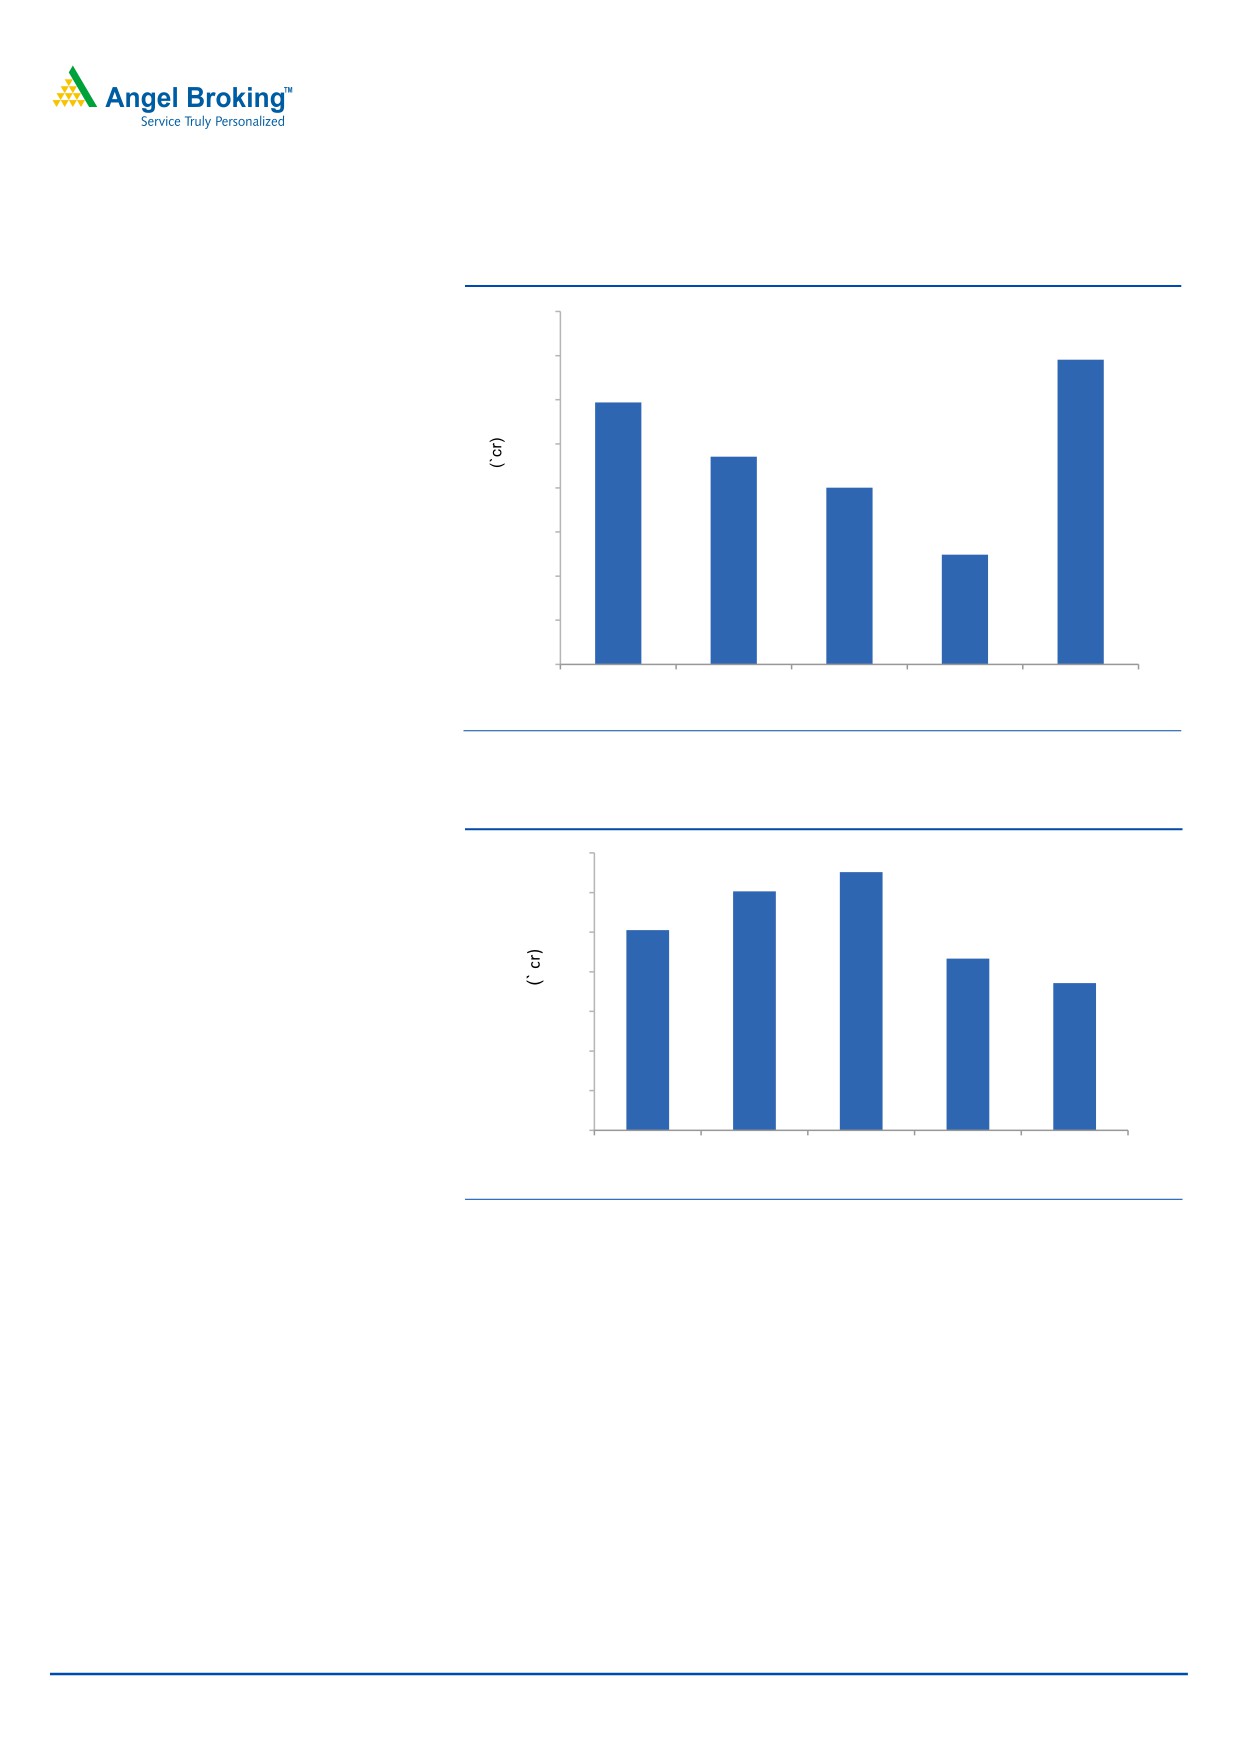
Exhibit 4: Export sales trend
140.0
130
121
120.0
101
100.0
87
74
80.0
60.0
40.0
20.0
0.0
2QFY2017
3QFY2017
4QFY2017
1QFY2018
2QFY2018
Source: Company, Angel research
OPM dips yoy, but better than expected: On operating front, the EBITDA
margins came in at 12.9% (11.8% expected) v/s. 13.5% in 2QFY2017, mainly on
the back of lower than expected other expenses during the quarter. Gross
margins came in at 64.2% v/s. 64.9% in 2QFY2017, while R&D expenses were 4.9%
of sales in 2QFY2018 v/s. 4.4% of sales in 2QFY2017. On yoy basis, the decline was
mainly on back of 13.0% yoy rise in the R&D expenses.
November 24, 2017
3
Indoco Remedies |2QFY2018 Result Update
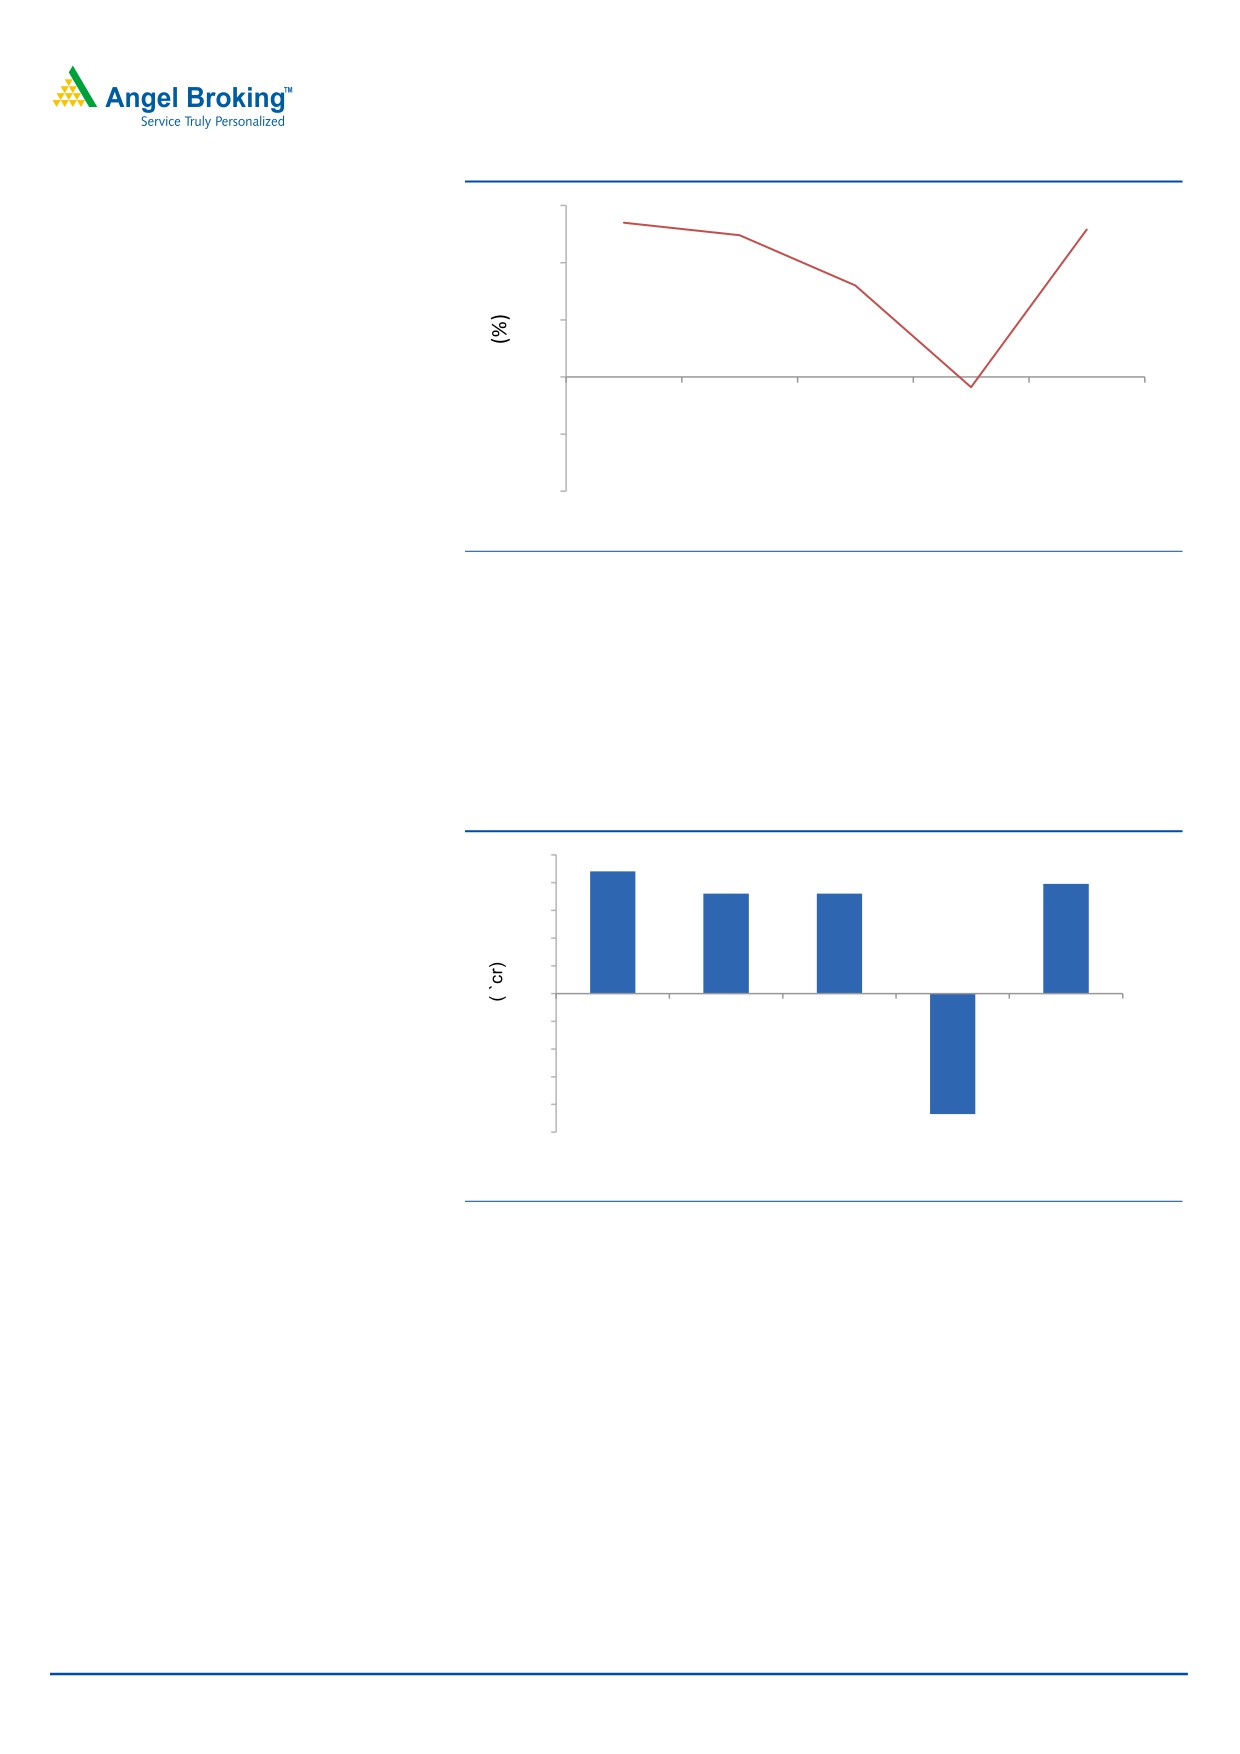
Exhibit 5: OPM trend
15.0
13.5
12.4
10.0
8.0
12.9
5.0
0.0
2QFY2017
3QFY2017
4QFY2017
1QFY2018
2QFY2018
-0.9
(5.0)
(10.0)
Source: Company, Angel Research
Net profit better than expectation: Consequently, PAT came in at `20cr
(`13cr expected) v/s. `22cr in 2QFY2017. The higher than expected net profit
was on the back of higher other income and lower than expected taxes.
Other income came in at `7.1cr v/s. `5.6cr during the corresponding period
last year. On yoy basis, the PAT dipped by 10.7%, following lower OPM.
Exhibit 6: Net profit trend
22
25
20
18
18
20
15
10
5
0
2QFY2017
3QFY2017
4QFY2017
1QFY2018
2QFY2018
-5
-10
-15
-20
-25
-22
Source: Company, Angel Research
November 24, 2017
4
Indoco Remedies |2QFY2018 Result Update
Concall takeaways
Management expects that stoppage of exports of its ophthalmic
solution to US, and sluggish growth in the unregulated markets are one-
offs. All these markets are expected to deliver robust growth going
ahead.
Company’s exports also remain lackluster with lower supply from its OSD
plant in Goa Unit-I. EU sales declined by 6% qoq due to lower offtake in
tender business in Germany. EM sales also declined down by 15% due
to volatile currencies in South Africa and New Zealand.
Investment arguments
Focus on domestic formulations- Aiming for a higher-than-industry growth:
Indoco has a strong brand portfolio of 135 products and a base of ~2,800
MRs. It operates in various therapeutic segments, including anti-infective,
anti-diabetic, CVS, ophthalmic, dental care, pain management and
respiratory. Prominent Indoco brands include Cyclopam, Vepan, Febrex
Plus, ATM, Sensodent-K and Sensoform. The company has seen strong
growth across the respiratory, anti-infective, ophthalmic and alimentary
therapeutic segments. Further, the company is investing to enhance the
share of the chronic segment, which constitutes 10% of overall sales. With a
market share of 0.7% and overall rank of 31, the company is still a marginal
player with some top brands in smaller categories such as stomatologicals.
We expect the domestic formulation segment to grow at a 11.5CAGR of
13.0% over FY2017-19E.
Scaling-up on the exports front: Indoco has also started focusing on
regulated markets by entering into long-term supply contracts. The
company is currently executing several contract-manufacturing projects,
and covering a number of products for its clients in the UK, Germany and
Slovenia. Indoco has received a nod from the USFDA for two of its facilities
in Goa. The company derived ~49% of its revenues from exports in 2016-17.
The US cumulative ANDA filings stood at 42 with 29 pending approvals
(including 3 tentative approvals). Of these, 18 were filed under the Actavis
deal. The Goa plant warning letter is likely to weigh on company’s US
business, as most of the pending ANDAs are from this unit. Watson deal,
which is at the core of US business prospects, is also likely to witness a
slowdown, as the development may lead to a delay in approval for
products that are part of the deal. The deal covers 18 pending ANDAs. We
expect the exports segment to grow at 15.0% CAGR over FY2017-19E.
Partnering with pharmaceutical majors: The Company has a large customer
base of small and medium sized generic companies across the globe and
has major tie-ups with generic companies for certain territories and
products. It has a deal with Watson Pharmaceuticals to develop and
manufacture a number of sterile (ophthalmic) products for marketing in the
USA. The agreement with South Africa's largest pharmaceutical company,
November 24, 2017
5
Indoco Remedies |2QFY2018 Result Update
Aspen Pharmacare, encompasses a number of solid dosages and
ophthalmic products, extending to 30 emerging market countries, while the
contract signed with DSM, Austria is for marketing 8 of Indoco's APIs in
various geographies. These deals have further strengthened Indoco's image
in the international arena.
Valuation: We expect net sales to post a CAGR of 10.3% to `1,297cr and EPS
to post a CAGR of 16.2% to `11.4 over FY2017-19E. At the current market
price, the stock is trading at 47.9x and 16.7x its FY2018E and FY2019E earnings
respectively. We maintain a SELL rating on the stock considering the
valuations.
Exhibit 7: Key assumptions
FY2018E
FY2019E
Domestic sales growth (%)
6.0
18.0
Exports growth
15.0
15.0
Operating margins (%)
9.9
13.9
Capex (` cr)
90.0
60.0
Source: Company, Angel Research
Exhibit 8: One-year forward PE band
450
400
350
300
250
200
150
100
50
0
20x
25x
30x
35x
Source: Company, Angel Research
November 24, 2017
6
Indoco Remedies |2QFY2018 Result Update
Exhibit 9: Recommendation summary
Company
Reco
CMP Tgt. price Upside
FY2019E
FY17-19E
FY2019E
PE
EV/Sales
RoCE
RoE
(`)
(`)
(%)
EV/EBITDA (x) CAGR in EPS (%)
(x)
(x)
(%)
(%)
Alembic Pharma
Buy
511
600
17.3
21.4
2.9
13.0
5.7
20.6
18.4
Aurobindo Pharma Buy
699
823
17.8
13.6
2.5
9.9
14.2
25.3
22.7
Cadila Healthcare Reduce
443
411
(7.2)
21.6
4.1
17.6
18.9
16.5
22.2
Cipla
Sell
619
462
(25.3)
25.5
3.2
16.2
39.3
10.9
13.1
Dr Reddy's
Reduce
2,361
2,040
(13.6)
23.2
3.1
13.3
18.5
10.3
12.4
Dishman Pharma
Under Review
301
-
-
19.3
2.7
10.1
23.3
4.5
4.4
GSK Pharma
Sell
2,496
2,000
(19.9)
53.9
6.9
39.3
19.3
25.8
23.5
Indoco Remedies Sell
280
136
(49.0)
23.5
2.1
14.9
16.2
10.1
14.5
Ipca labs
Neutral
535
-
-
21.2
1.9
13.5
24.7
12.4
11.0
Lupin
Buy
828
1,091
31.8
16.7
2.4
9.3
(6.6)
13.7
13.7
Sanofi India*
Neutral
4,434
-
-
27.1
3.8
17.0
12.8
25.8
27.5
Sun Pharma
Buy
535
615
15.0
24.0
3.7
16.3
(17.5)
11.3
14.0
Source: Company, Angel Research; Note: *December year ending,
November 24, 2017
7
Indoco Remedies |2QFY2018 Result Update
Company Background
Indoco has a strong brand portfolio of 135 products and a base of 2,300
MRs. The company operates in various therapeutic segments including anti-
infective, anti-diabetic, CVS, ophthalmic, dental care, pain management
and respiratory areas. Prominent Indoco brands include Cyclopam, Vepan,
Febrex Plus, ATM, Sensodent-K and Sensoform. The company’s top-10
brands contribute over 50% of its domestic sales. Indoco now proposes to
scale up its exports through higher exposure to the regulated markets.
Profit & loss statement (Consolidated)
Y/E March (` cr)
FY2014
FY2015
FY2016
FY2017
FY2018E FY2019E
Gross sales
735
863
987
1,078
1,126
1,312
Less: Excise duty
13
11
10
12
12
15
722
852
977
1,067
1,114
1,297
Net sales
Other operating income
10
5
27
27
27
27
Total operating income
733
857
1,004
1,094
1,141
1,325
% chg
16.2
17.0
17.1
9.0
4.3
16.1
Total expenditure
612
691
831
937
1,003
1,117
272
300
341
382
412
480
Net raw materials
Other mfg costs
42
50
57
62
65
76
Personnel
130
140
183
216
226
263
Other
168
201
250
277
301
298
EBITDA
110
161
145
129
110
180
23.5
46.1
(9.7)
(11.0)
(14.7)
63.6
% chg
(% of Net Sales)
15.2
18.9
14.9
12.1
9.9
13.9
Depreciation& amortisation
31
47
60
63
75
83
EBIT
79
114
85
66
35
98
% chg
21.0
43.7
(25.4)
(22.2)
(46.9)
178.9
11.0
13.3
8.7
6.2
3.1
7.5
(% of Net Sales)
Interest & other charges
19
11
13
6
6
6
Other income
2
2
1
4
4
4
(% of PBT)
2.4
1.6
1.1
4.5
6.9
3.4
Share in profit of Associates
-
-
1.0
2.0
3.0
4.0
72
110
101
91
60
123
Recurring PBT
PBT (reported)
72
110
101
91
60
123
Tax
14
27
18
14
9
18
(% of PBT)
19.6
24.3
17.5
15.2
15.0
15.0
PAT (reported)
58
83
83
77
51
105
-
-
-
-
-
-
Add: Share of earnings of asso.
Less: Minority interest (MI)
-
-
-
-
-
-
Prior period items
-
-
-
-
-
-
PAT after MI (reported)
58
83
83
77
51
105
ADJ. PAT
58
83
83
77
51
105
36.5
42.3
0.2
(6.7)
(33.7)
103.7
% chg
(% of Net Sales)
8.1
9.7
8.5
7.3
4.6
8.1
Basic EPS (`)
6.3
9.0
9.0
8.4
5.6
11.4
Fully Diluted EPS (`)
6.3
9.0
9.0
8.4
5.6
11.4
% chg
36.5
42.3
0.2
(6.7)
(33.7)
103.7
November 24, 2017
8
Indoco Remedies |2QFY2018 Result Update
Balance Sheet (Consolidated)
Y/E March (` cr)
FY2014
FY2015 FY2016 FY2017 FY2018E FY2019E
SOURCES OF FUNDS
Equity share capital
18
18
18
18
18
18
Reserves & surplus
439
500
566
633
664
748
Shareholders funds
457
519
583
651
681
765
Minority Interest
-
-
-
-
-
-
Total loans
72
88
127
251
300
250
Other Long Term Liab.
9
9
10
10
10
10
Long Term Provisions
16
16
17
19
19
19
31
27
24
(28)
(28)
(28)
Deferred tax liability
Total liabilities
585
659
762
903
954
988
APPLICATION OF FUNDS
Gross block
481
561
560
715
805
865
Less: acc. depreciation
156
203
264
327
402
485
Net block
325
358
296
388
403
380
Capital work-in-progress
44
44
44
44
44
44
Goodwill
-
0
88
98
98
98
Investments
0
0
15
0
0
0
Long Term Loans And Adv.
55
58
71
66
109
127
Current assets
305
385
448
572
575
659
Cash
13
15
15
63
33
27
Loans & advances
42
85
78
107
111
130
Other
249
285
355
403
431
502
Current liabilities
144
187
201
265
275
320
Net current assets
160
199
247
307
301
339
Mis. Exp. not written off
-
-
-
-
-
-
Total assets
585
659
761
903
954
988
November 24, 2017
9
Indoco Remedies |2QFY2018 Result Update
Cash Flow Statement (Consolidated)
Y/E March (` cr)
FY2014
FY2015
FY2016
FY2017
FY2018E FY2019E
72
110
101
91
60
123
Profit before tax
Depreciation
31
47
60
63
75
83
(Inc)/Dec in working capital
(18)
(39)
(62)
(8)
(66)
(62)
2
2
1
4
4
4
Less: Other income
Direct taxes paid
14
27
18
14
9
18
69
90
81
128
56
121
Cash Flow from Operations
(Inc.)/Dec.in fixed assets
(41)
(80)
1
(155)
(90)
(60)
(Inc.)/Dec. in investments
-
-
-
-
-
-
2
2
1
4
4
4
Other income
Cash Flow from Investing
(39)
(78)
3
(151)
(86)
(56)
-
-
(1)
-
-
-
Issue of equity
Inc./(Dec.) in loans
(9)
16
41
126
49
(50)
Dividend Paid (Incl. Tax)
(12)
(22)
(21)
(21)
(21)
(21)
Others
(7)
(4)
(103)
(35)
(29)
-
Cash Flow from Financing
(28)
(10)
(83)
70
(0)
(71)
2
2
(0)
48
(30)
(5)
Inc./(Dec.) in Cash
Opening Cash balances
12
13
15
15
63
33
Closing Cash balances
13
15
15
63
33
27
November 24, 2017
10
Indoco Remedies |2QFY2018 Result Update
Key Ratios
Y/E March
FY2014
FY2015
FY2016
FY2017
FY2018E FY2019E
Valuation Ratio (x)
P/E (on FDEPS)
42.3
29.7
29.7
31.8
47.9
23.5
P/CEPS
27.6
18.9
17.2
17.5
19.4
13.1
5.4
4.7
4.2
3.8
3.6
3.2
P/BV
Dividend yield (%)
0.4
0.7
0.7
0.7
0.7
0.7
3.5
3.0
2.6
2.5
2.4
2.1
EV/Sales
EV/EBITDA
22.9
15.8
17.7
20.5
24.7
14.9
EV / Total Assets
4.3
3.8
3.4
2.9
2.9
2.7
Per Share Data (`)
EPS (Basic)
6.3
9.0
9.0
8.4
5.6
11.4
6.3
9.0
9.0
8.4
5.6
11.4
EPS (fully diluted)
Cash EPS
9.7
14.1
15.6
15.3
13.7
20.3
DPS
1.0
2.0
2.0
2.0
2.0
2.0
Book Value
49.6
56.3
63.3
70.6
74.0
83.1
Dupont Analysis
11.0
13.3
8.7
6.2
3.1
7.5
EBIT margin
Tax retention ratio
80.4
75.7
82.5
84.8
85.0
85.0
Asset turnover (x)
1.3
1.4
1.4
1.4
1.3
1.4
ROIC (Post-tax)
11.6
14.2
10.3
7.2
3.5
9.0
Cost of Debt (Post Tax)
18.7
10.0
9.6
2.8
1.9
1.9
0.2
0.1
0.2
0.2
0.3
0.3
Leverage (x)
Operating ROE
10.4
14.8
10.5
8.3
4.0
11.4
Returns (%)
ROCE (Pre-tax)
13.9
18.3
11.9
7.9
3.8
10.1
Angel ROIC (Pre-tax)
15.3
20.2
14.0
10.0
4.7
12.2
13.4
17.0
15.1
12.6
7.7
14.5
ROE
Turnover ratios (x)
Asset Turnover (Gross Block)
1.6
1.6
1.8
1.7
1.5
1.6
Inventory / Sales (days)
50
55
54
63
61
60
Receivables (days)
64
62
68
80
77
76
40
46
42
49
47
49
Payables (days)
WC cycle (ex-cash) (days)
68
70
75
79
82
80
Solvency ratios (x)
Net debt to equity
0.1
0.1
0.2
0.3
0.4
0.3
Net debt to EBITDA
0.5
0.5
0.8
1.5
2.4
1.2
4.2
10.7
6.8
10.7
5.7
15.9
Interest Coverage (EBIT / Int.)
November 24, 2017
11
Indoco Remedies |2QFY2018 Result Update
Research Team Tel: 022 - 39357800
DISCLAIMER
Angel Broking Private Limited (hereinafter referred to as “Angel”) is a registered Member of National Stock Exchange of
India Limited, Bombay Stock Exchange Limited and Metropolitan Stock Exchange of India Limited. It is also registered as a
Depository Participant with CDSL and Portfolio Manager with SEBI. It also has registration with AMFI as a Mutual Fund
Distributor. Angel Broking Private Limited is a registered entity with SEBI for Research Analyst in terms of SEBI (Research
Analyst) Regulations, 2014 vide registration number INH000000164. Angel or its associates has not been debarred/
suspended by SEBI or any other regulatory authority for accessing /dealing in securities Market. Angel or its associates
including its relatives/analyst do not hold any financial interest/beneficial ownership of more than 1% in the company
covered by Analyst. Angel or its associates/analyst has not received any compensation / managed or co-managed public
offering of securities of the company covered by Analyst during the past twelve months. Angel/analyst has not served as
an officer, director or employee of company covered by Analyst and has not been engaged in market making activity of
the company covered by Analyst.
This document is solely for the personal information of the recipient, and must not be singularly used as the basis of any
investment decision. Nothing in this document should be construed as investment or financial advice. Each recipient of this
document should make such investigations as they deem necessary to arrive at an independent evaluation of an
investment in the securities of the companies referred to in this document (including the merits and risks involved), and
should consult their own advisors to determine the merits and risks of such an investment.
Reports based on technical and derivative analysis center on studying charts of a stock's price movement, outstanding
positions and trading volume, as opposed to focusing on a company's fundamentals and, as such, may not match with a
report on a company's fundamentals.
The information in this document has been printed on the basis of publicly available information, internal data and other
reliable sources believed to be true, but we do not represent that it is accurate or complete and it should not be relied on
as such, as this document is for general guidance only. Angel Broking Pvt. Limited or any of its affiliates/ group companies
shall not be in any way responsible for any loss or damage that may arise to any person from any inadvertent error in the
information contained in this report. Angel Broking Pvt. Limited has not independently verified all the information contained
within this document. Accordingly, we cannot testify, nor make any representation or warranty, express or implied, to the
accuracy, contents or data contained within this document. While Angel Broking Pvt. Limited endeavors to update on a
reasonable basis the information discussed in this material, there may be regulatory, compliance, or other reasons that
prevent us from doing so.
This document is being supplied to you solely for your information, and its contents, information or data may not be
reproduced, redistributed or passed on, directly or indirectly.
Neither Angel Broking Pvt. Limited, nor its directors, employees or affiliates shall be liable for any loss or damage that may
arise from or in connection with the use of this information.
Note: Please refer to the important ‘Stock Holding Disclosure' report on the Angel website (Research Section). Also, please
refer to the latest update on respective stocks for the disclosure status in respect of those stocks. Angel Broking Pvt. Limited
Disclosure of Interest Statement
Indoco Remedies
1. Analyst ownership of the stock
No
2. Angel and its Group companies ownership of the stock
No
3. Angel and its Group companies' Directors ownership of the stock
No
4. Broking relationship with company covered
No
Note: We have not considered any Exposure below ` 1 lakh for Angel, its Group companies and Directors
Ratings (Based on expected returns
Buy (> 15%)
Accumulate (5% to 15%)
Neutral (-5 to 5%)
over 12 months investment period):
Reduce (-5% to -15%)
Sell (< -15)
November 24, 2017
12