3QFY2018 Result Update | IT
January 22, 2018
HCL Technologies
ACCUMULATE
CMP
`958
Performance Highlights
Target Price
`1,014
(` cr) - Consl.
3QFY18
2QFY18
% chg (qoq)
3QFY17
% chg (yoy)
Net revenue
12,808
12,434
3.0
11,814
8.4
Investment Period
12 Months
EBIT
2,509
2,451
2.4
2,408
4.2
Stock Info
EBIT margin (%)
19.6
19.7
(12)bp
20.4
(79)ps
Sector
IT
PAT
2,194
2,188
0.3
2,070
6.0
Market Cap (` cr)
133,335
Source: Company, Angel Research
Net Debt (` cr)
(12140)'
Beta
0.2
HCL Tech, for 3QFY2018 the sales came in at US$1,988mn (v/s US$1,977mn expected
52 Week High / Low
965/778
Avg. Daily Volume
151,423
and) v/s US$1,929mn in 2QFY2018, registering a qoq growth of 3.1%. In constant
Face Value (`)
2
Currency (CC) terms, the company posted a qoq growth of 3.3%. On EBIT front, the
BSE Sensex
35,512
company posted an EBIT of 19.6% (v/s 19.7% expected and) v/s 19.7% in 2QFY2018.
Nifty
10,895
Consequently, the PAT came in at `2,194cr (v/s `2,168cr expected and) v/s `2,188cr in
Reuters Code
HCLT.BO
Bloomberg Code
HCLT@IN
2QFY2018, growth of 0.3% qoq. In terms of guidance, the company expects FY'2018
revenues to grow between 10.5-12.5% in Constant Currency. Operating Margin (EBIT)
Shareholding Pattern (%)
for FY’2018 expected from 19.5% to 20.5%. We maintain our accumulate rating,
Promoters
60.1
MF / Banks / Indian Fls
10.5
Quarterly highlights: The sales came in at US$1,988mn (v/s US$1,977mn expected
FII / NRIs / OCBs
26.4
and) s/s US$1,929mn in 2QFY2018, registering a qoq growth of 3.1%. On constant
Indian Public / Others
3.0
Currency (CC) terms, the company posted a qoq growth of 3.3%. In terms of the
geography, the USA posted a qoq 4.9% CC growth, Europe posted a 1.9% qoq CC
Abs.(%)
3m
1yr
3yr
growth & ROW posted a 3.9% CC dip during the quarter. In terms, of the verticals,
Sensex
6.4
30.0
25.7
HCL Tech
13.6
13.5
16.3
Manufacturing, and Retail & CPG were the key growth driver for the company
registering a CC qoq growth of 6.6%. On EBIT front, the company posted an EBIT of
19.6% (v/s 19.7% expected and) v/s 19.7% in 2QFY2017. The margins held up only on
the back of 85.8% capacity utilization v/s 86.0% in 2QFY2018. Consequently, the PAT
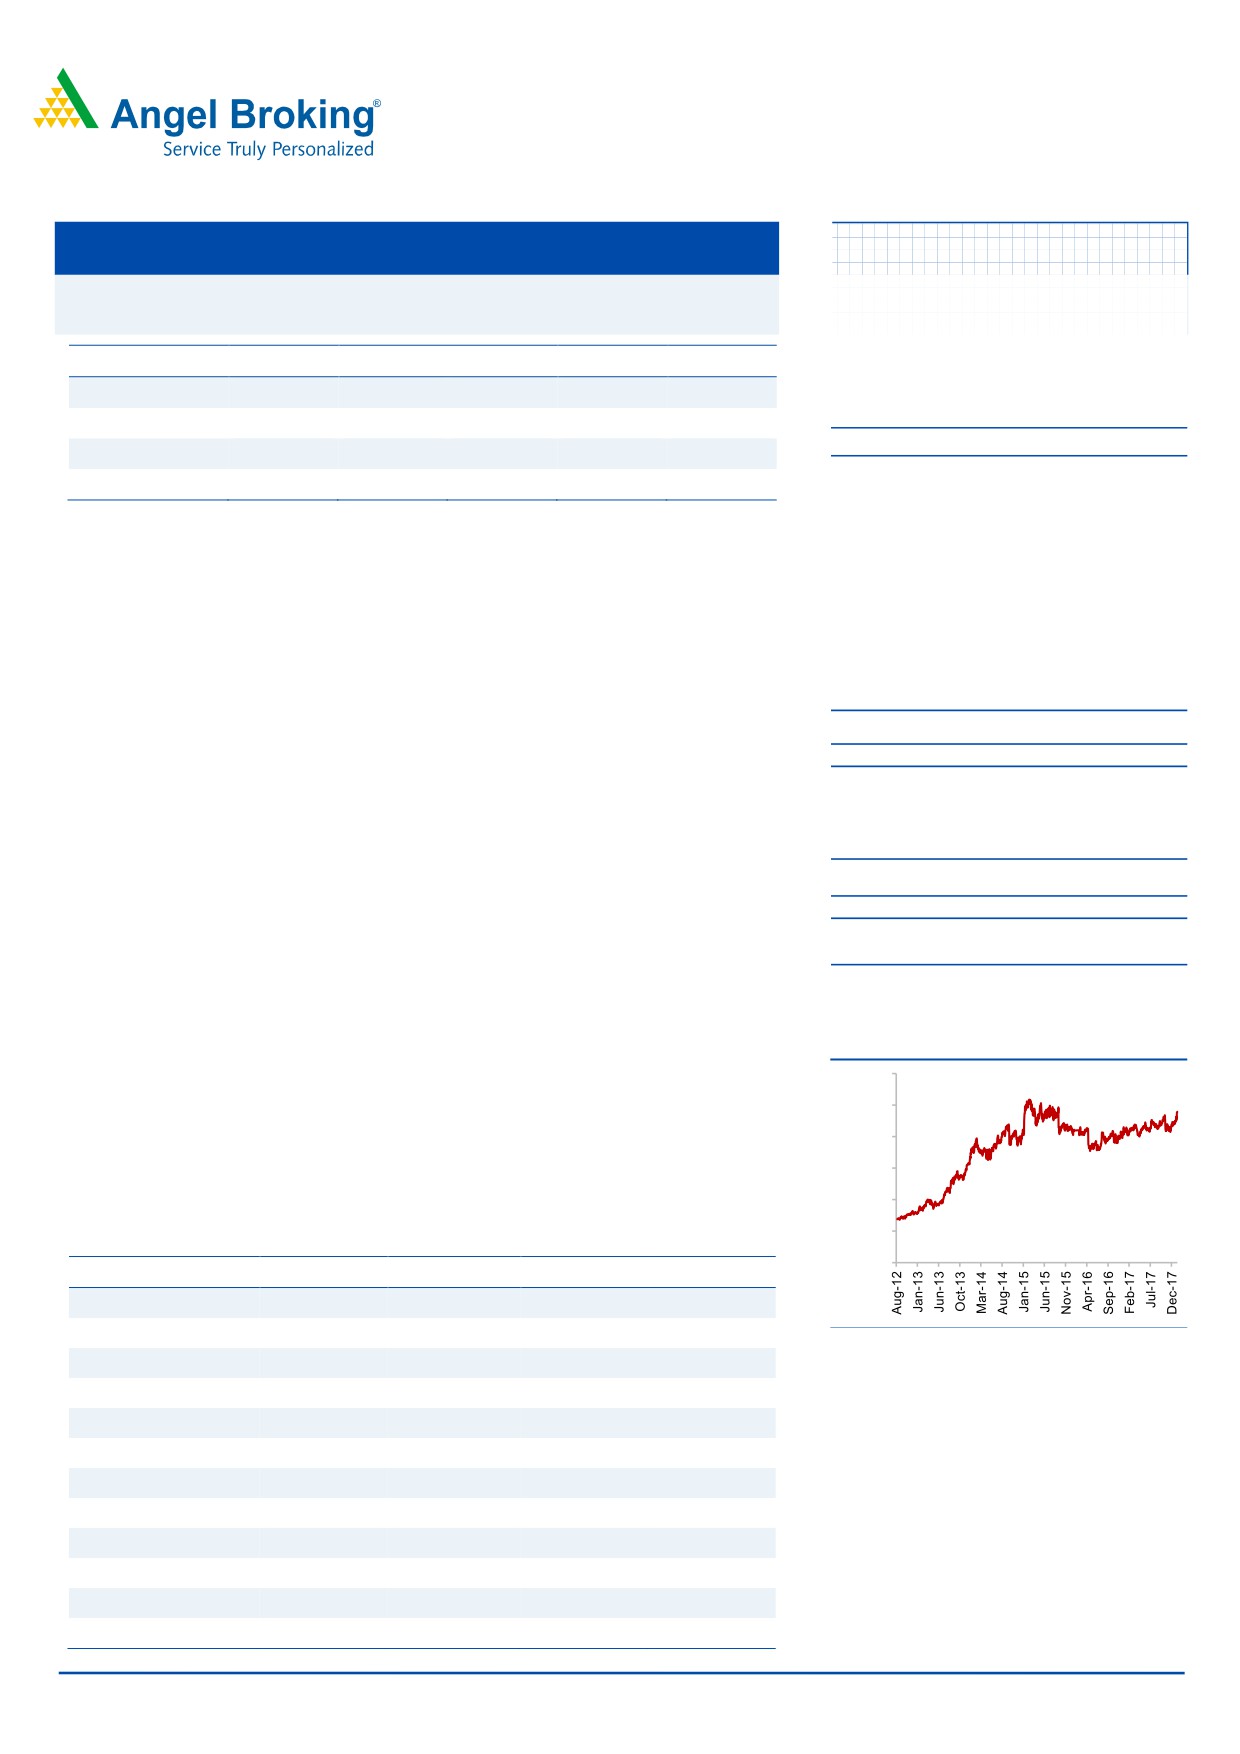
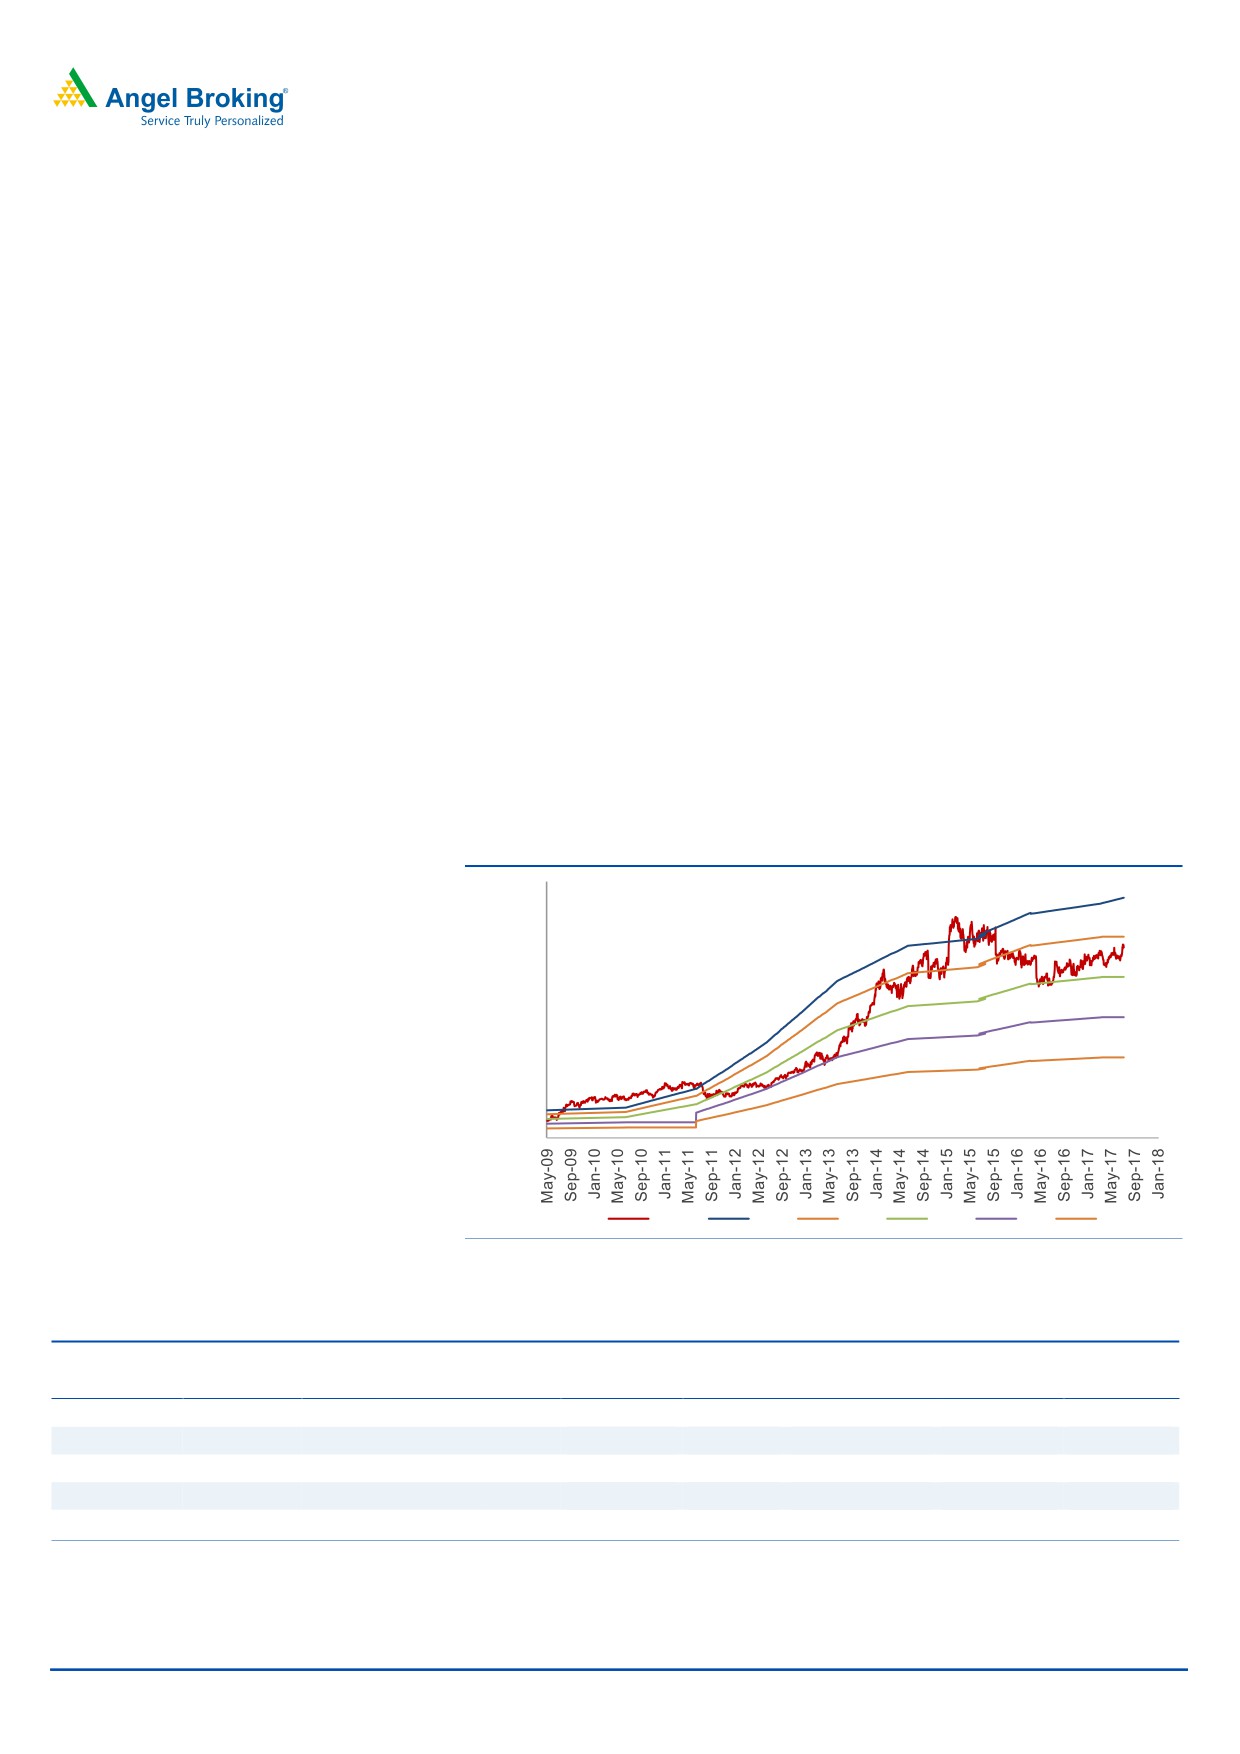
3-year price chart
came in at `2,194cr (v/s `2,168cr expected and) v/s `2,188cr in 2QFY2017, a growth of
1,200
0.3% qoq.
1,000
800
Outlook and valuation: We expect HCL Tech to post a USD and INR revenue CAGR of
600
9.7% and 8.2% respectively over FY2017-19E. On the back of strong order book and given
the attractive valuations, we recommend an Accumulate on the stock.
400
200
Key financials (Consolidated, US GAAP)
0
Y/E March (` cr)
FY2016
FY2017
FY2018E
FY2019E
Net sales
30,781
46,723
50,099
54,608
% chg
(16.9)
51.8
7.2
9.0
Source: Company, Angel Research
Net profit
5,643
8,457
8,857
9,534
% chg
(22.2)
49.9
4.7
7.6
EBITDA margin (%)
21.5
22.1
22.1
22.1
EPS (`)
40.0
60.0
62.8
67.6
P/E (x)
23.9
16.0
15.3
14.2
P/BV (x)
4.8
4.0
3.4
2.9
RoE (%)
20.1
25.3
22.4
20.6
Sarabjit kour Nangra
15.6
20.4
18.7
17.7
+91 22 3935 7800 Ext: 6806
RoCE (%)
4.0
2.6
2.3
2.0
EV/Sales (x)
EV/EBITDA (x)
18.5
11.7
10.4
9.1
Source: Company, Angel Research; Note: CMP as of January 19, 2018
Please refer to important disclosures at the end of this report
1
HCL Technologies | 3QFY2018 Result Update
Exhibit 1: 3QFY2018 performance (Consolidated, US GAAP)
Y/E March (` cr)
3QFY18
2QFY18
% chg (qoq)
3QFY17
% chg (yoy)
9MFY18
9MFY17
% chg(yoy)
Net revenue
12,808
12,434
3.0
11,814
8.4
37,391
34,670
7.8
Cost of revenue
8,412
8,208
2.5
7,809
7.7
24,677
24,540
0.6
Gross profit
4,396
4,226
4.0
4,005
9.8
12,714
10,130
25.5
SG&A expense
1,432
1,467
(2.4)
1,377
4.0
4,310
2,352
83.2
EBITDA
2,964
2,759
7.4
2,628
12.8
8,404
7,778
8.0
Dep. and amortization
455
308
47.7
220
106.8
999
569
75.6
EBIT
2,509
2,451
2.4
2,408
4.2
7,405
7,209
2.7
Other income
264
298
(11.4)
231
14.3
831
648
28.2
PBT
2,773
2,749
0.9
2,639
5.1
8,236
7,857
4.8
Income tax
579
561
3.2
568
1.9
1,683
1,662
1.3
PAT
2,194
2,188
0.3
2,070
6.0
6,553
6,195
5.8
Forex gain/(loss)
-
-
-
-
-
(61)
Adjusted PAT
2,194
2,188
0.3
2,070
6.0
6,553
6,133
6.8
EPS
15.6
15.5
0.4
14.7
6.0
46.5
43.5
6.8
Gross margin (%)
34.3
34.0
33bp
33.9
42bps
34.0
29.2
478bp
EBITDA margin (%)
23.1
22.2
95bp
22.2
90bps
22.5
22.4
4bp
EBIT margin (%)
19.6
19.7
(12)bp
20.4
(79)ps
19.8
20.8
(99)bp
PAT margin (%)
17.1
17.6
(47)bp
17.5
(39)bps
17.5
17.7
(16)bp
Source: Company, Angel Research
Exhibit 2: 3QFY2018 - Actual Vs Angel estimates
(` cr)
Actual
Estimate
Variation (%)
Net revenue
12,808
12,795
0.1
EBIDTA margin (%)
23.1
23.2
(5.8)bps
PAT
2,194
2,168
1.2
Source: Company, Angel Research
Sales just in line with expectation
The sales came in at US$1,988mn (v/s US$1,977mn expected and) v/s US$1,929mn
in 2QFY2018, registering a qoq growth of 3.1%. In constant Currency (CC) terms,
the company posted a qoq growth of 3.3%. In Rupee terms, revenues came in at
`12,808cr v/s. `12,795cr, up 3.0% qoq.
In terms, of the geography the USA posted a qoq 4.9% CC growth, Europe posted
a 1.9% qoq CC growth & ROW posted a 3.9% CC dip during the quarter.
In terms of the verticals, the Manufacturing, and Retail & CPG were the key growth
driver for the company registering a CC qoq growth of 6.6%. FSI posted qoq growth
of 1.4%, Public Services grew by 0.2% qoq, Life Sciences and Health grew by 2.4%
qoq and Telecommunications, Media, Publishing & Entertainment de-grew by 3.8%
qoq.
January 22 2018
2
HCL Technologies | 3QFY2018 Result Update
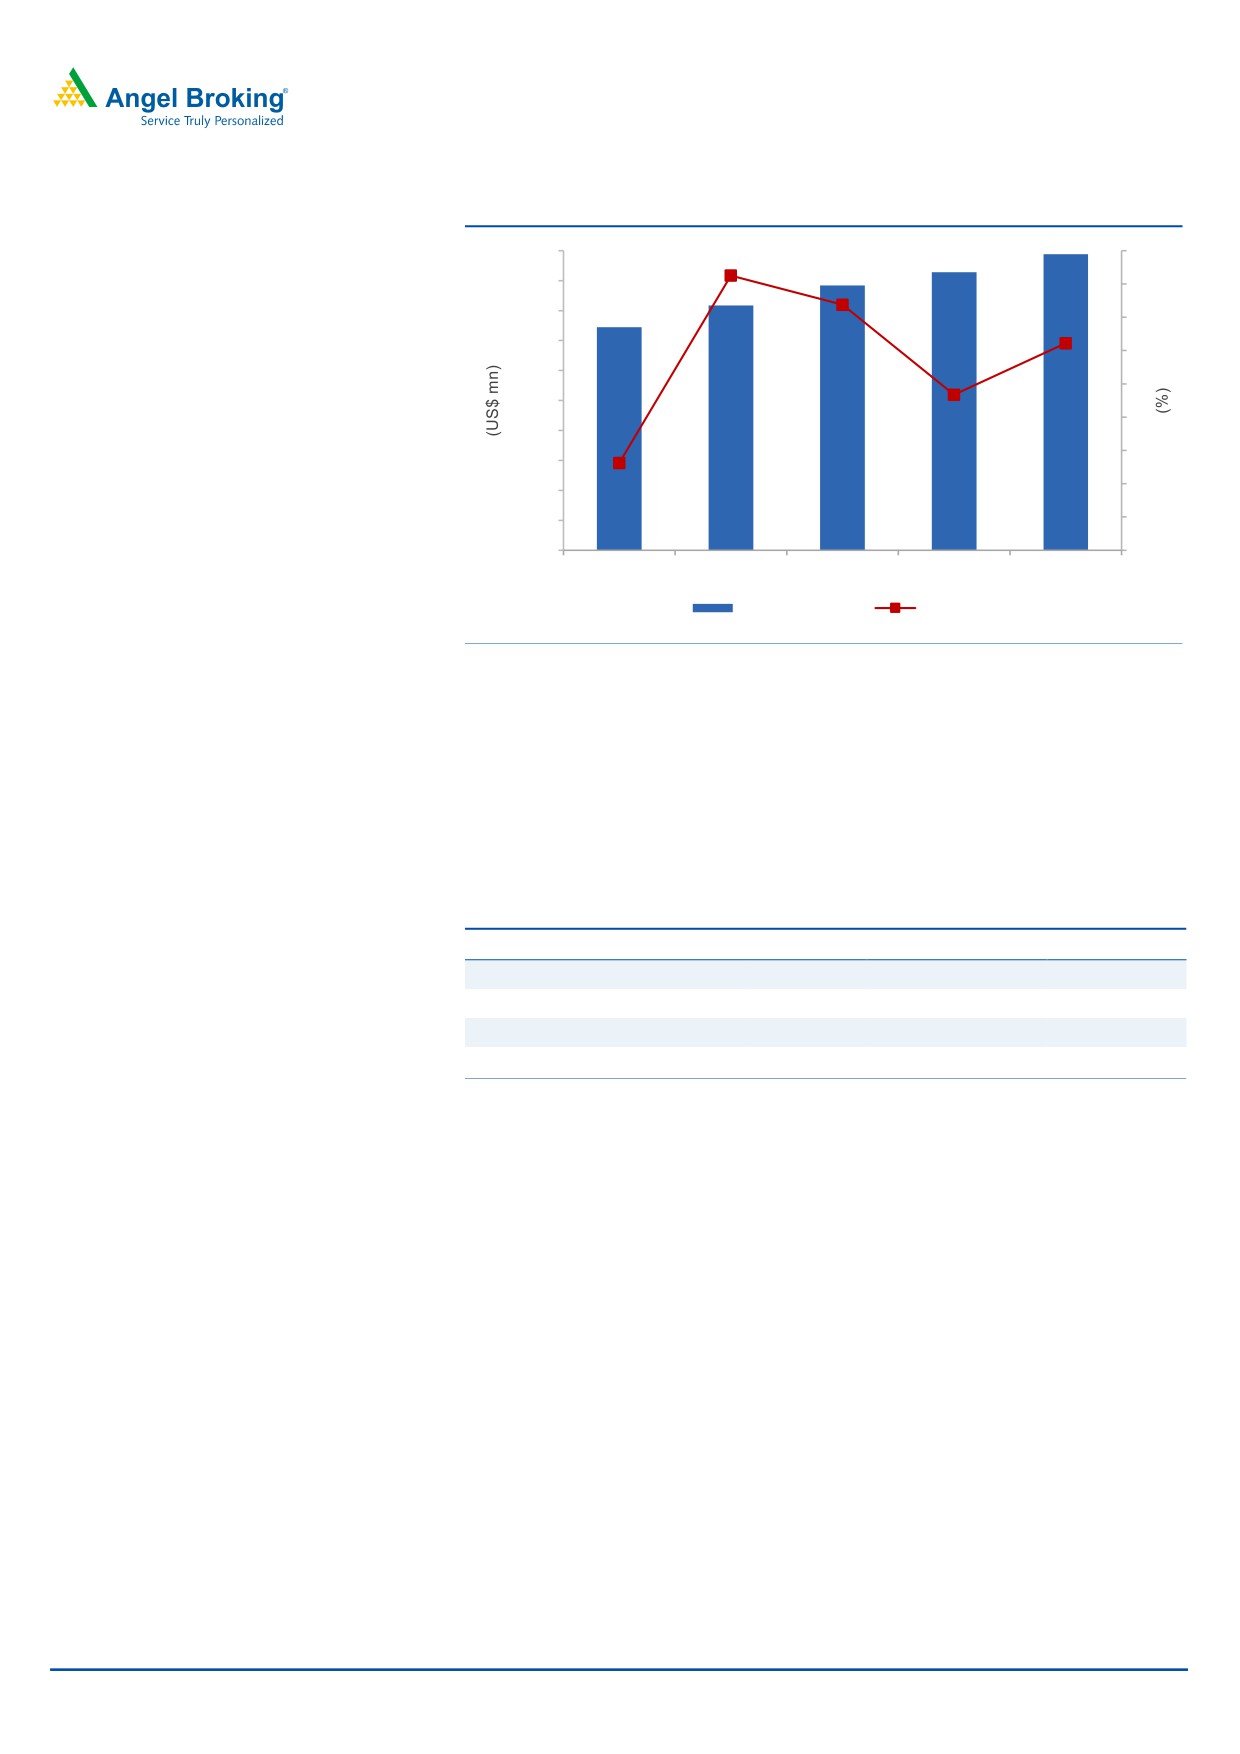
Exhibit 3: Revenue growth trend
2,000
5
1,900
4.1
4
1,800
3.7
4
1,700
3.1
3
1,600
3
1,500
2.3
2
1,400
2
1,300
1.3
1
1,200
1,100
1
1,745
1,817
1,884
1,928
1,988
1,000
0
3QFY17
4QFY17
1QFY2018
2QFY2018
3QFY18
Revenue (USD)
qoq growth (%)
Source: Company, Angel Research
In terms of services, Engineering & R&D services (which constituted 24.2% of sales)
posted a growth of 13.6% qoq (CC), while Application services (accounting for
35.3% of sales) grew by 1.6% qoq (CC). Infrastructure services, another important
segment of the company, which contributes around 36.7% to overall sales, posted
de-growth of 1.2% qoq (CC). Business services, which constituted 3.7% of sales,
grew by 5.0% qoq (CC).
Exhibit 4: Revenue growth trend (Service wise)
% of revenue
% growth CC (qoq) % growth (yoy)
Application services
35.3
1.6
4.4
Infrastructure services
36.7
(1.2)
1.6
Business services
3.7
5.0
1.2
Engineering and R&D services
24.2
13.6
47.7
Source: Company, Angel Research
Industry segment wise, the company’s Financial Services vertical (contributing
24.6% to revenue) posted a 1.4% qoq growth in CC terms. The Manufacturing
vertical (contributing 36.5% to revenue) posted a 6.6% qoq growth in CC terms.
Public services, Life Sciences & Healthcare, and Telecommunication, Media,
Publishing & Entertainment reported a qoq growth of 0.2%, 2.4% and (3.8) %
respectively, all in CC terms. Retail & CPG (contributing 9.6% of the revenue), on
the other hand, reported growth of 6.6% qoq in CC terms during the quarter.
January 22 2018
3
HCL Technologies | 3QFY2018 Result Update
Exhibit 5: Revenue growth trend (Industry wise)
% of revenue
% growth (CC qoq)
% growth (yoy)
Financial services
24.6
1.4
10.6
Manufacturing
36.5
6.6
21.0
Life sciences & Healthcare
11.7
2.4
9.7
Public Services
10.2
0.2
1.0
Retail & CPG
9.6
6.6
13.1
Telecom, MPE
7.4
(3.8)
(6.8)
Source: Company, Angel Research
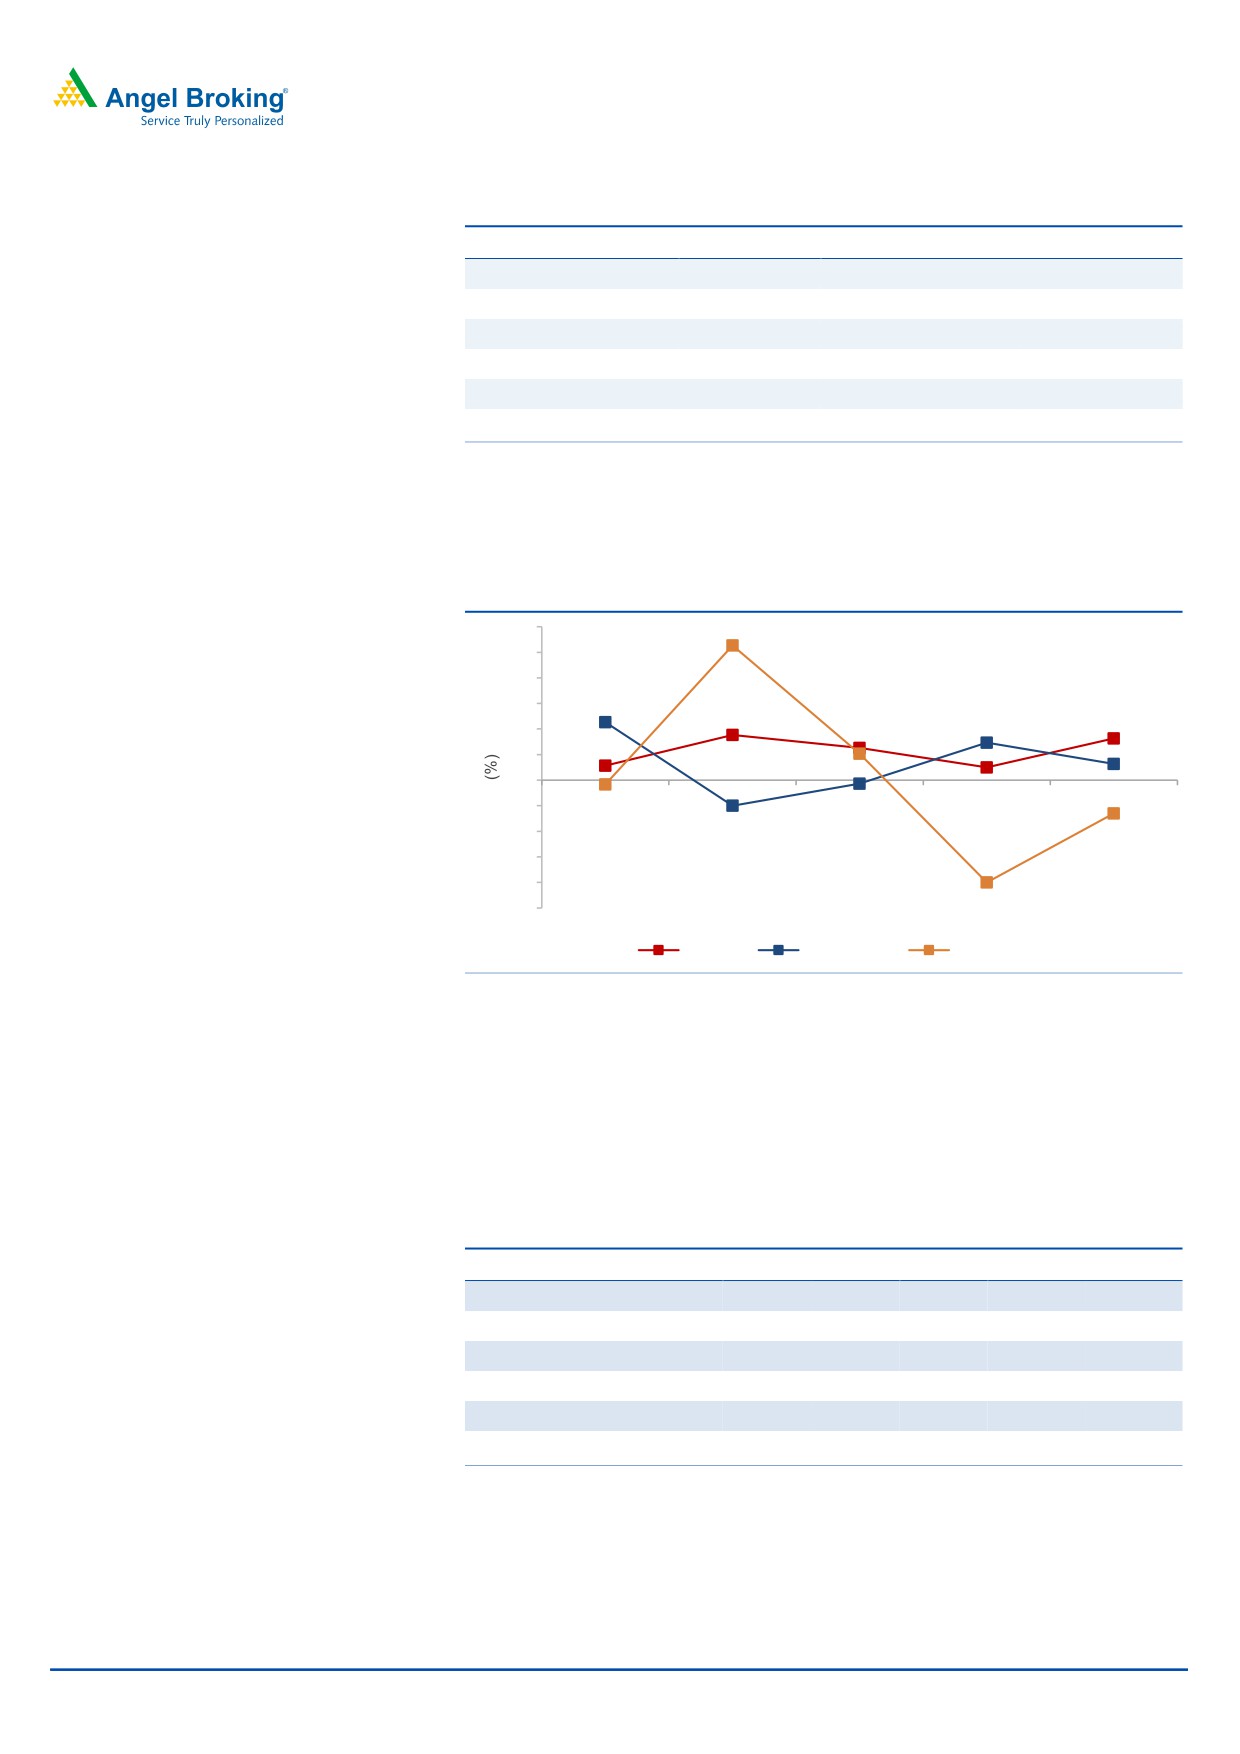
Among geographies, in CC terms, America grew by 4.9% qoq, RoW de-grew by
3.9% qoq, and Europe grew 1.9% qoq during the period.
Exhibit 6: Revenue growth trend (Geography wise in CC terms)
18
15.8
15
12
6.8
9
6
3.8
4.9
1.9
5.3
1
.5
3
(
0.4)
4.4
0
1.7
3.1
(3.0)
(3)
(0.5)
(6)
(9)
(12.0)
(3.9)
(12)
(15)
3QFY17
4QFY17
1QFY2018
2QFY2018
3QFY18
US
Europe
Rest of the world
Source: Company, Angel Research
Hiring and utilization
During the quarter, the overall headcount of HCL Tech increased by 10,460 to
1,19,291 employees. The attrition rate in IT Services inched downwards to 15.2%
(v/s. 15.7% in 3QFY2018) and the blended utilization level of the company remained
stagnant at 85.8% (86.0% in 2QFY2018).
Exhibit 7: Hiring trend
Particulars
3QFY17 4QFY17 1QFY18
2QFY18
3QFY18
Technical
1,01,154
1,05,547
1,07,029
1,08,351
1,08,831
Support
9,938
10,426
10,752
10,689
10,460
Total employee base
1,11,092
1,15,973
1,17,781
1,19,040
1,19,291
Gross addition
8,467
10,605
9,462
8,645
7,113
Net addition
3,124
6,178
1,808
1,259
251
Attrition - IT services (LTM) - %
17.9
16.9
16.2
15.7
15.2
Source: Company, Angel Research
January 22 2018
4
HCL Technologies | 3QFY2018 Result Update
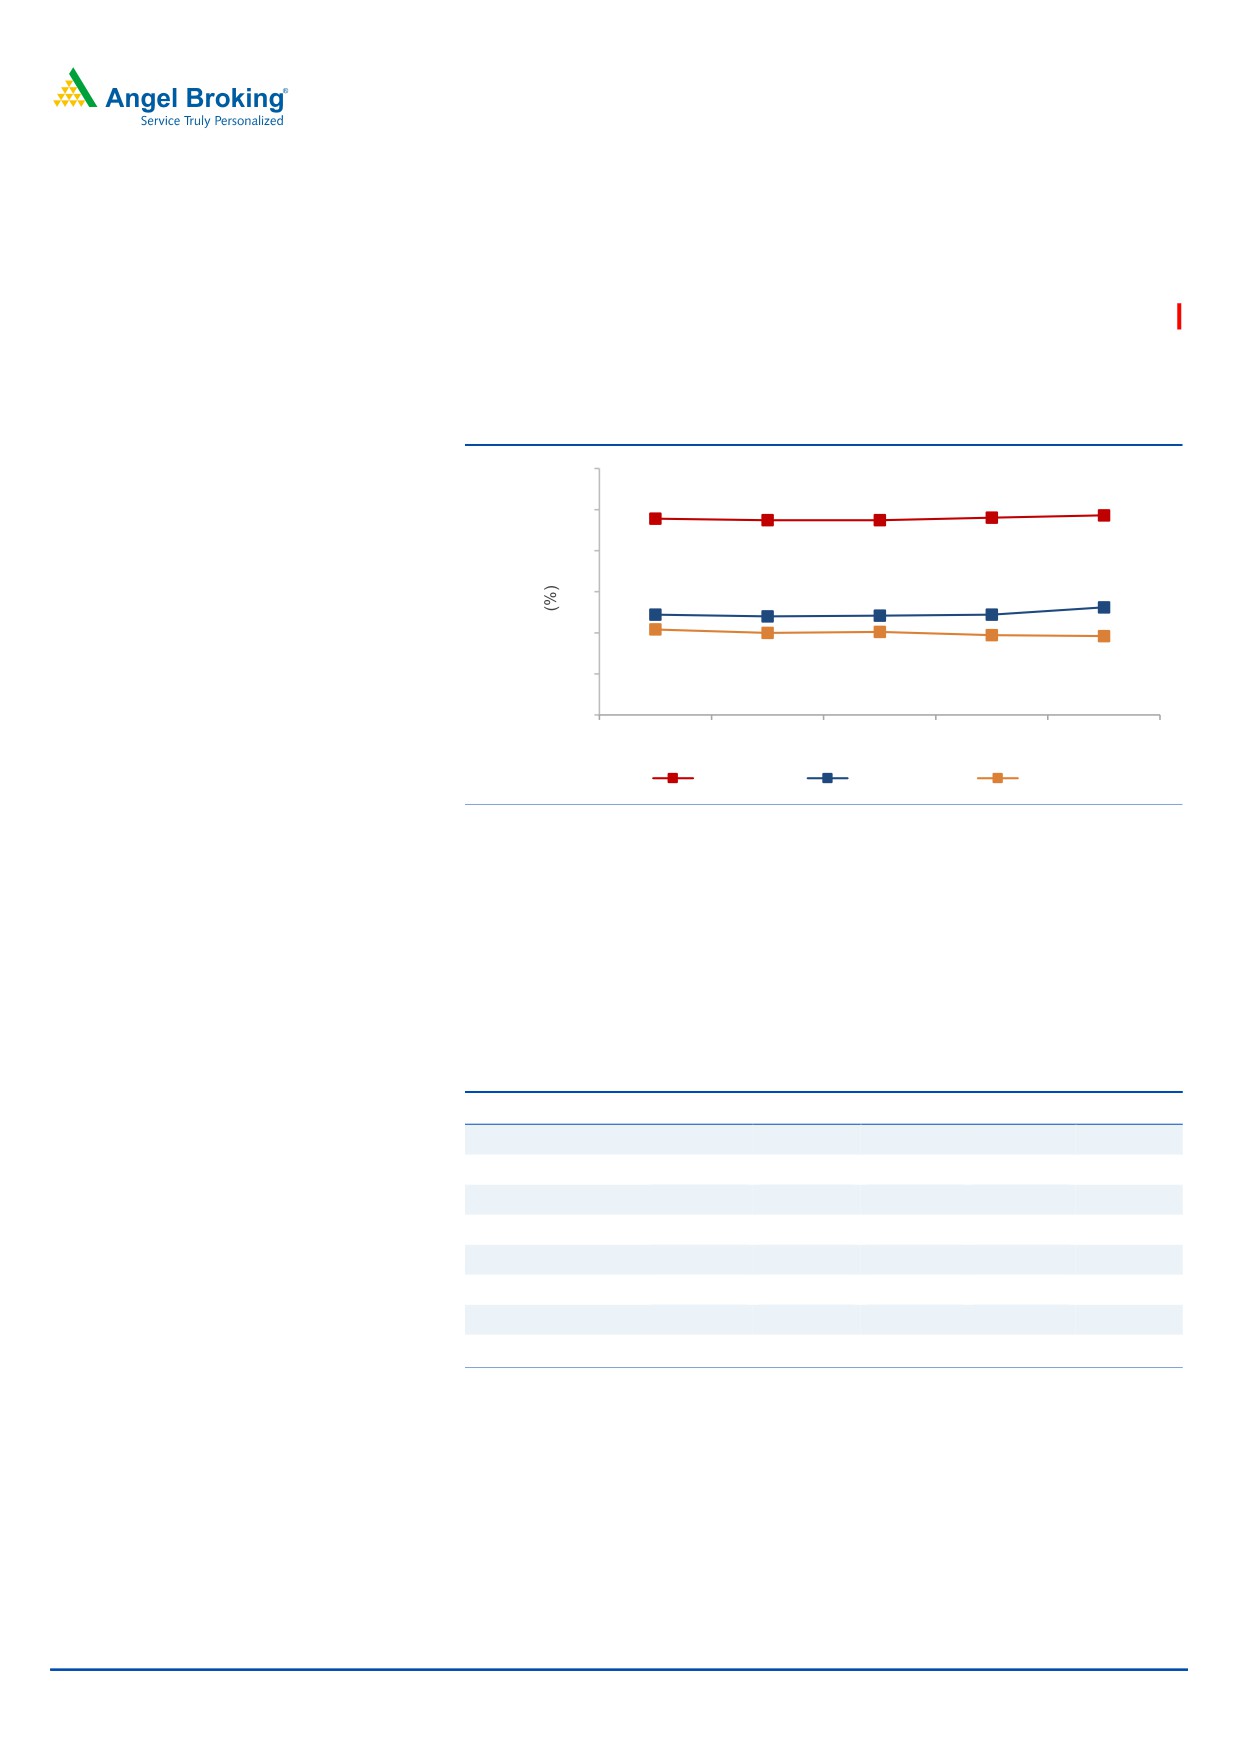
Operating margin better than expectation
On the operating front, the EBDITA margins came in at 23.1% (v/s. 22.2% in
2QFY2018), a qoq expansion of 95bps, while the EBIT margins came in at 19.6%, a
qoq dip of 12bps. This was against the EBDITA margin expectations of 23.0%
,
mainly on account of an increase of 100bp in depreciation and amortization
expense.
Exhibit 8: Margin profile
40
34.0
34.3
33.9
33.7
33.7
35
30
23.1
25
22.2
22.0
22.1
22.2
20
20.0
20.1
20.4
19.7
19.6
15
10
3QFY17
4QFY17
1QFY18
2QFY18
3QFY18
Gross margin
EBITDA margin
EBIT margin
Source: Company, Angel Research
Client pyramid
The company signed
20 transformational deals this quarter. These deals
represented a well-balanced mix across service lines, industry verticals and
geographies. Company added 3 clients each in the US$5+ mn and US$40+ mn
categories.
Exhibit 9: Client pyramid
Particulars
3QFY17
4QFY17
1QFY18
2QFY18
3QFY18
US$1mn-5mn
259
260
259
277
291
US$5mn-10mn
89
93
95
102
105
US$10mn-20mn
64
68
68
73
71
US$20mn-30mn
33
36
34
32
29
US$30mn-40mn
15
15
17
15
16
US$40mn-50mn
14
9
10
12
15
US$50mn-100mn
12
17
17
16
16
US$100mn plus
8
8
8
9
9
Source: Company, Angel Research
January 22 2018
5
HCL Technologies | 3QFY2018 Result Update
Investment arguments
Robust outlook re-iterated for FY2018: On the basis of deals on hand, the
company gave a revenue growth guidance of 10.5-12.5% in CC terms for FY2018,
which includes a component of inorganic growth, adjusting for which, the organic
growth would be in the range of 7.5-9.5% in CC for FY2018. The operating margin
(EBIT) for FY2018 is expected to be in the range of 19.5-20.5%. We expect HCL Tech
to post a USD and INR revenue CAGR of 9.7% and 8.2% respectively, over FY2017-
19E (inclusive of the acquisition of Geometric Software and Volvo deal).
Healthy pipeline: HCL Tech signed 20 transformational deals this quarter, across
service lines and industry verticals. The broad-based business wins were driven by
next-generation integrated offerings or Next-Gen ITO, BEYONDigital, and IoT
WoRKS, reflecting investments in Internet of Things, digital technologies, cloud,
automation and artificial intelligence. Company added 3 clients each in the US$5+
mn and US$40+ mn categories.
Outlook and valuation
We expect the EBIT and PAT to post 7.7% and 6.2% CAGR respectively over FY2017-
19E. At the current market price, the stock is trading at 15.3x FY2018E and 14.2x
FY2019E EPS. We recommend a Buy on the stock, with a Target Price of `1,014.
Exhibit 10: One-year forward PE (x) chart
1,200
1,000
800
600
400
200
0
Price
18x
15x
12x
9x
6x
Source: Company, Angel Research
Exhibit 11: Recommendation summary
Company
Reco
CMP Tgt Price Upside
FY2019E
FY2019E
FY2017-19E
FY2019E
FY2019E
(`)
(`)
(%)
EBITDA (%)
P/E (x)
EPS CAGR (%) EV/Sales (x)
RoE (%)
HCL Tech
Accumulate
958
1,014
5.9
22.1
14.2
6.2
1.9
20.6
Infosys
Neutral
1150
-
-
26.5
17.1
3.8
2.8
18.7
TCS
Sell
3,113
2,493
(19.9)
26.3
21.2
3.4
4.0
28.3
Tech Mahindra Reduce
570
526
(7.7)
15.0
15.1
8.6
1.4
16.2
Wipro
Reduce
321
280
(12.7)
22.3
16.5
4.4
1.9
13.6
Source: Company, Angel Research
January 22 2018
6
HCL Technologies | 3QFY2018 Result Update
Company Background
HCL Tech is India's fifth largest IT services company, with over 1,00,000 employees
catering to more than 450 clients. The company's service offerings include
Enterprise Application Services (EAS), Custom Applications, Engineering Research
& Development (ERD), and Infrastructure Management Services (IMS). In December
2008, HCL Tech acquired UK-based SAP consulting company - Axon, which now
contributes ~10% to its consolidated revenue. Recently, during 3QFY2016, the
company acquired Geometric Software.
January 22 2018
7
HCL Technologies | 3QFY2018 Result Update
Profit and loss statement (Consolidated, US GAAP)
Y/E Mar (` cr)
FY2015
FY2016
FY2017
FY2018E
FY2019E
Net sales
37,061
30,781
46,723
50,099
54,608
Cost of revenues
23,798
20,235
30,890
33,116
36,096
Gross profit
13,263
10,546
15,833
16,984
18,512
% of net sales
35.8
34.3
33.9
33.9
33.9
SG&A expenses
4,563
3,940
5,524
5,912
6,444
% of net sales
12.3
12.8
11.8
11.8
11.8
EBITDA
8,700
6,606
10,309
11,072
12,068
% of net sales
23.5
21.5
22.1
22.1
22.1
Depreciation and amort.
451
393
835
935
1085
% of net sales
1.2
1.3
1.8
1.9
2.0
EBIT
8,249
6,213
9,474
10,137
10,983
% of net sales
22.3
20.2
20.3
20.2
20.1
Other income, net
912
756
934
934
934
Profit before tax
9,161
6,969
10,408
11,071
11,917
Provision for tax
1,908
1,364
1,952
2,214
2,383
% of PBT
20.8
19.6
18.8
20.0
20.0
PAT
7,253
5,605
8,457
8,857
9,534
Share from equity invest.
-
-
-
-
-
Forex loss
-
-
-
-
-
ESOP charges
103
38
-
-
-
Reported net profit
7,253
5,643
8,457
8,857
9,534
Fully diluted EPS (`)
51.4
40.0
60.0
62.8
67.6
Note: FY2016 Numbers are 9 month figures
January 22 2018
8
HCL Technologies | 3QFY2018 Result Update
Balance sheet (Consolidated, US GAAP)
Y/E Mar (` cr)
FY2015 FY2016 FY2017 FY2018E FY2019E
Cash and cash equivalent
1,352
729
1,317
1,484
1,680
Account receivables, net
6,563
7,721
8,301
8,652
9,431
Unbilled receivables
2,923
3,002
2,501
3,006
3,276
Deposit with banks
9,670
10,587
10,220
14,102
20,059
Deposit (one year with HDFC ltd)
-
-
-
-
-
Invest. securities, available for sale
767
537
1,146
2,250
2,251
Other current assets
2,338
2,410
2,983
3,283
3,583
Total current assets
23,613
24,986
26,468
32,778
40,281
Property and equipment, net
3,820
4,323
4,681
4,981
5,281
Intangible assets, net
5,204
6,419
11,426
11,426
11,426
Deposits with HDFC Ltd.
-
-
-
-
-
Fixed deposits with banks
-
-
-
-
-
Investment securities HTM
8
160
147
147
147
Investment in equity investee
-
-
-
-
-
Other assets
3,066
3,879
3,712
4,780
4,780
Total assets
35,711
39,768
46,432
54,110
61,914
Current liabilities
9,232
9,509
11,148
11,948
13,023
Borrowings
469
973
542
542
542
Other liabilities
1,259
1,264
1,253
2,078
2,078
Total liabilities
10,960
11,745
12,942
14,568
15,643
Minority interest
-
-
-
-
Total stockholder equity
24,751
28,022
33,490
39,542
46,271
Total liab. and stock holder equity
35,711
39,767
46,432
54,110
61,914
Note: FY2016 Numbers are 9 month figures
January 22 2018
9
HCL Technologies | 3QFY2018 Result Update
Cash flow statement (Consolidated, US GAAP)
Y/E Mar (` cr)
FY2015
FY2016
FY2017
FY2018E
FY2019E
Pre tax profit from operations
7,253
5,643
8,457
8,857
9,534
Depreciation
451
393
835
935
1,085
Expenses (deffered)/written off/others
(168)
(48)
(48)
(48)
(48)
Pre tax cash from operations
7,536
5,988
9,244
9,744
10,571
Other income/prior period ad
912
756
934
934
934
Net cash from operations
8,448
6,744
10,178
10,678
11,505
Tax
(1,908)
(1,364)
(1,952)
(2,214)
(2,383)
Cash profits
6,540
5,381
8,226
8,464
9,121
(Inc)/dec in current assets
(1,991)
(1,309)
(653)
(1,156)
(1,349)
Inc/(dec) in current liabilties
1,035
277
1,639
800
1,075
Net trade working capital
(956)
(1,033)
987
(355)
(274)
Cashflow from operating activities
5,584
4,348
9,213
8,108
8,848
(Inc)/dec in fixed assets
(674)
(503)
(358)
(300)
(300)
(Inc)/dec in intangibles
(55)
(1,215)
(5,006)
-
-
(Inc)/dec in investments
(1,458)
(687)
(242)
(4,987)
(5,958)
(Inc)/dec in minority interest
-
-
-
-
-
Inc/(dec) in non current liabilities
(203)
5
(11)
-
-
(Inc)/dec in non current assets
(214)
(72)
(573)
(300)
(300)
Cashflow from investing activities
(2,602)
(2,473)
(6,189)
(5,587)
(6,558)
Inc/(dec) in debt
-
-
-
-
-
Inc/(dec) in equity/premium
-
-
-
-
-
ESOP charges
(103)
(103)
(103)
(103)
(103)
Dividends
(1,651)
(2,805)
(2,805)
(2,805)
(2,805)
Others
(208)
2,385
614
1,703
2,103
Cashflow from financing activities
(1,962)
(523)
(2,294)
(1,205)
(805)
Cash generated/(utilised)
331
(623)
587
168
196
Cash at start of the year
1,021
1,352
729
1,317
1,484
Cash at end of the year
1,352
729
1,317
1,484
1,680
Note: FY2016 Numbers are 9 month figures
January 22 2018
10
HCL Technologies | 3QFY2018 Result Update
Key ratios
Y/E Mar
FY2015
FY2016
FY2017 FY2018E FY2019E
Valuation ratio (x)
P/E (on FDEPS)
18.6
23.9
16.0
15.3
14.2
P/CEPS
17.5
22.4
14.5
13.8
12.7
P/BVPS
5.5
4.8
4.0
3.4
2.9
Dividend yield (%)
1.5
1.8
1.8
1.8
1.8
EV/Sales
3.3
4.0
2.6
2.3
2.0
EV/EBITDA
14.0
18.5
11.7
10.4
9.1
EV/Total assets
3.4
3.1
2.6
2.1
1.8
Per share data (`)
EPS (Fully diluted)
51.4
40.0
60.0
62.8
67.6
Cash EPS
54.6
42.8
65.9
69.4
75.3
Dividend
14.0
17.0
17.0
17.0
17.0
Book value
175
199
237
280
328
Dupont analysis
Tax retention ratio (PAT/PBT)
0.8
0.8
0.8
0.8
0.8
Cost of debt (PBT/EBIT)
1.1
1.1
1.1
1.1
1.1
EBIT margin (EBIT/Sales)
0.2
0.2
0.2
0.2
0.2
Asset turnover ratio (Sales/Assets)
1.0
0.8
1.0
0.9
0.9
Leverage ratio (Assets/Equity)
1.4
1.4
1.4
1.4
1.3
Operating ROE
29.3
20.0
25.3
22.4
20.6
Return ratios (%)
RoCE (pre-tax)
23.1
15.6
20.4
18.7
17.7
Angel RoIC
34.5
22.4
28.2
28.1
29.1
RoE
29.3
20.1
25.3
22.4
20.6
Turnover ratios (x)
Asset turnover (fixed assets)
10.6
7.6
10.4
10.4
10.6
Receivables days
68
83
78
65
66
Note: FY2016 Numbers are 9 month figures
January 22 2018
11
HCL Technologies | 3QFY2018 Result Update
Research Team Tel: 022 - 39357800
DISCLAIMER
Angel Broking Private Limited (hereinafter referred to as “Angel”) is a registered Member of National Stock Exchange of India Limited,
Bombay Stock Exchange Limited and Metropolitan Stock Exchange Limited. It is also registered as a Depository Participant with CDSL
and Portfolio Manager with SEBI. It also has registration with AMFI as a Mutual Fund Distributor. Angel Broking Private Limited is a
registered entity with SEBI for Research Analyst in terms of SEBI (Research Analyst) Regulations, 2014 vide registration number
INH000000164. Angel or its associates has not been debarred/ suspended by SEBI or any other regulatory authority for accessing
/dealing in securities Market. Angel or its associates/analyst has not received any compensation / managed or co-managed public
offering of securities of the company covered by Analyst during the past twelve months.
This document is solely for the personal information of the recipient, and must not be singularly used as the basis of any investment
decision. Nothing in this document should be construed as investment or financial advice. Each recipient of this document should make
such investigations as they deem necessary to arrive at an independent evaluation of an investment in the securities of the companies
referred to in this document (including the merits and risks involved), and should consult their own advisors to determine the merits
and risks of such an investment.
Reports based on technical and derivative analysis center on studying charts of a stock's price movement, outstanding positions and
trading volume, as opposed to focusing on a company's fundamentals and, as such, may not match with a report on a company's
fundamentals. Investors are advised to refer the Fundamental and Technical Research Reports available on our website to evaluate the
contrary view, if any.
The information in this document has been printed on the basis of publicly available information, internal data and other reliable
sources believed to be true, but we do not represent that it is accurate or complete and it should not be relied on as such, as this
document is for general guidance only. Angel Broking Pvt. Limited or any of its affiliates/ group companies shall not be in any way
responsible for any loss or damage that may arise to any person from any inadvertent error in the information contained in this report.
Angel Broking Pvt. Limited has not independently verified all the information contained within this document. Accordingly, we cannot
testify, nor make any representation or warranty, express or implied, to the accuracy, contents or data contained within this document.
While Angel Broking Pvt. Limited endeavors to update on a reasonable basis the information discussed in this material, there may be
regulatory, compliance, or other reasons that prevent us from doing so.
This document is being supplied to you solely for your information, and its contents, information or data may not be reproduced,
redistributed or passed on, directly or indirectly.
Neither Angel Broking Pvt. Limited, nor its directors, employees or affiliates shall be liable for any loss or damage that may arise from
or in connection with the use of this information.
Disclosure of Interest Statement
HCL Technologies
1. Financial interest of research analyst or Angel or his Associate or his relative
No
2. Ownership of 1% or more of the stock by research analyst or Angel or associates or relatives
No
3. Served as an officer, director or employee of the company covered under Research
No
4. Broking relationship with company covered under Research
No
Ratings (Based on expected returns
Buy (> 15%)
Accumulate (5% to 15%)
Neutral (-5 to 5%)
over 12 months investment period):
Reduce (-5% to -15%)
Sell (< -15)
January 22 2018
12