2QFY2018 Result Update | Pharmaceutical
November 24, 2017
Cadila Healthcare
REDUCE
CMP
`443
Performance Highlights
Target Price
`411
Y/E March (` cr)
2QFY2018 1QFY2018
% chg (qoq) 2QFY2017
% chg (yoy)
Investment Period
3,155
2,136
47.7
2336
35.0
Net sales
102
83
23.0
40
151.5
Other income
Stock Info
2054
1014
102.6
1535
33.8
Gross profit
Sector
Pharmaceutical
778
216
260.7
499
55.8
Operating profit
Market Cap (` cr)
45,321
Adj. Net profit
503
138
263.7
380
32.5
Net debt (` cr)
3,616
Source: Company, Angel Research
Beta
1.0
Cadila Healthcare posted good set of numbers for 2QFY2018. Sales came in at
52 Week High / Low
558 / 330
`3,155cr (`2,800cr expected) v/s. `2,336cr in 2QFY2017, a yoy growth of 35.0%,
Avg. Daily Volume
116,575
mainly driven by 66.2% growth in sales of US formulations. On operating front,
Face Value (`)
1
the EBITDA margins came in at 24.7% (21.3% expected) v/s. 21.4% in 2QFY2017,
BSE Sensex
33,562
on the back of higher than expected sales. Thus, the PAT came in at ` 503cr V/s
Nifty
10,342
`414cr expected. We maintain reduce with a price target of `411.
Reuters Code
CADI.BO
Bloomberg Code
CDH@IN
Results better than expected: Sales came in at `3,155cr (`2,800cr expected) v/s.
`2,336cr in 2QFY2017, a yoy growth of 35.0%, mainly driven by 66.2% yoy growth
in sales of US formulations to `1644cr. On operating front, the EBITDA margins
Shareholding Pattern (%)
came in at 24.7% (21.3% expected) v/s. 21.4% in 2QFY2017, on the back of
Promoters
74.8
higher than expected sales. Thus, the PAT came in at ` 503cr v/s `414cr
MF / Banks / Indian Fls
10.0
expected. Gross margins came in at 65.1% v/s. 65.7% in 2QFY2017, while R&D
FII / NRIs / OCBs
10.0
expenses were 8.7% of sales in 2QFY2018 v/s. 7.8% of sales in 2QFY2017. Thus,
Indian Public / Others
5.2
the PAT came in at ` 503cr (` 414cr expected) v/s. `380cr in 2QFY2017.
Outlook and valuation: We expect Cadila’s net sales to post 18.4% CAGR to
Abs.(%)
3m 1yr 3yr
`12,926cr and EPS to register 18.9% CAGR to `20.5 over FY2017-19E. We maintain
Sensex
6.3
29.3
17.8
Cadila
(4.3)
19.3
42.8
reduce rating.
Key financials (Consolidated)
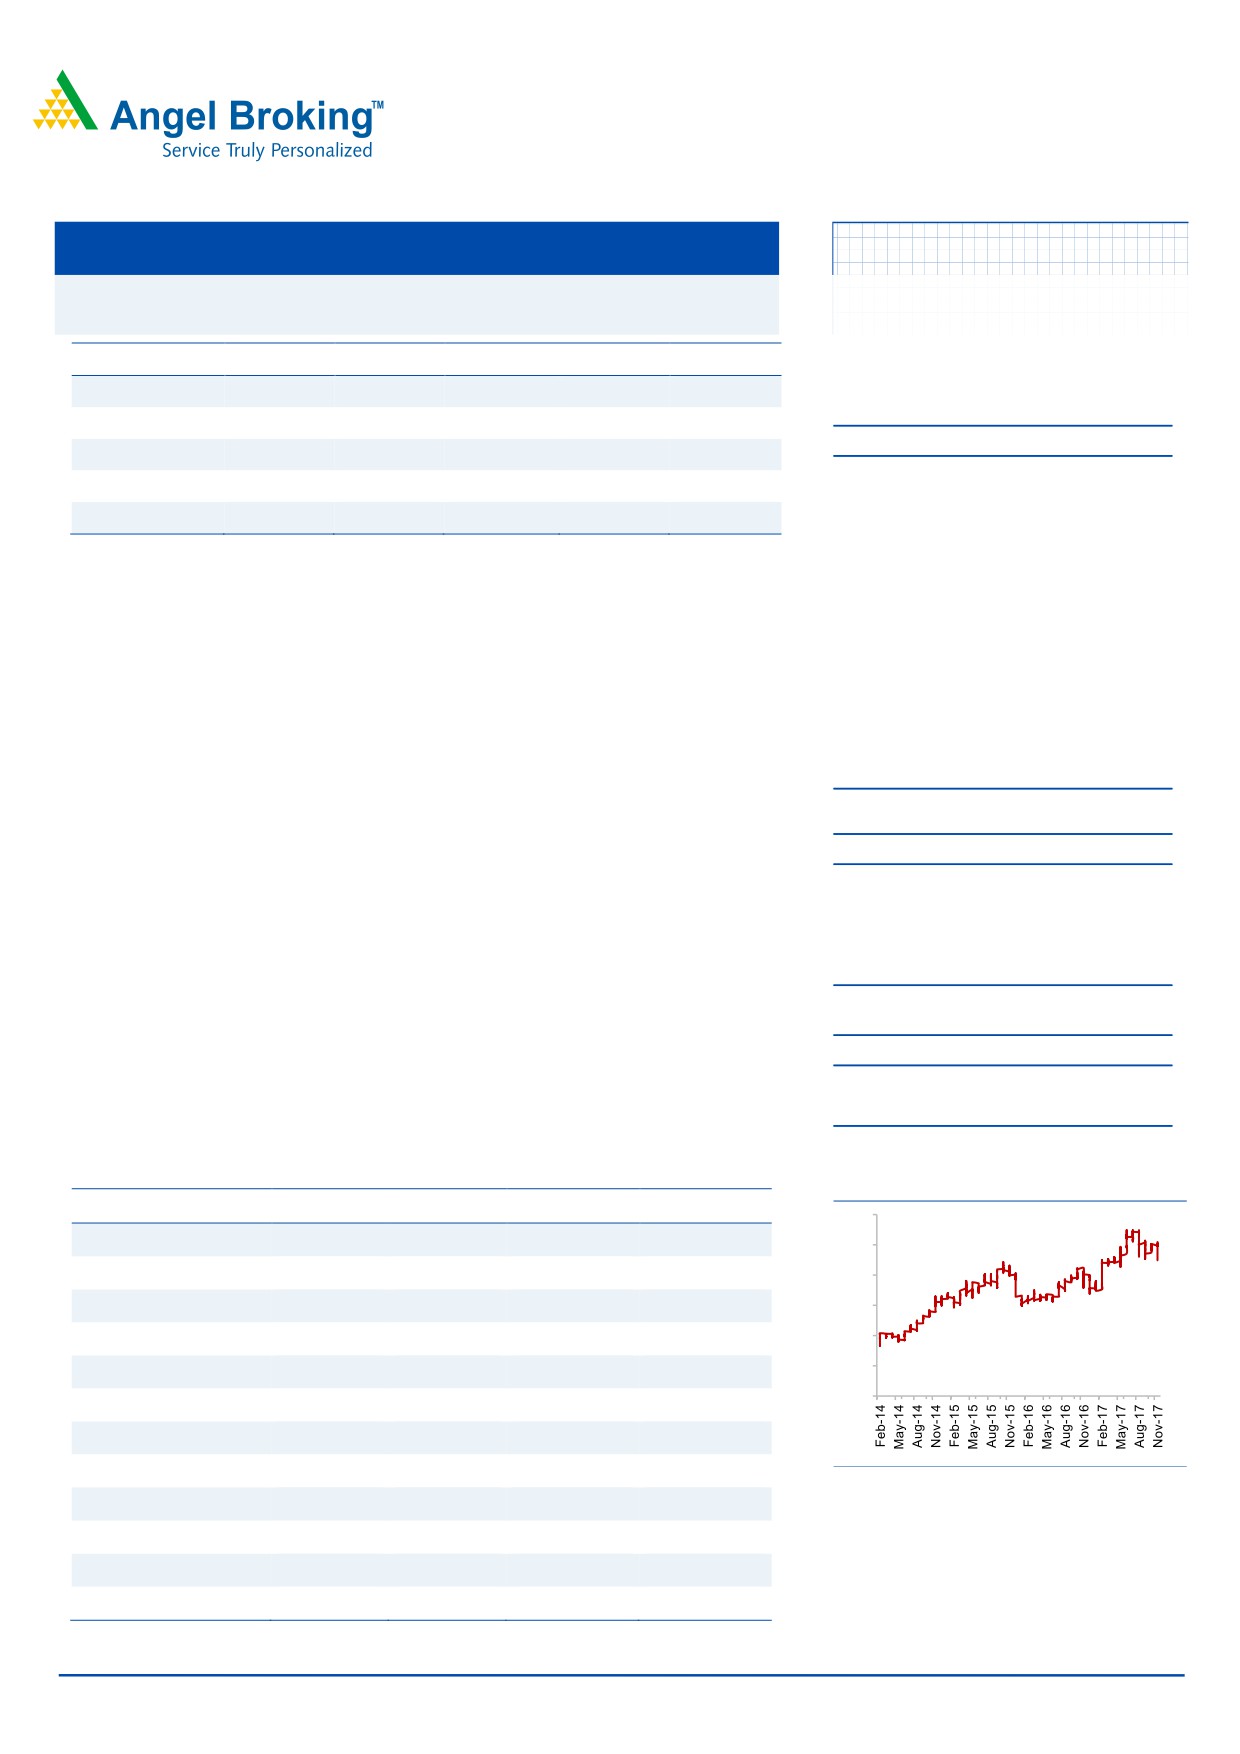
3-Year Daily Price Chart
Y E March (` cr)
FY2016
FY2017
FY2018E
FY2019E
600
9,072
9,220
11,365
12,926
Net sales
500
6.8
1.6
23.3
13.7
% chg
400
1,936
1,488
1,886
2,102
300
Net profit
67.0
-23.2
26.7
11.5
200
% chg
18.9
14.5
18.4
20.5
100
EPS
21.7
18.4
20.0
20.0
0
EBITDA margin (%)
23.4
30.5
24.0
21.6
P/E (x)
38.9
23.5
24.3
22.2
RoE (%)
Source: Company, Angel Research
22.8
13.4
15.6
16.5
RoCE (%)
8.0
6.5
5.3
4.4
P/BV (x)
Sarabjit Kour Nangra
5.1
5.2
4.0
3.4
EV/Sales (x)
+91 22 39357600 Ext: 6806
23.3
28.3
20.0
17.2
EV/EBITDA (x)
Source: Company, Angel Research; Note: CMP as of November 22, 2017
Please refer to important disclosures at the end of this report
1
Cadila Healthcare | 2QFY2018 Result Update
Exhibit 1: 2QFY2018 performance (Consolidated)
Y/E March (` cr)
2QFY2018
1QFY2018
% chg (qoq) 2QFY2017
% chg (yoy)
1HFY2018
1HFY2017
% chg
Net Sales
3,155
2,136
47.7
2,336
35.0
5,291
4,553
16.2
Other Income
102
83
23.0
40
151.5
184
126
45.7
Total Income
3,257
2,850
14.2
2,377
37.0
5,475
4,679
17.0
Gross profit
2054
1014
102.6
1535
33.8
3361
2935
14.5
Gross margin (%)
65.1
61.2
6.5
65.7
63.5
64.5
(1.5)
Operating profit
778
216
260.7
499
55.8
994
948
4.8
Operating Margin (%)
24.7
10.1
21.4
18.8
20.8
(9.8)
Financial Cost
41
22
85.4
19
117.1
63
29
119.3
Depreciation
127
122
3.9
86
46.6
249
171
45.7
PBT
712
154
361.3
435
63.9
867
875
(1.0)
Tax
182
30
514.2
65
182.2
242
119
103.2
Adj. PAT before
530
125
325.0
370
43.3
625
756
(17.3)
Extra-ordinary item
Exceptional loss/(gain)
9
20
9
16
15
Minority
13
7
82.6
19
(33)
(37)
(11.8)
Reported PAT
503
138
263.7
380
32.5
642
778
(17.6)
Adj. PAT
503
138
263.7
380
32.5
642
778
(17.6)
EPS (`)
4.9
5.7
3.7
6.3
7.6
Source: Company, Angel Research
Exhibit 2: 2QFY2018 - Actual vs. Angel estimates
(` cr)
Actual
Estimates
Variance
Net Sales
3,155
2,800
12.7
Operating profit
778
560
38.8
Tax
182
107
70.4
Net profit
503
377
33.4
Source: Company, Angel Research
Revenue higher than our expectation
Sales came in at `3,155cr (`2,800cr expected) v/s. `2,336cr in 2QFY2017, a
yoy growth of 35.0%, mainly driven by the USA Formulations sales. Indian
formulation sales registered (`894cr) a yoy growth of 9.0%. USA, growth was
mainly driven by 180-day exclusive launch of gLialda.
The dip in the domestic business was primarily due to destocking of
inventories with the implementation of GST. The sales recorded in key
markets were US (`1,644cr, up 66.2% yoy), Indian Formulation (`895cr, a yoy
growth of 9.0%), Emerging market Formulation (`131cr, grew 15.9% yoy) and
Latin America formulation (`68cr, a yoy growth of 2.8%).
The Alliances (`23.7cr) de-grew by 5.9% yoy, comprising Europe Formulation
(`54cr, a yoy dip of 2.3%), Consumer Wellness (`119cr, a yoy growth of 7.1%),
Animal Healthcare (`128cr, a yoy growth of 4.2%) and API (`93cr, a yoy
growth of 11.7%).
Company filed for 9 ANDAs and received 32 approvals in 2QFY2018. Post
successful resolution of the Moraiya plant USFDA issue, the company
expects ~80 ANDA approvals until FY2019 for the company. Around ~50% of
November 24, 2017
2
Cadila Healthcare | 2QFY2018 Result Update
these are expected to come from the Moraiya facility and the rest from
Baddi and SEZ facilities.
Exhibit 3: Sales trend in the US and Europe
1,800
1,644
1,600
1,400
1,200
989
985
965
1,000
887
800
600
400
200
56
65
62
61
68
0
2QFY2017
3QFY2017
4QFY2017
1QFY2018
2QFY2018
US
Europe
Source: Company, Angel Research
The growth in the domestic market was mainly led by Indian Formulation
(`895cr) registering growth of 9.0% & Animal Health & Others (`128cr), which
grew by 4.2%. API (`92.9cr), on the other hand, grew by 11.7% yoy.
Exhibit 4: Sales trend in Domestic Formulation and Consumer Wellness Divisions
1000
895
900
840
821
797
800
700
637
600
500
400
300
200
112
111
120
115
120
100
0
2QFY2017
3QFY2017
4QFY2017
1QFY2018
2QFY2018
Domestic Formulation
Consumer division
Source: Company, Angel Research
OPM better than expectation
On operating profit front, the EBITDA margins came in at 24.7% (21.3% expected)
v/s. 21.4% in 2QFY2017, mainly on the back of higher than expected sales. Thus,
the PAT came in at ` 503cr V/s `414cr expected. Gross margins came in at 65.1%
v/s. 65.7% in 2QFY2017, while R&D expenses were 8.7% of sales in 2QFY2018 v/s.
7.8% of sales in 2QFY2017.
November 24, 2017
3
Cadila Healthcare | 2QFY2018 Result Update
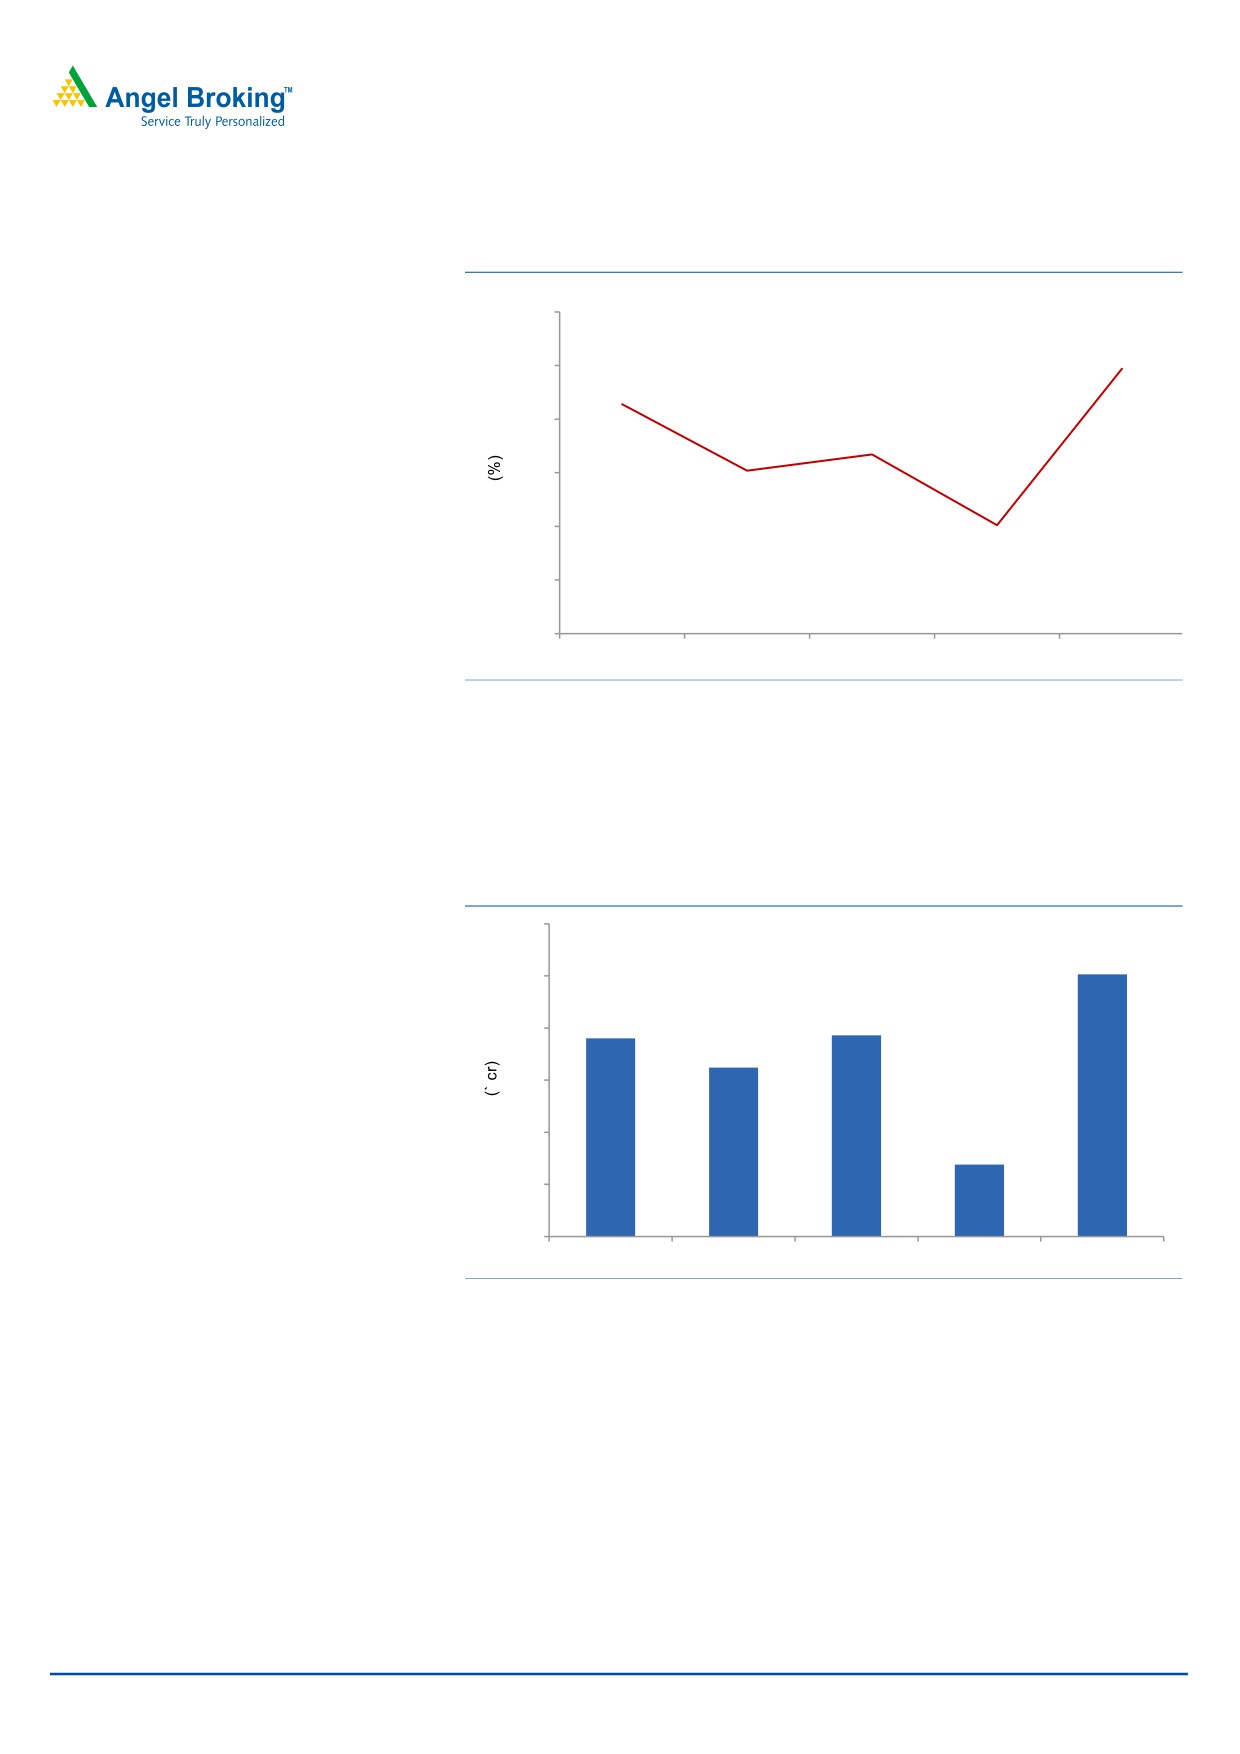
Exhibit 5: OPM trend
30.0
25.0
24.7
21.4
20.0
16.7
15.0
15.2
10.0
10.1
5.0
0.0
2QFY2017
3QFY2017
4QFY2017
1QFY2018
2QFY2018
Source: Company, Angel Research
Net profit plunges 32.5% yoy: Consequently, the Adj. PAT came in at `503cr
(`377cr expected) v/s. `380cr in 2QFY2017, a yoy growth of 32.5%. A 46.6%
yoy rise in deprecation and financial expenses, up by 117.1% yoy resulted in
the overall growth in net profit lower than growth in the operating profit.
Exhibit 6: Adjusted Net profit trend
600
503
500
380
386
400
324
300
200
138
100
0
2QFY2017
3QFY2017
4QFY2017
1QFY2018
2QFY2018
Source: Company, Angel Research
Concall takeaways
Management expects US business to witness price erosion to be 10- 12%
in FY2018E and 8- 10% in FY2019E. It has guided for overall US revenue
(reported) growth in FY19E, despite high base due to gLialda sales in
180- days exclusivity in FY2018E
Cadila Healthcare received EIR for Ahmedabad SEZ facility in
2QFY2018, on top of similar EIR in Moraiya and Baddi facilities in
1QFY2018.
November 24, 2017
4
Cadila Healthcare | 2QFY2018 Result Update
Cadila guided for tax rate of 22- 25% and 18- 20% in FY2018E and
FY2019E respectively. The higher tax rate in FY18E is due to strong sales
of gLialda in the US, while the lower rate in FY2019 is due to higher
exports from Ahmedabad SEZ and lower sales of gLialda.
Capex of `1,000-1,200cr expected in FY2018.
November 24, 2017
5
Cadila Healthcare | 2QFY2018 Result Update
Recommendation rationale
Strong domestic portfolio: Cadila is the fifth largest player in the domestic
market with sales of about `3,244cr in FY2017; the domestic market
contributes ~39% to its top-line. The company enjoys a leadership position in
the CVS, GI, women healthcare and respiratory segments, and has a sales
force of 4,500 executives. Further, the company has a strong consumer
division through its stake in Zydus Wellness, which has premium brands such
as Sugarfree, Everyuth and Nutralite under its umbrella. This segment, which
contributes ~4.9% of sales, registered a growth of 13.6% during FY2017.
Going forward, the company expects the segment to grow at an above
industry rate on the back of new product launches and field force
expansion. Sales were lower in FY2017,however, FY2018 should witness a
rebound. During FY2017-19E, we expect the domestic segment to grow at
a CAGR of 14.3%.
Exports on a strong footing: Cadila has a two-fold focus on exports, wherein
it is targeting developed as well as emerging markets, which contributed
around 61% to its FY2017 top-line. The company has established a
formidable presence in the developed markets of US, Europe (France and
Spain) and Japan. In the US, the company achieved critical scale of
`3,709cr on the sales front in FY2017. The growth in exports to the US along
with other regions like Europe would be driven by new product launches,
going forward. Overall, exports are expected to post a CAGR of 23.7% over
FY2017-19E.
Outlook and valuation
We expect Cadila’s net sales to post 18.4% CAGR to `12,926cr and EPS to
clock 18.9% CAGR to `20.5 over FY2017-19E. We maintain our reduce rating on
the stock.
Exhibit 7: Key Assumptions
Key assumptions
FY2018E
FY2019E
Domestic growth (%)
15.5
13.0
Exports growth (%)
33.0
15.0
Growth in employee expenses (%)
16.8
13.5
Operating margins (excl tech. know-how fees) (%)
20.0
20.0
Capex (` cr)
1,000
1,000
Source: Company, Angel Research
November 24, 2017
6
Cadila Healthcare | 2QFY2018 Result Update
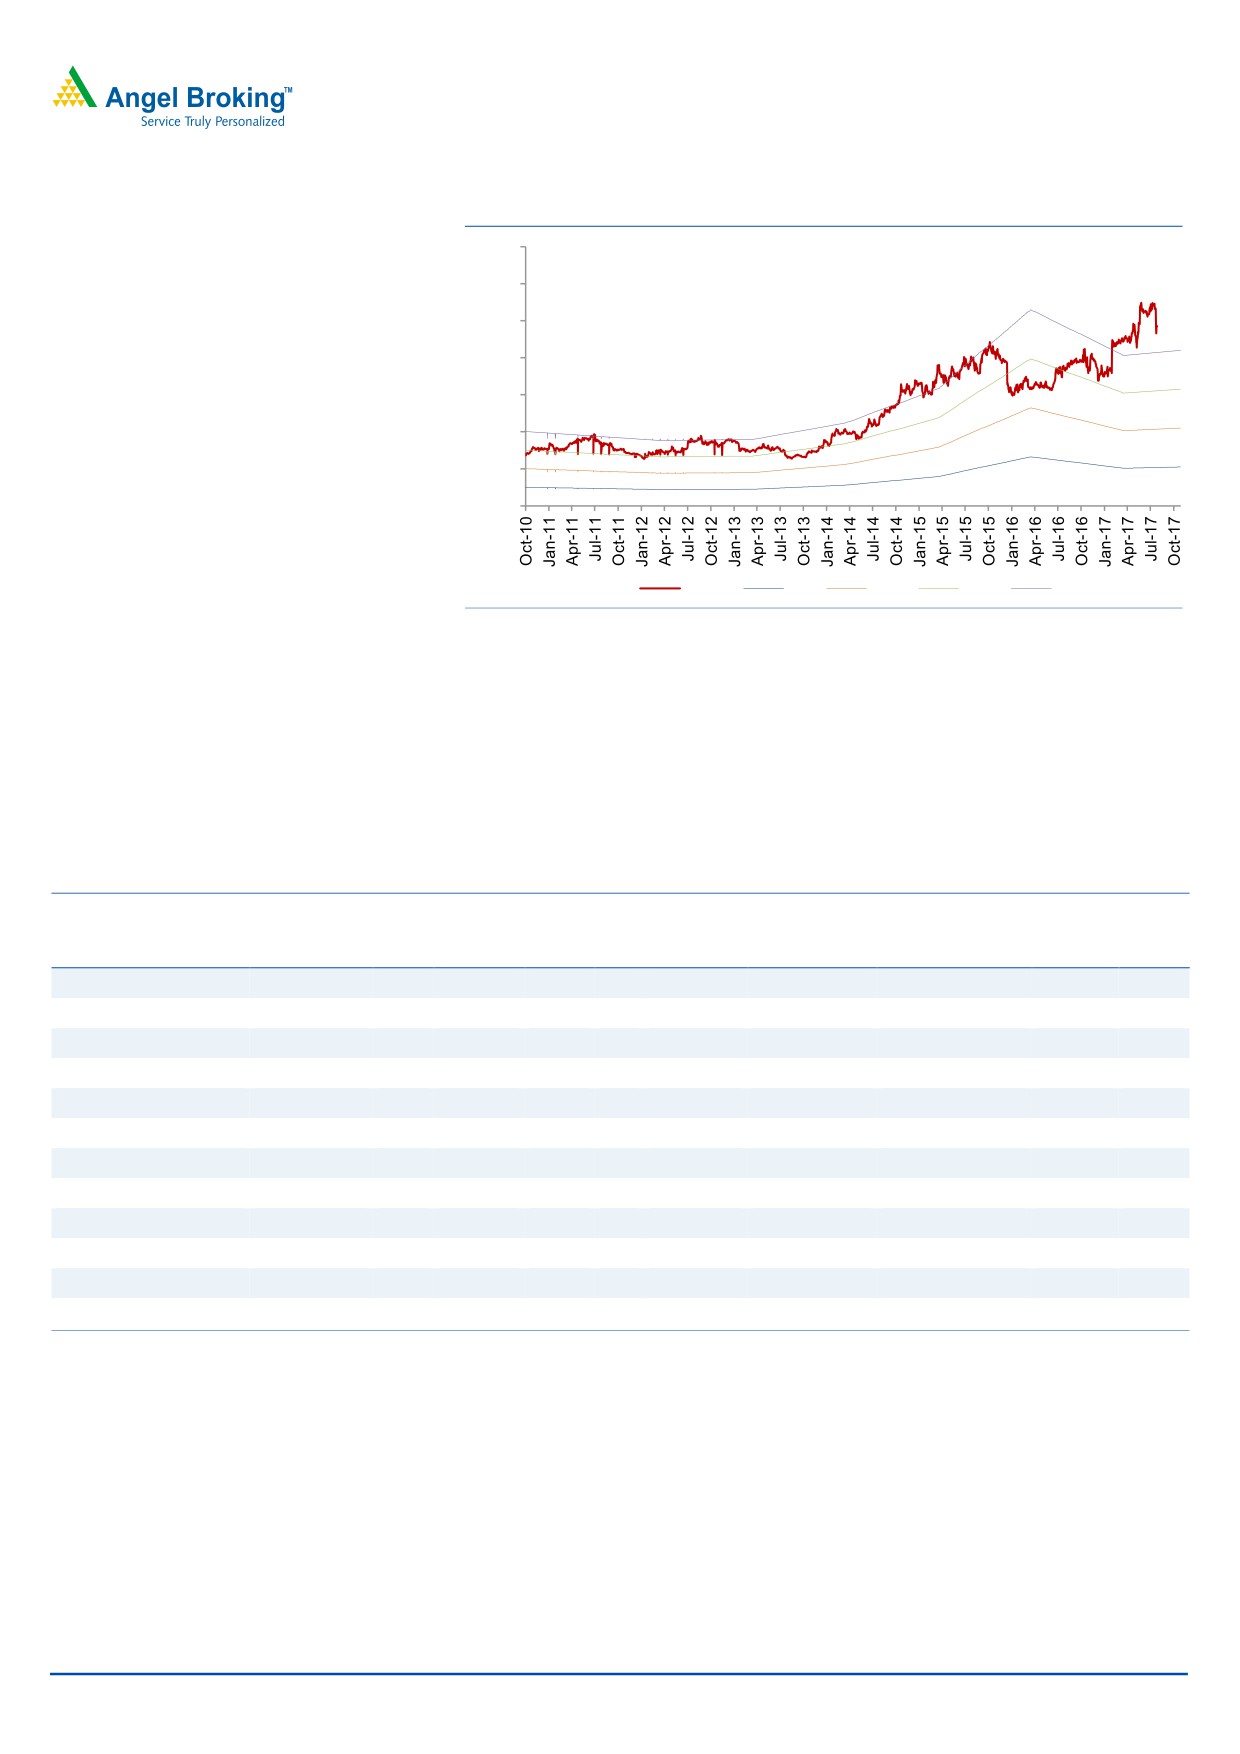
Exhibit 8: One-year forward PE band
700
600
500
400
300
200
100
0
Price
7x
14x
21x
28x
Source: Company
Company background: Cadila Healthcare‘s operations range across API,
formulations, animal health products and cosmeceuticals. The group has
global operations spread across USA, Europe, Japan, Brazil, South Africa
and 25 other emerging markets. Having already achieved the US$1bn sales
mark in 2011, the company aims to be a research-driven pharmaceutical
company by 2020.
Exhibit 9: Recommendation Summary
Company
Reco
CMP Tgt. price Upside
FY2019E
FY17-19E
FY2019E
PE
EV/Sales
EV/EBITDA
RoCE
RoE
(`)
(`)
%
CAGR in EPS (%)
(x)
(x)
(x)
(%)
(%)
Alembic Pharma
Buy
511
600
17.3
21.4
2.9
13.0
5.7
20.6
18.4
Aurobindo Pharma
Buy
699
823
17.8
13.6
2.5
9.9
14.2
25.3
22.7
Cadila Healthcare
Reduce
443
411
(7.2)
21.6
4.1
17.6
18.9
16.5
22.2
Cipla
Sell
619
462
(25.3)
25.5
3.2
16.2
39.3
10.9
13.1
Dr Reddy's
Reduce
2,361
2,040
(13.6)
23.2
3.1
13.3
18.5
10.3
12.4
Dishman Pharma
Under Review
301
-
-
19.3
2.7
10.1
23.3
4.5
4.4
GSK Pharma
Sell
2,496
2,000
(19.9)
53.9
6.9
39.3
19.3
25.8
23.5
Indoco Remedies
Sell
280
136
(49.0)
23.5
2.1
14.9
16.2
10.1
14.5
Ipca labs
Neutral
535
-
-
21.2
1.9
13.5
24.7
12.4
11.0
Lupin
Buy
828
1,091
31.8
16.7
2.4
9.3
(6.6)
13.7
13.7
Sanofi India*
Neutral
4,434
-
-
27.1
3.8
17.0
12.8
25.8
27.5
Sun Pharma
Buy
535
615
15.0
24.0
3.7
16.3
(17.5)
11.3
14.0
Source: Company, Angel Research; Note: *December year ending
November 24, 2017
7
Cadila Healthcare | 2QFY2018 Result Update
Profit & Loss statement (Consolidated)
Y/E March (` cr)
FY2014 FY2015
FY2016 FY2017 FY2018E
FY2019E
Gross sales
7,208
8,658
9,262
9,416
11,579
13,170
148
161
190
196
214
244
Less: Excise duty
Net sales
7,060
8,497
9,072
9,220
11,365
12,926
Other operating
164
154
355
210
210
210
income
Total operating income
7,224
8,651
9,427
9,430
11,574
13,136
% chg
13.6
19.8
9.0
0.0
22.7
13.5
6,024
6,896
7,099
7,526
9,086
10,337
Total expenditure
Net raw materials
2,714
3,197
3,096
3,445
4,091
4,524
443
534
570
579
714
812
Other mfg costs
Personnel
1,071
1,209
1,262
1,500
1,815
2,196
Other
1,796
2,107
2,172
2,002
2,466
2,805
1,036
1,601
1,973
1,694
2,278
2,589
EBITDA
% chg
12.3
54.6
23.2
-14.2
34.5
13.6
14.7
18.8
21.7
18.4
20.0
20.0
(% of Net Sales)
Dep. & amortisation
201
287
292
375
415
485
EBIT
835
1,314
1,681
1,319
1,863
2,103
12.8
57.4
27.9
-21.5
41.3
12.9
% chg
(% of Net Sales)
11.8
15.5
18.5
14.3
16.4
16.3
90
68
53
45
45
45
Interest & other charges
Other income
51
55
116
129
100
100
(% of PBT)
5
4
6
8
5
4
959
1,456
2,099
1,612
2,127
2,368
Recurring PBT
% chg
18.3
51.8
44.1
-23.2
32.0
11.3
17
10
2
-
-
0
Extraordinary exp./(Inc.)
PBT (reported)
942
1,445
2,099
1,612
2,127
2,368
Tax
106.0
259.4
177.4
128.9
212.7
236.8
11.3
17.9
8.5
8.0
10.0
10.0
(% of PBT)
PAT (reported)
836
1,186
1,921
1,483
1,915
2,131
32.6
35.5
30.0
29.1
29.1
29.1
Less: Minority int. (MI)
PAT after MI (reported)
804
1,151
1,934
1,488
1,886
2,102
ADJ. PAT
819
1,159
1,936
1,488
1,886
2,102
% chg
25.0
41.5
67.0
-23.2
26.7
11.5
(% of Net Sales)
11.4
13.5
21.3
16.1
16.6
16.3
8.0
11.3
18.9
14.5
18.4
20.5
Adj.Basic EPS (`)
Adj. Fully Diluted EPS (`)
8.0
11.3
18.9
14.5
18.4
20.5
% chg
25.0
41.5
67.0
(23.2)
26.7
11.5
November 24, 2017
8
Cadila Healthcare | 2QFY2018 Result Update
Balance Sheet (Consolidated)
Y/E March (` cr)
FY2014
FY2015
FY2016
FY2017
FY2018E
FY2019E
SOURCES OF FUNDS
102
102
102
102
102
102
Equity share capital
Reserves & Surplus
3,337
4,149
5,597
6,858
8,456
10,270
Shareholders funds
3,439
4,252
5,699
6,960
8,559
10,374
144
169
135
156
185
214
Minority interest
Total loans
2,265
2,334
2,107
4,945
3,000
2,500
55
43
61
45
46
47
Other Long Term Liabilities
Long Term Provisions
76
110
97
169
169
169
Deferred tax liability
96
59
(318)
(401)
122
123
Total liabilities
6,075
6,966
7,782
11,875
12,081
13,428
APPLICATION OF FUNDS
3,756
4,353
4,786
5,436
6,436
7,436
Gross block
Less: Acc. depreciation
1,540
1,827
2,120
2,495
2,910
3,396
Net block
2,214
2,526
2,666
3,942
3,526
4,040
892
892
892
892
892
892
Capital Work-in-Progress
Goodwill
908
733
1,141
2,465
2,465
2,465
87
154
416
435
435
435
Investments
Long Term Loans and
495
637
836
997
997
997
Adv.
3,391
4,105
4,081
5,973
7,254
8,565
Current assets
Cash
549
670
639
1,544
1,871
2,488
Loans & advances
341
334
335
336
337
338
Other
2,501
3,102
3,108
4,094
5,046
5,739
Current liabilities
1,912
2,081
2,250
2,829
3,487
3,966
1,480
2,024
1,831
3,144
3,767
4,599
Net Current assets
Mis. Exp. not written off
-
-
-
-
-
-
Total assets
6,075
6,966
7,782
11,875
12,081
13,428
November 24, 2017
9
Cadila Healthcare | 2QFY2018 Result Update
Cash Flow Statement (Consolidated)
Y/E March (` cr)
FY2014 FY2015 FY2016 FY2017 FY2018E FY2019E
942
1,445
2,099
1,612
2,127
2,368
Profit before tax
Depreciation
201
287
292
375
415
485
(Inc)/Dec in Working Cap.
168
(565)
(37)
(570)
(295)
(215)
Less: Other income
51
55
116
129
100
100
Direct taxes paid
106
259
177
129
213
237
1,154
853
2,061
1,160
1,935
2,301
Cash Flow from Operations
(Inc.)/Dec.in Fixed Assets
(296)
(597)
(433)
(650)
(1,000)
(1,000)
(Inc.)/Dec. in Investments
(65)
(68)
(262)
(19)
-
-
Other income
51
55
116
129
100
100
Cash Flow from Investing
(310)
(609)
(579)
(540)
(900)
(900)
-
-
-
-
-
-
Issue of Equity
Inc./(Dec.) in loans
(397)
91
(222)
2,894
(1,944)
(499)
Dividend Paid (Incl. Tax)
(216)
(287)
(287)
(287)
(287)
(287)
Others
(264)
74
(1,004)
(2,322)
1,524
2
Cash Flow from Financing
(877)
(122)
(1,513)
285
(708)
(784)
(33)
121
(31)
905
327
617
Inc./(Dec.) in Cash
Opening Cash balances
582
549
670
639
1,544
1,871
Closing Cash balances
549
670
639
1,544
1,871
2,488
November 24, 2017
10
Cadila Healthcare | 2QFY2018 Result Update
Key Ratios
Y/E March
FY2014 FY2015 FY2016 FY2017 FY2018E FY2019E
Valuation Ratio (x)
55.3
39.1
23.4
30.5
24.0
21.6
P/E (on FDEPS)
P/CEPS
44.3
31.3
20.3
24.3
19.7
17.5
P/BV
13.2
10.7
8.0
6.5
5.3
4.4
1.7
1.7
1.7
1.7
1.7
1.7
Dividend yield (%)
EV/Sales
6.6
5.5
5.1
5.2
4.0
3.4
45.0
29.0
23.3
28.3
20.0
17.2
EV/EBITDA
EV / Total Assets
7.7
6.7
5.9
4.0
3.8
3.3
Per Share Data (`)
EPS (Basic)
8.0
11.3
18.9
14.5
18.4
20.5
EPS (fully diluted)
8.0
11.3
18.9
14.5
18.4
20.5
10.0
14.2
21.8
18.2
22.5
25.3
Cash EPS
DPS
7.5
7.5
7.5
7.5
7.5
7.5
Book Value
33.6
41.5
55.7
68.0
83.6
101.3
Dupont Analysis
EBIT margin
11.8
15.5
18.5
14.3
16.4
16.3
88.7
82.1
91.5
92.0
90.0
90.0
Tax retention ratio
Asset turnover (x)
1.3
1.5
1.4
1.1
1.1
1.2
ROIC (Post-tax)
13.8
18.6
23.8
14.2
16.6
18.2
Cost of Debt (Post Tax)
3.2
2.4
2.2
1.2
1.0
1.5
Leverage (x)
0.6
0.4
0.3
0.4
0.3
0.1
20.1
25.8
30.8
19.1
21.5
19.3
Operating ROE
Returns (%)
ROCE (Pre-tax)
13.8
20.2
22.8
13.4
15.6
16.5
Angel ROIC (Pre-tax)
20.6
31.3
34.4
21.8
26.9
29.1
ROE
25.3
30.1
38.9
23.5
24.3
22.2
Turnover ratios (x)
Asset Turnover (Gr. Block)
1.8
2.1
2.1
1.8
1.9
1.9
Inventory / Sales (days)
69
61
57
83
82
86
Receivables (days)
57
57
46
67
66
69
Payables (days)
55
46
49
58
59
59
53
48
49
54
55
56
WC (ex-cash) (days)
Solvency ratios (x)
Net debt to equity
0.5
0.4
0.3
0.5
0.1
0.0
Net debt to EBITDA
1.7
1.0
0.7
2.0
0.5
0.0
Int. Coverage (EBIT / Int.)
9.3
19.4
31.8
29.3
41.4
46.7
November 24, 2017
11
Cadila Healthcare | 2QFY2018 Result Update
Research Team Tel: 022 - 39357800
DISCLAIMER
Angel Broking Private Limited (hereinafter referred to as “Angel”) is a registered Member of National Stock Exchange of
India Limited, Bombay Stock Exchange Limited and Metropolitan Stock Exchange Limited. It is also registered as a
Depository Participant with CDSL and Portfolio Manager with SEBI. It also has registration with AMFI as a Mutual Fund
Distributor. Angel Broking Private Limited is a registered entity with SEBI for Research Analyst in terms of SEBI (Research
Analyst) Regulations, 2014 vide registration number INH000000164. Angel or its associates has not been debarred/
suspended by SEBI or any other regulatory authority for accessing /dealing in securities Market. Angel or its
associates/analyst has not received any compensation / managed or co-managed public offering of securities of the
company covered by Analyst during the past twelve months.
This document is solely for the personal information of the recipient, and must not be singularly used as the basis of any
investment decision. Nothing in this document should be construed as investment or financial advice. Each recipient of this
document should make such investigations as they deem necessary to arrive at an independent evaluation of an
investment in the securities of the companies referred to in this document (including the merits and risks involved), and
should consult their own advisors to determine the merits and risks of such an investment.
Reports based on technical and derivative analysis center on studying charts of a stock's price movement, outstanding
positions and trading volume, as opposed to focusing on a company's fundamentals and, as such, may not match with a
report on a company's fundamentals. Investors are advised to refer the Fundamental and Technical Research Reports
available on our website to evaluate the contrary view, if any.
The information in this document has been printed on the basis of publicly available information, internal data and other
reliable sources believed to be true, but we do not represent that it is accurate or complete and it should not be relied on
as such, as this document is for general guidance only. Angel Broking Pvt. Limited or any of its affiliates/ group companies
shall not be in any way responsible for any loss or damage that may arise to any person from any inadvertent error in the
information contained in this report. Angel Broking Pvt. Limited has not independently verified all the information contained
within this document. Accordingly, we cannot testify, nor make any representation or warranty, express or implied, to the
accuracy, contents or data contained within this document. While Angel Broking Pvt. Limited endeavors to update on a
reasonable basis the information discussed in this material, there may be regulatory, compliance, or other reasons that
prevent us from doing so.
This document is being supplied to you solely for your information, and its contents, information or data may not be
reproduced, redistributed or passed on, directly or indirectly.
Neither Angel Broking Pvt. Limited, nor its directors, employees or affiliates shall be liable for any loss or damage that may
Disclosure of Interest Statement
Cadila Healthcare
1. Financial interest of research analyst or Angel or his Associate or his relative
No
2. Ownership of 1% or more of the stock by research analyst or Angel or associates or relatives
No
3. Served as an officer, director or employee of the company covered under Research
No
4. Broking relationship with company covered under Research
No
Ratings (Based on expected returns
Buy (> 15%)
Accumulate (5% to 15%)
Neutral (-5 to 5%)
over 12 months investment period):
Reduce (-5% to -15%)
Sell (< -15)
November 24, 2017
12