IPO Note | Pharmaceuticals
April 26, 2016
Thyrocare Technologies
NEUTRAL
Issue Open: April 27, 2016
IPO Note - Not much upside
Issue Close: April 29, 2016
Thyrocare Technologies is one of the leading diagnostic chains in India with
Issue Details
market share of ~3% amongst organised players. The core business of the
Face Value: `10
company is diagnostic testing (~97.1% of sales as on 9MFY2016) while the
company through its wholly owned subsidiary also operates imaging centres.
Present Eq. Paid up Capital: `53.7cr
Fresh Issue**: NA
A differentiated model enables higher margins: Unlike other organized players,
which operate more on a B2C model, Thyrocare is more of a B2B player with
Offer for sale: 1.07cr Shares
~85% of its revenues coming through the channel (as against 30-40% for its
Post Eq. Paid up Capital: `53.1cr
peers). This enables the company to keep its other expenditure lower vis-a-vis its
Market Lot: 33 Shares
peers, which spend higher on promotional expenses. In terms of services, the
company is more focused on the preventive & wellness, and the non-preventive
Issue (amount): `451-479cr
segments, while its peers follow a portfolio model of providing a full range of tests
Price Band: `420-446
and services, which entail higher manpower costs. The company’s operations are
Post-issue implied mkt. cap `2,256cr*-
relatively more automated in nature, thereby requiring less manpower
2,396cr**
intervention, unlike its peers which need to employ qualified manpower like Phds
Note:*at Lower price band and **Upper price band
and doctors. As a result, employee costs for Thyrocare account for 10% of sales
V/s 20% of sales for its peers. This contributes towards the company enjoying
Book Building
better margins compared to the industry (~41% for Thyrocare’s diagnostic
QIBs
50%
business V/s ~26% for Dr Lal Pathlabs). We believe, over the medium term the
company would be able to sustain its margins and also scale up its business,
Non-Institutional
15%
given the opportunities in the industry. This coupled with the low capex
Retail
35%
requirement for the diagnostic segment makes its diagnostic business a high
ROIC business.
Post Issue Shareholding Pattern(%)
Outlook and Valuation: The company is valued at a P/E multiple of 42.3-44.9x its
Promoters Group
64.0
FY2016E annualised EPS at the lower and upper end of the issue price band. This
MF/Banks/Indian
compares with a P/E multiple of 61.9x FY2016E EPS for Dr Lal Pathlabs. Although
FIs/FIIs/Public & Others
36.0
the issue seems to be priced at a discount to Dr Lal Pathlabs, we believe that
Thyocare’s consolidated ROIC will come under pressure in the near term as it has
entered the molecular imaging space by acquiring Nuclear Healthcare Ltd (NHL).
According to the company, this business will take 3-4 years to attain peak
profitability while it accounts for almost 40% of its fixed assets of the company (as
on 9MFY2016). Thus, though Thyrocare could potentially provide listing gains, the
pressure on its ROIC in the near term and the not-so cheap valuation demanded by
it will keep the upside in the stock limited. We are Neutral on the issue.
Key Financials
Y/E March (` cr)
FY2012
FY2013
FY2014
FY2015
Net Sales
109
134
150
183
% chg
44.2
23.1
11.7
22.0
Net Profit
35
45
46
44
Sarabjit Kour Nangra
% chg
53.5
28.3
3.0
(3.7)
+91 22 3935 7800 Ext: 6806
EPS (`)
6.5
8.3
8.6
8.3
EBITDA Margin (%)
42.6
44.7
43.3
34.7
Milan Desai
RoE (%)
41.1
34.1
25.2
18.5
+91 22 4000 3600 Ext: 6846
RoCE (%)
33.3
29.4
24.5
15.8
Source: Company, Angel Research; Note: FY2015 numbers are consolidated and rest standalone
Please refer to important disclosures at the end of this report
1
Thyrocare Technologies | IPO Note
Company background
Thyrocare is among the leading diagnostic chains. It conducts an array of medical
diagnostic tests that center on early detection and management of disorders and
diseases. The company operates its testing services through a fully-automated
central processing laboratory (CPL) in Navi Mumbai, which acts as a hub to
branches. The company has recently expanded its operations to include a network
of five regional processing laboratories (RPLs). Out of these, four RPLs were set up
in 2015 (one each in New Delhi, Coimbatore, Hyderabad, and Kolkata) while it
set up one in Bhopal in 2016.
The company as of February 29, 2016, had a network of 1,041 authorized service
providers (ASPs), comprising of 687 Thyrocare Aggregators (TAGs) and
354
Thyrocare Service Providers (TSPs) spread across 466 cities, 24 states and one
union territory. These ASPs operate under a franchise agreement with the company
and deliver samples directly to one of the RPLs or to one of the 22 hub locations if
the sample is to be processed at the CPL.
As of February 29, 2016, it offered 198 tests and 59 profiles of tests to detect a
number of disorders. Its profiles of tests include 16 tests administered under its
“Aarogyam” brand, which offers patients a suite of wellness and preventive health
care tests. In terms of revenue, Wellness & Preventive Healthcare tests account for
~50% of the revenue (of which thyroid tests account for 20% and the balance 30%
are accounted by non-thyroid tests).
The company’s wholly owned subsidiary, NHL, operates a network of molecular
imaging centers in New Delhi, Navi Mumbai and Hyderabad which focus on early
and effective cancer monitoring.
Issue details
The issue is an offer for sale by Promoters and Non-Promoters of 1.07cr equity
shares aggregating to `479cr at the upper end of the price band. The issue
constitutes 20% of the paid-up equity share capital of the company. Since it is an
offer for sale, the company will not receive any proceeds from the sale of shares.
Exhibit 1: Shareholding pattern
Particulars
Pre-Issue
Post-Issue
No. of shares
(%)
No. of shares
(%)
Promoter group
34,898,981
65.0
34,361,745
64.0
Others
18,824,552
35.0
19,361,788
36.0
Total
53,723,533
100.0
53,723,533
100.0
Source: Company, Angel Research
April 26, 2016
2
Thyrocare Technologies | IPO Note
Industry
The domestic diagnostic market is highly fragmented and has a current size
of ~US$6.2bn. The industry is expected to grow at
16-18% CAGR to
~US$9.3-$9.8bn by FY2018 as per CRISIL estimates.
Diagnostic centres in India can be classified as hospital-based, diagnostic chains
and standalone centres. Standalone centres form the majority share
(48%)
followed by hospital based (37%) centres, while diagnostic chains account for the
balance (15%). The absence of stringent regulations and low entry barriers has led
to the evolution of standalone centres, while hospitals tend to have their own
pathology labs. Within diagnostic chains, large pan-India chains form 35-40% and
regional chains form 60-65%.
Specialized tests require expensive infrastructure, which has led to the formation of
diagnostic chains in India. These follow the hub and spoke model and enable
economies of scale. However, the fragmented nature of the industry indicates low
pricing power for service providers in the near term.
The key drivers for the industry are- increase in evidence-based treatments, huge
demand-supply gap, increase in health insurance coverage, need for greater
health coverage as population and life expectancy increase, rising income levels
making quality healthcare services affordable, and growing demand for lifestyle
diseases-related healthcare services.
Key investment rational
One of the leading players in the high growth market with
strong drivers in place
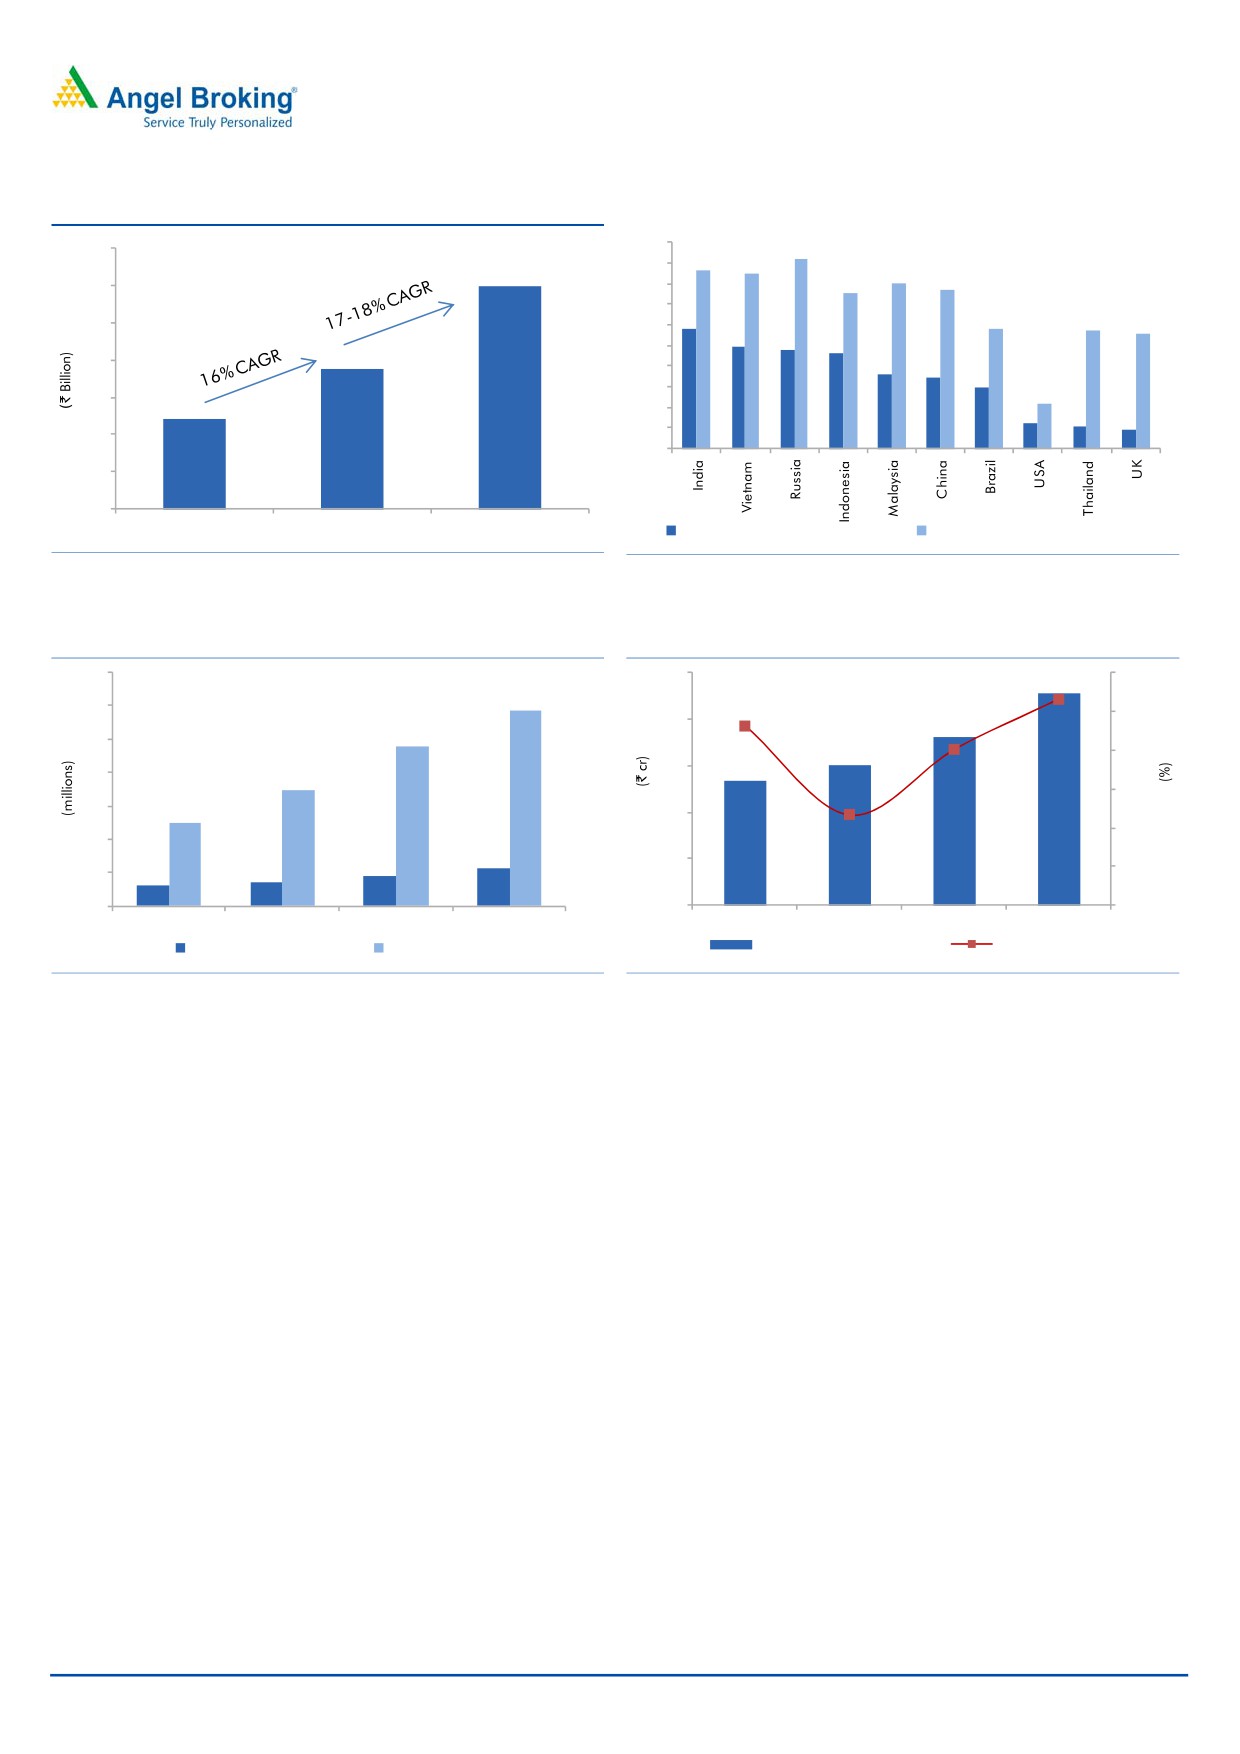
As per CRISIL, the Indian diagnostic industry which has grown at a CAGR of ~16%
over FY2012-2015 to `37,700cr, is expected to maintain its momentum and grow
at 16-18% CAGR to reach the ~`60,000cr mark by FY2018E. This growth is likely
to be supported by rising awareness towards wellness and a higher tendency
among the population to take preventive actions against diseases. Changing
lifestyle is perpetuating higher chronic diseases and with rising income levels,
demand for diagnostic testing in India is on the rise. Further, the health insurance
penetration level in India is currently low with ~17% of the population availing to
it. Moreover, ~86% of the healthcare related expenses are borne directly by
consumers in case of private healthcare services. Increase in penetration levels of
health insurance is expected to indirectly increase demand for diagnostic services.
Of the diagnostic market large pan-India chains account for 35-40% and regional
chains cover the balance 60-65%. Also, they can eat into unorganised sectors
market share which stands at 48%. This leaves a lot of room for organised players
like Dr Lal Pathlabs, Thyocare and SRL amongst others to grow faster than the
industry. Thyocare has posted a CAGR of 23.0% over FY2011-2015. Going
forward, given the cash rich balance sheet of the company, it can easily grow at
30% over the medium term.
April 26, 2016
3
Thyrocare Technologies | IPO Note
Exhibit 2: Indian diagnostic sector
Exhibit 3: Out-of-pocket spending on healthcare (2013)
700
100
92
86
85
90
80
75
77
600
80
600
70
58
58
57
56
500
60
49
48
46
50
400
36
34
40
30
377
30
22
300
20
12
11
9
10
200
240
0
100
-
FY12E
FY15E
FY18E
OOP % of Total Healthcare Expend. OOP % of Pvt. Healthcare Expend.
Source: RHP, Angel Research
Source: WHO Global Healthcare Expenditure Database, Angel Research
Exhibit 4: Strong growth in Samples and Tests
Exhibit 5: Standalone top-line growth
70
250
30.0
26.5
58.60
60
228
25.0
200
20.1
47.84
23.1
50
20.0
180
150
40
34.90
150
15.0
134
30
25.03
100
11.7
10.0
20
11.36
9.09
50
6.28
7.01
5.0
10
-
-
-
FY2013
FY2014
FY2015
FY2016E
FY2013
FY2014
FY2015
FY2016*
No of samples processed
No of tests conducted
Standalone Revenue (LHS)
yoy growth (RHS)
Source: Company, Angel Research
Source: Company, Angel Research; note*9M annualised
A differentiated model enables higher margins
Thyrocare’s business model differs from that of its competitors in a couple of ways.
One of the striking difference is that unlike other organized players, which mostly
follow a B2C model, Thyrocare is more of a B2B player with ~85% of its revenues
coming through the channel (as against 30-40% for its peers). This enables the
company to keep its other expenditure lower vis-a-vis its peers, which spend higher
on promotional expenses. In terms of services, the company is more focused on
the preventive & wellness, and the non-preventive segments, while its peers follow
a portfolio model of providing a full range of tests and services, which entail
higher manpower costs. The company’s operations are relatively more automated
in nature, thereby requiring less manpower intervention, unlike its peers which
need to employ qualified manpower like Phds and doctors. As a result, employee
costs for Thyrocare account for 10% of sales V/s 20% of sales for its peers. This
contributes towards the company enjoying better margins compared to the industry
(~41% for Thyrocare’s diagnostic business V/s ~26% for Dr Lal Pathlabs). We
believe, over the medium term the company would be able to sustain its margins
and also scale up its business, given the opportunities in the industry. This coupled
with the low capex requirement for the diagnostic segment makes it a high ROIC
business.
April 26, 2016
4
Thyrocare Technologies | IPO Note
The company’s standalone business derived ~51% of its FY2015 revenues from
wellness and preventive healthcare tests segment. This segment grew at a CAGR of
~29% over FY2013-15E while the overall top-line posted a growth of ~16% over
the same period. Going forward, CRISIL estimates that this segment is expected to
grow at 25% over the next three years which augurs well for the company as the
company is keen on growing its wellness and preventive offerings.
Core business asset light in nature, debt free status
The company’s volumes and strong ties with its vendors has enabled it to develop
an equipment leasing model for the CPL that has resulted in minimal capex for its
otherwise expensive diagnostic equipments. The model entails leasing of
equipments and instruments for the CPL in exchange for a commitment to
purchase reagents and consumables from these vendors for a specified period of
time. The RPLs conduct routine tests which do not require complex equipments;
hence, the capex required for equipments is minimal and the same are purchased
outright by the company. Additionally, the premises required to set up these RPLs
are leased, thus resulting in lower capital outlay to set up these RPLs (`2-3cr
required for set up a RPL). As a result, the company has been able to expand its
operations without relying on debt. The company as of 9MFY2016 has no debt on
its books.
Low capex requirements and high asset turnover along with high margins enable
the company to generate high ROIC on the core diagnostic business, which is
around ~40%. This will enable the company to fund its growth with ease and
warrant it to make a high dividend payout. In fact it has cash and bank and
investments of `91cr as of FY2015 on a consolidated basis. The net cash flow
from operating activities is around `40-45cr/year and will be used to fund the next
phase of growth.
Valuation
The company is valued at a P/E multiple of 42.3-44.9x its FY2016E annualised
EPS at the lower and upper end of the issue price band. This compares with a P/E
multiple of 61.9x FY2016E EPS for Dr Lal Pathlabs. Although the issue seems to be
priced at a discount to Dr Lal Pathlabs, we believe that Thyocare’s profitability will
come under pressure in the near term as it has entered the molecular imaging
space by acquiring Nuclear Healthcare Ltd (NHL). According to the company, this
business will take 3-4 years to attain peak profitability while it accounts for almost
40% of the fixed assets of the company (as on 9MFY2015). Thus, though
Thyrocare could potentially provide listing gains, the pressure on its ROIC in the
near term and the not-so cheap valuation demanded by it will keep the upside in
the stock limited. We are Neutral on the issue.
April 26, 2016
5
Thyrocare Technologies | IPO Note
Risks to upside
Highly fragmented market with intense local competition (standalone centers
are 48% of the industry).
High dependence on preventive wellness which accounts for almost 51% of its
sales with thyroid tests accounting for 20% of the overall sales.
High investments in the imaging business with high gestation periods would
keep the profitability in check.
Margins could be under pressure in case the company moves higher in the
value chain.
April 26, 2016
6
Thyrocare Technologies | IPO Note
Consolidated Profit & Loss Statement
Y/E March (` cr)
FY2012
FY2013
FY2014
FY2015
9MFY2016
Gross sales
107
131
146
175
169
Less: Excise duty
-
-
-
-
-
Net sales
107
131
146
175
169
Other operating income
2.5
3.5
3.7
8.3
6.9
Total operating income
109
134
150
183
176
% chg
40.1
23.1
11.7
22.0
(3.9)
Total expenditure
60
71
81
111
104
Net raw materials
29
36
43
56
51
Personnel
7
9
12
18
17
Other
24
26
27
38
37
EBITDA
47
60
65
63
65
% chg
37.6
28.9
8.4
(2.3)
2.1
(% of Net Sales)
43.6
45.9
44.4
36.3
38.3
Depreciation& amortisation
2
3
6
13
13
Interest & other charges
-
-
-
-
-
Other income
5
6
7
7
5
(% of PBT)
-
9
-
11
7
Share in profit of Associates
-
-
-
-
-
Recurring PBT
52
62
69
66
63
% chg
Extraordinary expense/(Inc.)
-
(12)
-
-
-
PBT (reported)
52
74
69
66
63
Tax
17.07
21.06
22.74
23.07
22.98
(% of PBT)
30.6
32.7
32.0
34.8
36.5
PAT (reported)
35
57
46
43
40
Add: Share of earnings of asso.
-
-
-
-
-
Less: Minority interest (MI)
-
-
-
(1)
-
Prior period items
-
-
-
-
-
PAT after MI (reported)
35
57
46
44
40
ADJ. PAT
35
45
46
44
40
% chg
40.8
28.3
3.0
(3.7)
(9.9)
(% of Net Sales)
32.8
43.5
31.6
25.4
23.7
Note: Consolidated for FY2015 and 9MFY2016
April 26, 2016
7
Thyrocare Technologies | IPO Note
Consolidated Balance Sheet
Y/E March (` cr)
FY2012
FY2013
FY2014
FY2015
9MFY2016
SOURCES OF FUNDS
Equity share capital
11
11
11
51
54
Preference Capital
-
-
-
-
-
Reserves & surplus
92
149
195
224
314
Shareholders funds
102
160
206
274
367
Minority Interest
-
-
-
36.0
-
Total loans
31
32
32
12
11
Deferred tax liability
(0)
0
1
(1)
(2)
Total liabilities
133
193
239
321
377
APPLICATION OF FUNDS
Net block
20
75
87
151
152
Capital work-in-progress
-
10
6
6
3
Goodwill
-
-
-
45
107
Long Term Loans and Adv.
3
5
6
14
10
Investments
24.0
77.2
119.0
85.9
81.6
Current assets
90
28
27
26
37
Cash
59
18
12
5
7
Loans & advances
22
2
4
9
14
Other
9
9
11
12
16
Current liabilities
3
4
6
7
14
Net current assets
86
24
21
19
23
Mis. Exp. not written off
-
-
-
-
-
Total assets
133
193
239
321
377
Note- Consolidated for FY2015 and 9MFY2016
April 26, 2016
8
Thyrocare Technologies | IPO Note
Research Team Tel: 022 - 39357800
DISCLAIMER
Angel Broking Private Limited (hereinafter referred to as “Angel”) is a registered Member of National Stock Exchange of India Limited,
Bombay Stock Exchange Limited and Metropolitan Stock Exchange of India Limited. It is also registered as a Depository Participant with
CDSL and Portfolio Manager with SEBI. It also has registration with AMFI as a Mutual Fund Distributor. Angel Broking Private Limited is
a registered entity with SEBI for Research Analyst in terms of SEBI (Research Analyst) Regulations, 2014 vide registration number
INH000000164. Angel or its associates has not been debarred/ suspended by SEBI or any other regulatory authority for accessing
/dealing in securities Market. Angel or its associates including its relatives/analyst do not hold any financial interest/beneficial
ownership of more than 1% in the company covered by Analyst. Angel or its associates/analyst has not received any compensation /
managed or co-managed public offering of securities of the company covered by Analyst during the past twelve months. Angel/analyst
has not served as an officer, director or employee of company covered by Analyst and has not been engaged in market making activity
of the company covered by Analyst.
This document is solely for the personal information of the recipient, and must not be singularly used as the basis of any investment
decision. Nothing in this document should be construed as investment or financial advice. Each recipient of this document should
make such investigations as they deem necessary to arrive at an independent evaluation of an investment in the securities of the
companies referred to in this document (including the merits and risks involved), and should consult their own advisors to determine
the merits and risks of such an investment.
Reports based on technical and derivative analysis center on studying charts of a stock's price movement, outstanding positions and
trading volume, as opposed to focusing on a company's fundamentals and, as such, may not match with a report on a company's
fundamentals.
The information in this document has been printed on the basis of publicly available information, internal data and other reliable
sources believed to be true, but we do not represent that it is accurate or complete and it should not be relied on as such, as this
document is for general guidance only. Angel Broking Pvt. Limited or any of its affiliates/ group companies shall not be in any way
responsible for any loss or damage that may arise to any person from any inadvertent error in the information contained in this report.
Angel Broking Pvt. Limited has not independently verified all the information contained within this document. Accordingly, we cannot
testify, nor make any representation or warranty, express or implied, to the accuracy, contents or data contained within this document.
While Angel Broking Pvt. Limited endeavors to update on a reasonable basis the information discussed in this material, there may be
regulatory, compliance, or other reasons that prevent us from doing so.
This document is being supplied to you solely for your information, and its contents, information or data may not be reproduced,
redistributed or passed on, directly or indirectly.
Neither Angel Broking Pvt. Limited, nor its directors, employees or affiliates shall be liable for any loss or damage that may arise from
or in connection with the use of this information.
Note: Please refer to the important ‘Stock Holding Disclosure' report on the Angel website (Research Section). Also, please refer to the
latest update on respective stocks for the disclosure status in respect of those stocks. Angel Broking Pvt. Limited and its affiliates may
have investment positions in the stocks recommended in this report.
April 26, 2016
9