IPO Note | E-commerce
March 19, 2016
Infibeam Incorporation
NEUTRAL
Issue Open: March 21, 2016
IPO Note
Issue Close: March 23, 2016
Infibeam Incorporation Ltd (Infibeam) is an e-commerce company focused on
Issue Details
developing integrated and synergistic e-commerce business models. Its
operations can be broadly categorized as BuildaBazaar (BaB) e-commerce
Face Value: `10
marketplace and E-retail website Infibeam.com. BaB provides cloud-based,
Present Eq. Paid up Capital: `42.7cr
modular and customizable digital solutions and other value added services to enable
merchants to set up online storefronts. Infibeam.com is a multi-category E-retailer where
Fresh Issue**: 1.04cr Shares
it has more than 5,000 registered merchants while it sells its own products as well.
Offer for sale: NIL
E-retail posting strong growth, Infibeam lags: At the moment, the penetration of
Post Eq. Paid up Capital: `53.1cr
internet users in India is at 19%, which is lower compared to countries like the US
(87%) and China (46%). With an expected improvement in the number of internet
Market Lot: 34 Shares
users in the country, the on-line shopper base is expected to improve from the
Fresh Issue (amount): `450cr
present 35mn to 180mn by 2020. As a result, the E-retail market size in India is
expected to grow from US$7bn in 2015 (1.2% of total retail) to US$44bn (4.0% of
Price Band: `360-432
total retail) in 2020. This positive outlook for the E-retail industry augurs well for
Post-issue implied mkt. cap `1,986cr*-
e-commerce players. Despite such strong anticipated growth rate of the industry,
2,294cr**
Infibeam suffers from having smaller scale, absence of funding and lacks the customer
Note:*at Lower price band and **Upper price band
mindshare that the other larger players like Flipkart have garnered. In the past, it (CAGR
of 22% over FY2012-15 to `221) has not been able to match the revenue growth of
bigger players like Flipkart India (CAGR of 260% over FY2012-15 to `9,537).
Book Building
Higher focus on the profitable BaB marketplace business: The BuildaBazaar
QIBs
75%
business of the company has grown at a CAGR of ~119% over FY2011-15 to
Non-Institutional
15%
`67cr. As a result, its contribution to the company’s overall top-line has increased
from negligible levels in FY2011 to 28.3% in 1HFY2016. The business’ operating
Retail
10%
margin stood at 58.0% for 1HFY2016. Thus, the BaB business is totally mitigating
the E-retail business’ losses. Going forward, the company intends to use part of
IPO proceeds to scale up its BaB business. However, the BaB business is in the
Post Issue Shareholding Pattern(%)
nascent stage and considering that technological landscape being dynamic, this
Promoters Group
45.5
makes BaB a high risk reward venture.
MF/Banks/Indian
Outlook Valuation: Infibeam’s E-retail business has a similar model as Flipkart
FIs/FIIs/Public & Others
54.5
and Snapdeal, but is significantly smaller than the two dominant players which
have strong PE backup. Its other business, i.e. BaB, in revenue terms is also
smaller (`67cr FY2015) compared to global players like Shopify.com (US$205mn
CY2015). Moreover, even if BaB business does gain dominant position in India, it
is insufficient to justify the valuation. Considering this, we believe that the EV/Sales
multiple of 4.3x-5.2x demanded by the company is steep. Given that the
company is still evolving, has an unproven profitability track record and the
expensive valuation, we have a Neutral recommendation on the issue.
Key Financial
Y/E March (` cr)
FY2012
FY2013
FY2014
FY2015
1HFY2016
Net Sales
128
151
207
288
171
% chg
-
18.2
37.2
39.0
-
Net Profit
(11)
(25)
(26)
(10)
7
% chg
-
-
-
-
-
OPM (%)
(7.7)
(14.6)
(9.8)
(0.8)
6.8
Amarjeet S Maurya
EPS (`)
(2.5)
(5.8)
(6.1)
(2.3)
1.5
+91 22 4000 3600 Ext: 6831
P/E (x)
-
-
-
-
-
P/BV (x)
213.6
76.5
22.3
8.7
-
RoE (%)
-
-
-
-
-
Milan Desai
RoCE (%)
-
-
-
-
-
EV/Sales (x)
14.8
12.5
8.9
6.2
-
+91 22 4000 3600 Ext: 6846
EV/EBITDA (x)
-
-
-
-
-
Source: Company, Angel Research; Note: Valuation ratios based on pre-issue outstanding shares and at upper end of price band
Please refer to important disclosures at the end of this report
1
Infibeam Incorporation | IPO Note
Company background
Infibeam is an e-commerce company focused on developing an integrated and
synergistic e-commerce business model. The company owns and operates
Infibeam BuildaBazaar (BaB) e-commerce marketplace and E-retail website
Infibeam.com. It has also launched its .ooo top level domain registry service which
helps attract merchants to its e-commerce platform.
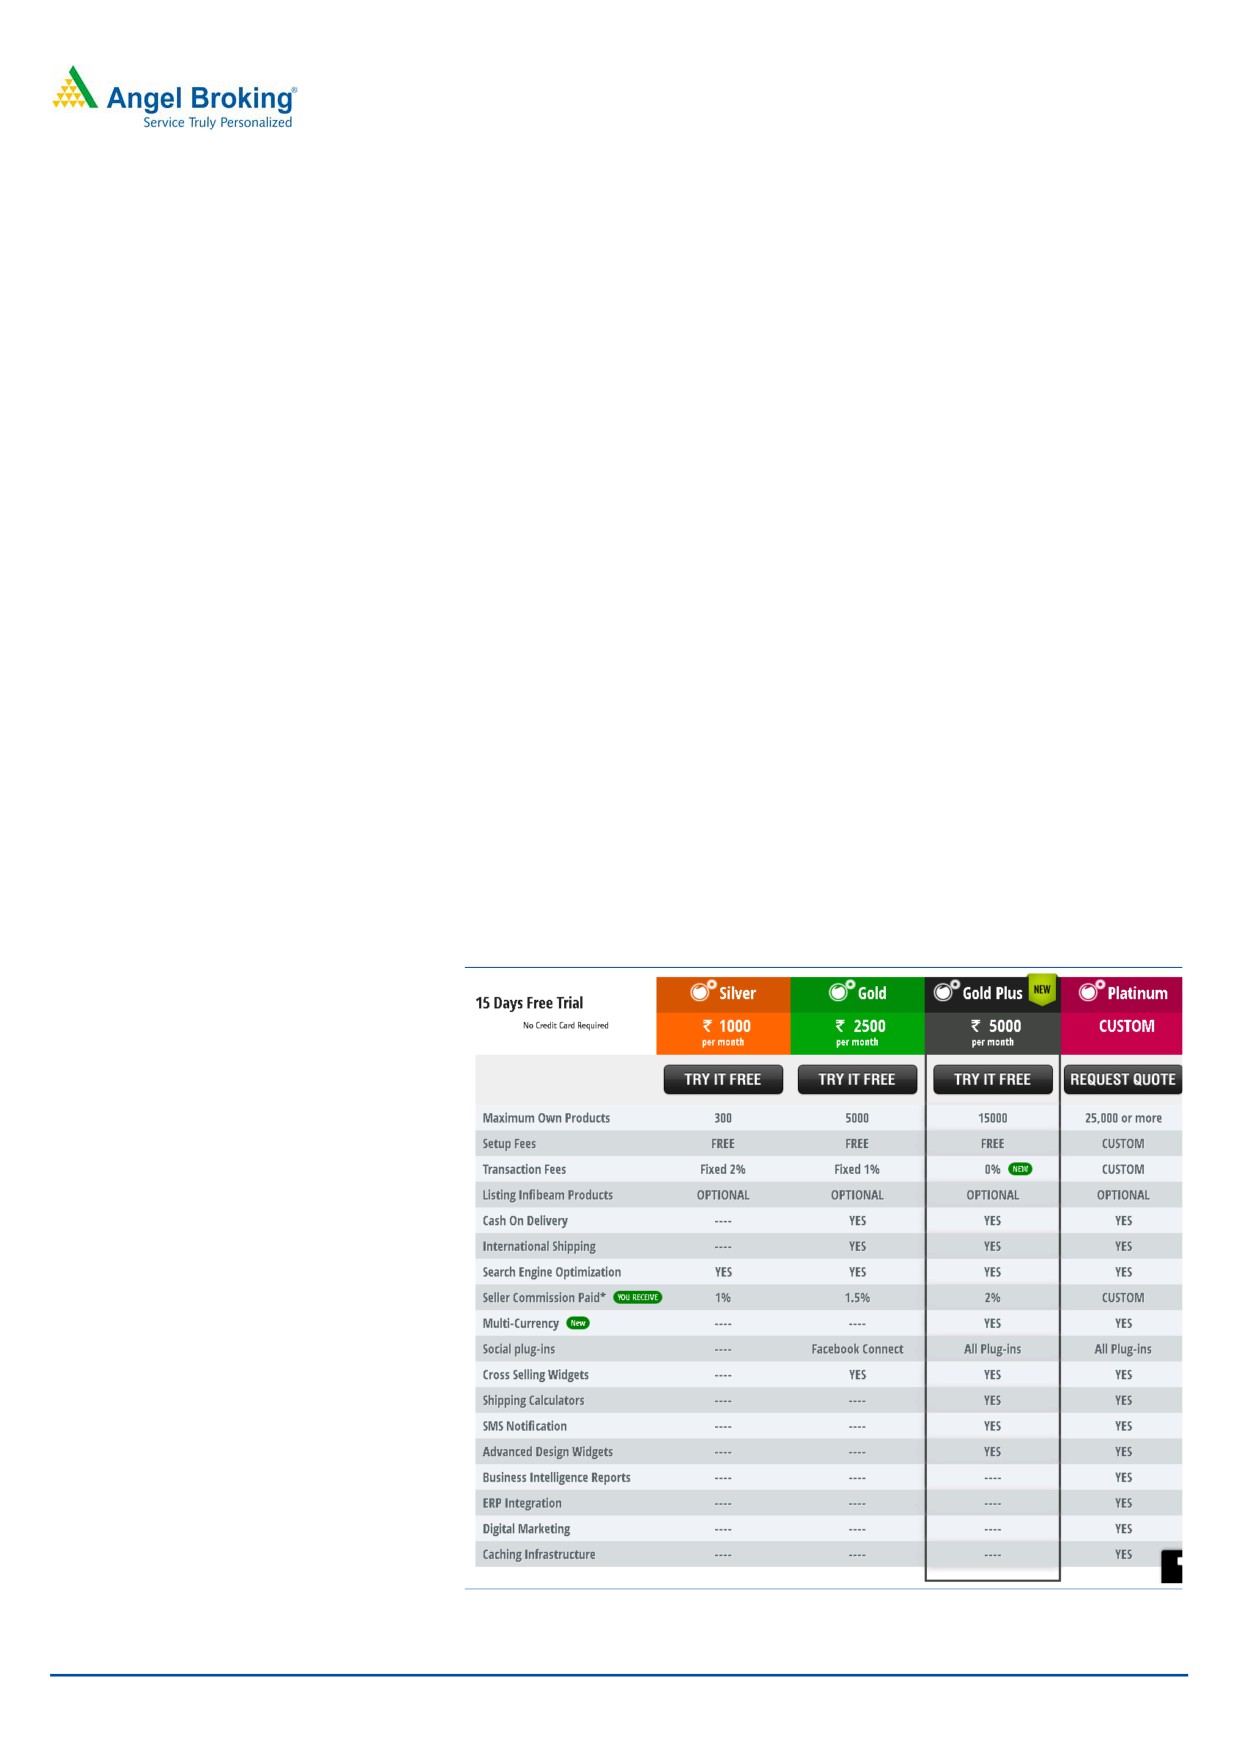
BaB provides cloud-based, modular and customizable digital solutions and other
value added services to enable merchants to set up online storefronts. BaB has
features that include comprehensive catalog management system that enables
businesses to manage their products and enables merchants to manage/fulfill/ship
orders. BaB also provides cost-effective marketing solutions and access payment
gateways amongst other features. Infibeam’s registered merchant base on BaB
marketplace as of December 2015 stood at 48,274.
The company’s E-retail website Infibeam.com is a multi-category E-retailer with
more than
15mn SKUs of products across
40 product categories (as on
31st December 2015). The company directly sells a wide range of products on
Infibeam.com, particularly focused on fast moving product categories. Apart from
selling its products, Infibeam had more than 5,000 registered merchants on its
E-retail website and more than 7.8mn active users as of December 31, 2015.
As of December 31, 2015, it had six warehouses and 12 logistics centers across
11 cities in India. It also had more than 900 employees which include a large
number of software engineers and IT experts.
Exhibit 1: Buildabazaar pricing and plans
Source: Company, Angel Research
March 19, 2016
2
Infibeam Incorporation | IPO Note
Issue details
The company is raising `450cr through fresh issue of equity shares in the price
band of `360-432. The fresh issue will constitute 19.6% of the post-issue paid-up
equity share capital of the company assuming the issue is subscribed at the upper
end of the price band.
Exhibit 2: Shareholding pattern
Particulars
Pre-Issue
Post-Issue
No. of shares
(%)
No. of shares
(%)
Promoters
2,41,65,455
56.6
2,41,65,455
45.5
Others
1,85,09,200
43.4
2,89,25,867
54.5
Total
4,26,74,655
100.0
5,30,91,322
100.0
Source: Company, Angel Research
Objects of the offer
Setting up of cloud data center and purchase of property for shifting of the
registered and corporate office of the company. The company estimates to
deploy `235cr for the said purpose.
~`38cr will be utilized for setting up 75 logistics centers.
`67cr is proposed to be used for purchase of software.
The balance will be used for general corporate purposes.
March 19, 2016
3
Infibeam Incorporation | IPO Note
Investment rationale
E-retail posting strong growth, Infibeam lags
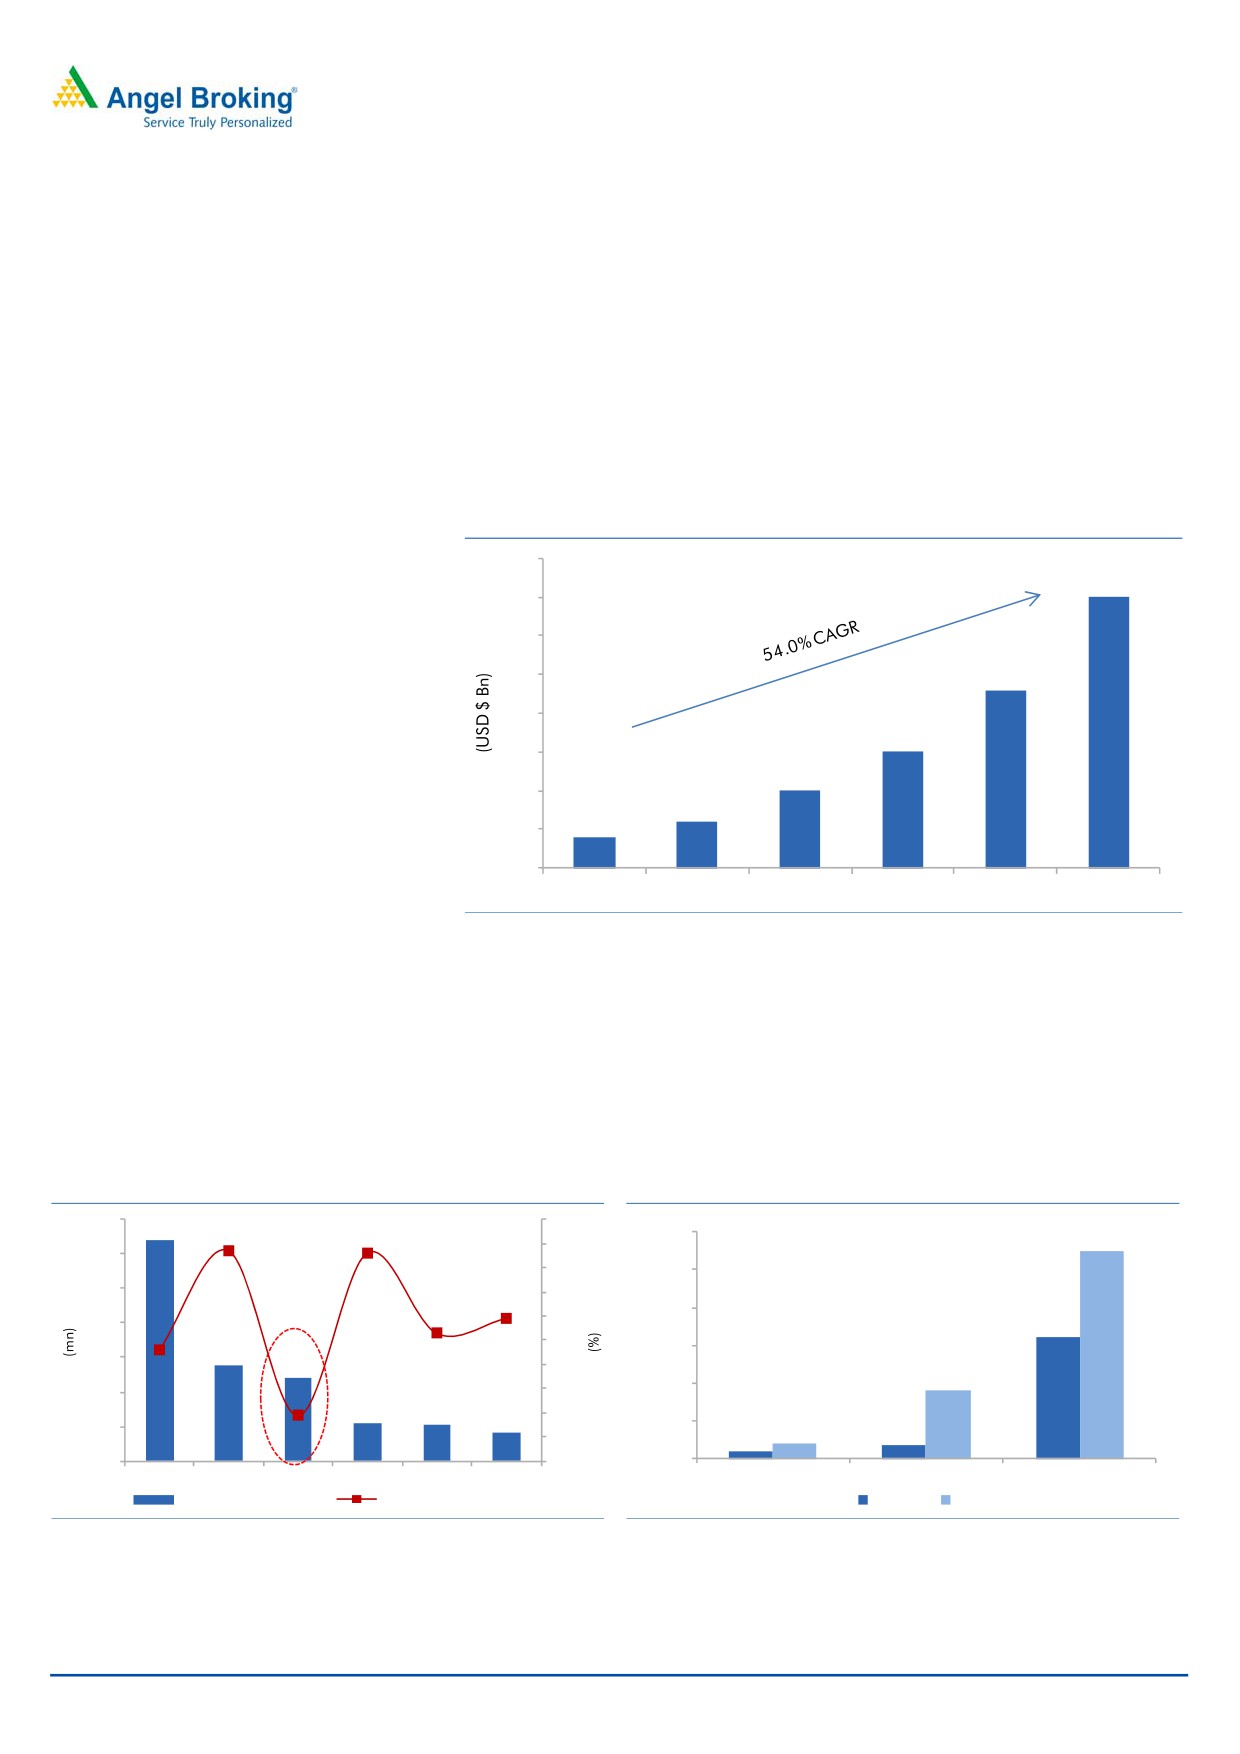
The E-retail market is among the fastest growing markets in India which is
estimated to have posted a CAGR of ~54.0% over CY2009-14 as per industry
reports. This has been on the back of factors such as improved internet
connectivity, discounted prices, convenient payment options, and customer friendly
return policies. Going forward, E-retail is expected to continue to grow on the back
of rising number of internet users and online buyers.
Exhibit 3: India E-retail growth
4.0
3.5
3.5
3.0
2.5
2.3
2.0
1.5
1.5
1
1.0
0.6
0.4
0.5
-
2009
2010
2011
2012
2013
2014
Source: IAMAI, CRISIL, Gartner, PwC
As per industry reports, there were an estimated 243mn internet users in India
(data as of 2014) in comparison to 279mn in the US and 641mn in China.
Internet penetration level in the country is lower at 19% compared to 46% in China
and 87% in the US, thus signaling significant scope of improvement. Of the
present ~318mn (estimated as of 2015 on basis of RHP data) internet users in
India, ~11% or 35mn are estimated to be shopping on-line.
Exhibit 4: Internet user base and Penetration (2014)
Exhibit 5: Projected user base and Penetration
700
100.0
600.0
550
90.0
600
87.0
86.0
80.0
500.0
500
70.0
59.0
53.0
400.0
400
60.0
320
46.0
50.0
300.0
300
19.0
40.0
180
200.0
200
30.0
20.0
100.0
100
40.0
35
10.0
19.0
641
279
243
109
107
84
-
-
-
China
US
India
Japan
Brazil
Russia
Internet Penetration
(%) On-line Shoppers (mn) Internet User Base (mn)
Internet User Base (LHS)
Internet Penetration (RHS)
Current
2020E
Source: PwC, Angel Research
Source: Company, Angel Research
March 19, 2016
4
Infibeam Incorporation | IPO Note
Driven by increasing penetration of smart phones and roll out of 4G internet
services, the internet user base is expected to grow to 550mn and the penetration
level is expected to reach ~40% by 2020. Consequently, the on-line shopper base
is estimated to grow from 35mn currently to 180mn over the same period. Led by
increasing internet users and on-line shopper base, the E-retail market size is
expected to grow from US$7bn in 2015 (1.2% of total retail) to US$44bn (4.0% of
total retail) in 2020.
Despite such strong anticipated growth rate of the industry, Infibeam suffers from
having smaller scale, absence of funding and lacks the customer mindshare that
the other larger players like Flipkart have garnered. In the past, it (CAGR of 22%
over FY2012-15 to `221) has not been able to match the revenue growth of
bigger players like Flipkart India (CAGR of 260% over FY2012-15 to `9,537).
Exhibit 6: E-retail and future prospects
2015
2020
Total Retail (USD bn)
585
1,100
Organized Retail (USD bn)
53
190
E-tail (% Total Retail)
1.2%
4.0%
E-tail (% Organized Retail)
13.0%
24.0%
Source: Company, Angel Research
Focus on profitable BaB market business
Apart from significant portion (~72% as on 1HFY2016) of the revenues derived
from the sale of products via its E-retail website Infibeam.com, the company also
generates revenue from solutions provided through BaB market place. The revenue
from sale of software and e-commerce related ancillary services has grown at a
CAGR of 118.7% over FY2011-15 to `67cr and the segment has posted revenue
of `48cr for 1HFY2016. The BaB business is profitable compared to products
business with margins at 58% for 1HFY2016. Going forward, the company intends
to scale up its BaB business by boosting its IT infrastructure and logistics
capabilities, strengthening merchant acquisitions, and increasing value added
offerings. The company has steadily increased the share of the non-products
business to
28.3% of total revenues as of 1HFY2016 and its increasing
contribution will support the overall profitability of the company. However, the BaB
business is in the nascent stage and considering that technological landscape being
dynamic, this makes BaB a high risk reward venture.
March 19, 2016
5
Infibeam Incorporation | IPO Note
Exhibit 7: Segmental break up
Particulars
FY2012
FY2013
FY2014
FY2015
1HFY2016
Revenue
Sale of products
123
139
177
221
123
change yoy (%)
140.3
13.2
26.9
25.4
% of total
96.1
92.0
85.1
76.8
71.7
Sale of software and e-commerce related ancillary services
5
12
31
67
48
change yoy (%)
71.2
140.8
155.7
117.2
% of total
3.9
8.0
14.9
23.2
28.3
Total net sales
128
151
207
288
171
Profit
Sale of products
(5)
(13)
(19)
(23)
(5)
% of sales
(3.9)
(9.1)
(10.7)
(10.4)
(3.9)
Sale of software and e-commerce related ancillary services
2
6
19
40
28
% of sales
35.5
49.4
62.6
59.8
58.0
Unallocated Expenses
7
17
27
29
19
Total
(10)
(24)
(26)
(12)
4
Source: Company, Angel Research
Valuation
Infibeam’s E-retail business has a similar model as Flipkart and Snapdeal, but is
significantly smaller than the two dominant players which have strong PE backup.
Its other business, i.e. BaB, in revenue terms is also smaller (`67cr FY2015)
compared to global players like Shopify.com (US$205mn CY2015). Moreover,
even if BaB business does gain dominant position in India, it is insufficient to justify
the valuation. Considering this, we believe that the EV/Sales multiple of 4.3x-5.2x
demanded by the company is steep. Given that the company is still evolving, has
an unproven profitability track record and the expensive valuation, we have a
Neutral recommendation on the issue.
Risks
Intense competition: The company faces intense competition from players like
Flipkart, Snapdeal, etc for its E-retail business which entails heavier discounting to
gain market share, thus resulting in higher operating losses for the business.
Unproven track record for profitability: The company has reported continuous
losses from `18cr in FY2011 to `10cr in FY2015. Although, it has reported
maiden profits amounting to `6cr in 1FY2016 there lacks a proven track record in
terms of profitability.
Government regulatory issues: Any unfavourable regulations for internet and
ecommerce industry can have a negative impact on the company’s business
growth.
March 19, 2016
6
Infibeam Incorporation | IPO Note
Profit & Loss (consolidated)
Y/E March (` cr)
FY2012
FY2013
FY2014
FY2015
1HFY16
Total operating income
128
151
207
288
171
% chg
-
18.2
37.2
39.0
-
Total Expenditure
138
173
228
291
160
Raw Material
120
134
168
223
118
Employee Cost
7
11
22
21
13
Other Expenses
11
29
37
47
29
EBITDA
(10)
(22)
(20)
(2)
12
% chg
-
-
-
-
-
(% of Net Sales)
(7.7)
(14.6)
(9.8)
(0.8)
6.8
Depreciation& Amortisation
1
3
7
13
8
EBIT
(11)
(25)
(28)
(15)
3
% chg
-
-
-
-
-
(% of Net Sales)
(8.7)
(16.6)
(13.4)
(5.3)
2.0
Interest & other Charges
1
1
1
1
1
Other Income
1
1
2
7
3
(% of PBT)
(12.1)
(5.7)
(6.4)
(71.0)
54.0
Recurring PBT
(11)
(25)
(27)
(10)
6
% chg
-
-
-
-
-
Prior Period & Extra. Exp/(Inc.)
-
-
-
-
-
PBT (reported)
(11)
(25)
(27)
(10)
6
Tax
-
-
0
0
-
(% of PBT)
-
-
(0.0)
(0.1)
-
PAT before MI & Adj. (reported)
(11)
(25)
(27)
(10)
6
Extraordinary Items
-
-
-
-
-
Less: Minority interest (MI)
-
0
1
1
0
Less: Share of Associates
(0)
0
(0)
(1)
(0)
ADJ. PAT
(11)
(25)
(26)
(10)
7
% chg
-
-
-
-
-
(% of Net Sales)
(8.5)
(16.5)
(12.5)
(3.4)
3.8
Basic EPS (`)
(2.5)
(5.8)
(6.1)
(2.3)
1.5
Fully Diluted EPS (`)
(2.5)
(5.8)
(6.1)
(2.3)
1.5
% chg
-
-
-
-
-
March 19, 2016
7
Infibeam Incorporation | IPO Note
Balance Sheet (consolidated)
Y/E March (` cr)
FY2012
FY2013
FY2014
FY2015
1HFY16
SOURCES OF FUNDS
Equity Share Capital
30
38
40
43
43
Reserves& Surplus
(29)
(14)
43
170
183
Equity Application Money
8
-
-
-
-
Shareholders’ Funds
9
24
83
213
225
Minority Interest
2
2
1
0
-
Total Loans
55
43
9
5
5
Long-term provisions
1
0
1
1
1
Other long term liabilities
-
-
-
-
0
Total Liabilities
66
69
93
219
232
APPLICATION OF FUNDS
Gross Block
17
31
56
75
92
Less: Acc. Depreciation
8
11
17
30
39
Net Block
9
20
39
45
54
Capital Work in Progress
4
6
8
26
24
Goodwill
5
5
6
6
6
Investments
0
0
-
-
-
Current Assets
15
51
37
121
148
Inventories
2
5
9
12
18
Sundry Debtors
7
36
17
33
43
Cash
1
4
4
60
70
Loans & Advances
4
6
5
11
11
Other Assets
0
1
1
5
6
Current liabilities
8
51
42
49
52
Net Current Assets
6
0
(5)
72
96
Long term loans and advances
41
38
44
69
52
Other Non Current Assets
0
0
1
0
0
Mis. Exp. not written off
-
-
-
-
-
Total Assets
66
69
93
219
232
March 19, 2016
8
Infibeam Incorporation | IPO Note
Cash Flow Statement (consolidated)
Y/E March (`cr)
FY2012
FY2013
FY2014
FY2015
1HFY16
Profit before tax
(11)
(25)
(27)
(10)
6
Depreciation
1
3
7
13
8
Change in Working Capital
(31)
9
(2)
(18)
(17)
Interest / Dividend (Net)
1
1
0
(3)
(3)
Direct taxes paid
0
(0)
(1)
(5)
(1)
Others
(1)
2
12
2
2
Cash Flow from Operations
(40)
(11)
(11)
(21)
(3)
(Inc.)/ Dec. in Fixed Assets
(5)
(16)
(15)
(50)
9
(Inc.)/ Dec. in Investments
(0)
(1)
(2)
(41)
10
Cash Flow from Investing
(6)
(17)
(17)
(91)
19
Issue of Equity
-
7
65
123
-
Inc./(Dec.) in loans
48
24
(37)
45
(6)
Dividend Paid (Incl. Tax)
-
-
-
-
-
Interest / Dividend (Net)
(1)
(1)
(0)
(1)
(0)
Cash Flow from Financing
47
30
28
168
(6)
Inc./(Dec.) in Cash
1
3
1
56
10
Opening Cash balances
0
1
4
4
60
Acquisition / (sale) of business
-
(0)
0
-
-
Closing Cash balances
1
4
4
60
70
March 19, 2016
9
Infibeam Incorporation | IPO Note
Key Ratios
Y/E March
FY2012
FY2013
FY2014
FY2015
Valuation Ratio (x)
P/E (on FDEPS)
-
-
-
-
P/CEPS
-
-
-
557.1
P/BV
213.6
76.5
22.3
8.7
Dividend yield (%)
0.0
0.0
0.0
0.0
EV/Sales
14.8
12.5
8.9
6.2
EV/EBITDA
-
-
-
-
EV / Total Assets
25.5
15.8
13.7
6.7
Per Share Data (`)
EPS (Basic)
(2.5)
(5.8)
(6.1)
(2.3)
EPS (fully diluted)
(2.5)
(5.8)
(6.1)
(2.3)
Cash EPS
(2.2)
(5.1)
(4.3)
0.8
DPS
0.0
0.0
0.0
0.0
Book Value
2.0
5.6
19.3
49.8
Returns (%)
ROCE
-
-
-
-
Angel ROIC (Pre-tax)
-
-
-
-
ROE
-
-
-
-
Turnover ratios (x)
Asset Turnover (Gross Block)
7.5
4.9
3.7
3.8
Inventory / Sales (days)
5
13
15
16
Receivables (days)
21
86
30
42
Payables (days)
14
92
44
26
Wc cycle (ex-cash) (days)
12
7
2
31
Note: Valuation ratios based on pre-issue outstanding shares and at upper end of the price band
March 19, 2016
10
Infibeam Incorporation | IPO Note
Research Team Tel: 022 - 39357800
DISCLAIMER
Angel Broking Private Limited (hereinafter referred to as “Angel”) is a registered Member of National Stock Exchange of India Limited,
Bombay Stock Exchange Limited and Metropolitan Stock Exchange of India Limited. It is also registered as a Depository Participant with
CDSL and Portfolio Manager with SEBI. It also has registration with AMFI as a Mutual Fund Distributor. Angel Broking Private Limited is
a registered entity with SEBI for Research Analyst in terms of SEBI (Research Analyst) Regulations, 2014 vide registration number
INH000000164. Angel or its associates has not been debarred/ suspended by SEBI or any other regulatory authority for accessing
/dealing in securities Market. Angel or its associates including its relatives/analyst do not hold any financial interest/beneficial
ownership of more than 1% in the company covered by Analyst. Angel or its associates/analyst has not received any compensation /
managed or co-managed public offering of securities of the company covered by Analyst during the past twelve months. Angel/analyst
has not served as an officer, director or employee of company covered by Analyst and has not been engaged in market making activity
of the company covered by Analyst.
This document is solely for the personal information of the recipient, and must not be singularly used as the basis of any investment
decision. Nothing in this document should be construed as investment or financial advice. Each recipient of this document should
make such investigations as they deem necessary to arrive at an independent evaluation of an investment in the securities of the
companies referred to in this document (including the merits and risks involved), and should consult their own advisors to determine
the merits and risks of such an investment.
Reports based on technical and derivative analysis center on studying charts of a stock's price movement, outstanding positions and
trading volume, as opposed to focusing on a company's fundamentals and, as such, may not match with a report on a company's
fundamentals.
The information in this document has been printed on the basis of publicly available information, internal data and other reliable
sources believed to be true, but we do not represent that it is accurate or complete and it should not be relied on as such, as this
document is for general guidance only. Angel Broking Pvt. Limited or any of its affiliates/ group companies shall not be in any way
responsible for any loss or damage that may arise to any person from any inadvertent error in the information contained in this report.
Angel Broking Pvt. Limited has not independently verified all the information contained within this document. Accordingly, we cannot
testify, nor make any representation or warranty, express or implied, to the accuracy, contents or data contained within this document.
While Angel Broking Pvt. Limited endeavors to update on a reasonable basis the information discussed in this material, there may be
regulatory, compliance, or other reasons that prevent us from doing so.
This document is being supplied to you solely for your information, and its contents, information or data may not be reproduced,
redistributed or passed on, directly or indirectly.
Neither Angel Broking Pvt. Limited, nor its directors, employees or affiliates shall be liable for any loss or damage that may arise from
or in connection with the use of this information.
Note: Please refer to the important ‘Stock Holding Disclosure' report on the Angel website (Research Section). Also, please refer to the
latest update on respective stocks for the disclosure status in respect of those stocks. Angel Broking Pvt. Limited and its affiliates may
have investment positions in the stocks recommended in this report.
March 19, 2016
11