Calculate your SIP ReturnsExplore

Key Takeaways From IIP Numbers

05 August 20224 mins read by Angel One
Key Takeaways From IIP Numbers
ShareShare on 1Share on 2Share on 3Share on 4Share on 5

The IIP numbers for the month of March 2017 came in slightly better than expected. Remember, IIP numbers are normally announced with a 1-month lag as compared to CPI and WPI numbers. Here are some of the key takeaways from the IIP numbers that were announced for the month of March 2017…

Key Takeaways from the IIP announcement for March 2017…

  • Like the WPI for the latest month, the Index of Industrial Production (IIP) also shifted its base year from 2004-05 to 2011-12. This will not only synchronize the IIP with calculations of WPI and the overall GDP, but also make the definition and components of IIP more in tune with the current market requirements.
  • The IIP continues to be composed of the 3 core segments viz. Mining, Manufacturing and Electricity. However, the weightage of these components have undergone a modification. For example, the weight of manufacturing in IIP has gone up from 75.527% to 77.633% while the weight of Electricity has gone down from 10.316% to 7.994%. The change in the weight of mining is marginal. While the share of electricity may have gone down, it has included renewable power generation to better reflect the current power mix.
  • The basket comprising the IIP has been rationalized with the shift in the base year. For example, the number of items considered for IIP calculation has been increased from 620 to 809 items. Some of the key products added into the IIP basket include steroids, hormonal preparations, cement clinker, medical & surgical accessories, pre-fabricated blocks etc. Similarly, some of the products that have been dropped include films, colour TV tubes, calculators, Gutka etc.
  • At a broad level, the overall IIP for March 2017 showed an increase of 2.7% as compared to 1.9% in the month of February 2017. However, if we were to look at a 1-year comparison, then the IIP in the month of March 2017 at 2.7% was sharply lower than 5.5% IIP growth achieved in March 2016.
  • Among the 3 key components of the IIP, manufacturing output grew by 1.2%, electricity production grew by 6.2% and mining grew by 9.7%. The big concern on the IIP front continues to be the tepid growth in manufacturing. It continues to be the biggest contributor of IIP and the index is unlikely to pick up unless the manufacturing component picks up.
  • Another way of look at IIP is on the basis of user-based classification. On this criterion, primary goods saw a growth of 5.7%, construction goods at 0.8% and consumer non-durables at 7.6%. Apart from that, capital goods contracted by -1%, intermediate goods contracted by -1.4% and consumer durables by -0.8%.
  • The moral of the story appears to be that the real strain may still be on the capital goods demand front. That is because, the capital investment cycle is not really picking up and that is leading to the back-ending of capital investments in the economy. That also explains why the manufacturing growth continues to remain tepid and tends to fluctuate between positive and negative territory.

Impact of the changed methodology on annual IIP figure…

The monthly IIP numbers that we normally analyse have a big drawback in that they are too much influenced by the base effect. If the corresponding period last year was a high IIP month or a low IIP month, then it distorts the picture. A better way to look at the IIIP will be to look at the IIP on annual terms; more so with the completion of the fiscal year 2017-18…

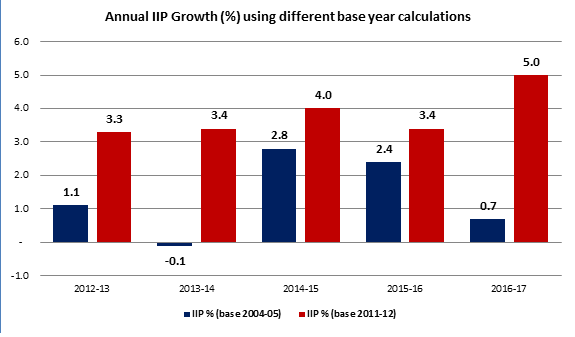
The above chart captures the difference in the IIP growth figure changed retrospectively with a shift in the base year. It is clear for the last 5 years, changing the base for IIP calculation to 2011-12 is resulting in a distinct improvement in the IIP. The RBI may interpret this as a signal that the growth green-shoots are already visible and hence rate cuts may not be required to prop up growth. That is something that will be evident only in the next monetary policy in June.

When one takes a combined view of the recent CPI inflation, WPI inflation, IIP growth and the PMI data, it is clear that there appears to be traction as far as the pick-up in the economy is concerned. How far it translates into GDP growth remains to be seen!

Enjoy Zero Brokerage on Equity Delivery
4.4 Cr+DOWNLOADS
Enjoy Zero Brokerage on Equity Delivery

Get the link to download the App

Send App Link

Enjoy Zero Brokerage on
Equity Delivery