Calculate your SIP ReturnsExplore

The Core Sector number for the month of March 2017 and the PMI Manufacturing number for the month of April; both surprised on the upside. The Jan-Mar quarter was the first full quarter after the impact of demonetization and the negation of the lag effects of demonetization was supposed to be over by the end of March. Which is why the March and the April numbers become quite critical? The Core sector growth consists of 8 sectors that comprise the core of the Indian economy. Core sector is also important as it constitutes nearly 38% of the IIP and therefore becomes a core determinant of IIP.
Core Sector growth surprises on the upside…
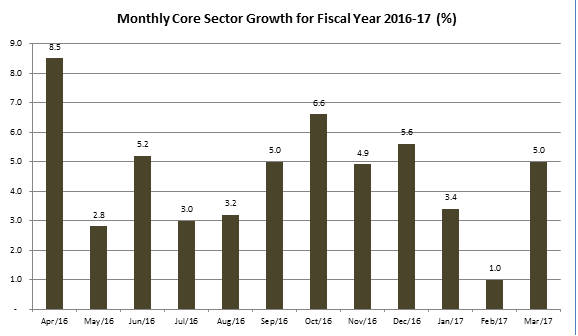
The core sector growth for the month of March 2017 came in at 5%, a sharp improvement from the 1% growth recorded in the month of February. One of the key contributors to the core sector output growth was coal, which grew by 10% on the back of favourable government policies for the coal sector. Even crude oil, which has been a laggard due to weak global prices, actually saw a 1% increase in production. This number could see a further increase if crude sustains above the $50/bbl mark and also as more extraction is coming on board. Similarly, natural gas also recorded a growth of 8.3% for March on a YOY basis, but this could be attributed to the base effect. Among the other major positive contributors, steel saw a growth of 11% in March on the back of very positive anti-dumping policies adopted by the government. Electricity also saw a positive growth of 6% on the back of more stable coal supply for thermal plants.
On the negative side, cement showed a sharp decline of around 7% on a YOY basis as supply was stretched to keep prices competitive. The other laggard was fertilizers, but that could change drastically if the government gets aggressive on its ambitious project to become self-sufficient in urea over the next 3 years. Core sector has been encouraging for March, but the impact on IIP may still be limited unless manufacturing sector picks up in a big way. That is something that has been quite slow to take off. It is also evident that the core sectors that have received government support have been the most aggressive in growth. Steel, electricity and coal are classic cases in point. It is hoped that the government’s favourable policies towards self-sufficiency in fertilizers and oil will go a long way in giving a push to other constituents of the core sector growth too.
PMI Manufacturing shows traction but PMI Services disappoints…
The Purchase Manager Index (PMI) put out by Markit Economics is a veritable monthly gauge of whether the manufacturing and inventory building up is happening. It is a quick measure of business optimism. Normally, a PMI number above 50 indicates that business is on an expansionary mode while PMI below 50 indicates that the business is in a contractionary mode.
For the month of April 2017, the PMI Manufacturing came in at 52.5, which was almost at par with the PMI reported for manufacturing for the month of March. Broadly, the positive trend in the PMI Manufacturing indicates 3 things. Firstly, it indicates that new orders are coming in at a rapid pace and that is a good sign of business optimism. Secondly, the output expansion has been maintained at the same level as the previous month but growth is really not happening. However, output increase should follow as a logical corollary to a build up in orders. Thirdly, there seems to be some improvement in employment levels and in inventory levels. This is positive because it means that that there are signs of real output growth and optimism as it is leading to an increase in job creation. At the same time, higher inventory levels also shows confidence among business managers regarding a pick-up in demand.
Services PMI for April was slightly disappointing. In fact, the lag effects of demonetization are continuing on the services sector even 4 months after demonetization. The PMI Services for April 2017 fell to 50.2 from 51.5 in March. This indicates that the service sector is still expanding but at a much lower pace sequentially. This is a lag effect of demonetization. It needs to be remembered that post the onset of demonetization, the real cuts were seen in PMI-Services. It is also a reminder that the services sector may steel be feeling the pinch of the cash crunch and may not be entirely out of the woods.
Getting the bigger picture right…
So, what exactly do we make from the combination of core sector data and the PMI numbers? To begin with, there is definitely some traction visible in the manufacturing sector. Of course, the traction is much more visible in sectors like steel, electricity and coal production where government support has been more forthcoming. That could augur well for fertilizers and oil; both of which are likely to get government attention as a step towards self-sufficiency. However, the tepid Services-PMI indicates that the tail effect of demonetization continues to hit the services sector. That could be the data point to watch out for!
Enjoy Zero Brokerage on Equity Delivery
Join our 2 Cr+ happy customers

Get the link to download the App

Enjoy Zero Brokerage on
Equity Delivery